| Param | Original file | Final file |
|---|---|---|
| Filename | modeM0/AS1G05_009T02_9000000618_04863cztM0_level2.evt | modeM0/AS1G05_009T02_9000000618_04863cztM0_level2_quad_clean.evt |
| Size (bytes) | 1,102,403,520 | 147,591,360 |
| Size | 1.0 GB | 140.8 MB |
| Events in quadrant A | 6,542,154 | 928,270 |
| Events in quadrant B | 8,826,005 | 892,832 |
| Events in quadrant C | 6,224,363 | 902,268 |
| Events in quadrant D | 10,898,315 | 829,997 |
| Mode SS | |||
|---|---|---|---|
| Quadrant | BADHDUFLAG | Total packets | Discarded packets |
| A | 0 | 270 | 0 |
| B | 0 | 270 | 0 |
| C | 0 | 270 | 0 |
| D | 0 | 270 | 0 |
| Mode M0 | |||
|---|---|---|---|
| Quadrant | BADHDUFLAG | Total packets | Discarded packets |
| A | 0 | 28335 | 4 |
| B | 0 | 35059 | 3 |
| C | 0 | 27594 | 3 |
| D | 0 | 41462 | 3 |
| Mode M9 | |||
|---|---|---|---|
| Quadrant | BADHDUFLAG | Total packets | Discarded packets |
| A | 0 | 31 | 0 |
| B | 0 | 31 | 0 |
| C | 0 | 31 | 0 |
| D | 0 | 32 | 0 |
| Quadrant | Total seconds | Saturated seconds | Saturation percentage |
|---|---|---|---|
| A | 13250 | 208 | 1.569811% |
| B | 13250 | 1007 | 7.600000% |
| C | 13250 | 96 | 0.724528% |
| D | 13250 | 1315 | 9.924528% |
Noise dominated data is calculated using 1-second bins in cleaned event files. If a bin has >2000 counts, and if more than 50% of those come from <1% of pixels, then it is considered to be noise-dominated and hence unusable.
| Quadrant | # 1 sec bins | Bins with >0 counts | Bins with >2000 counts | High rate bins dominated by noise | Noise dominated (total time) | Noise dominated (detector-on time) | Marked lightcurve |
|---|---|---|---|---|---|---|---|
| A | 17886 | 13251 | 29 | 29 | 0.16% | 0.22% | 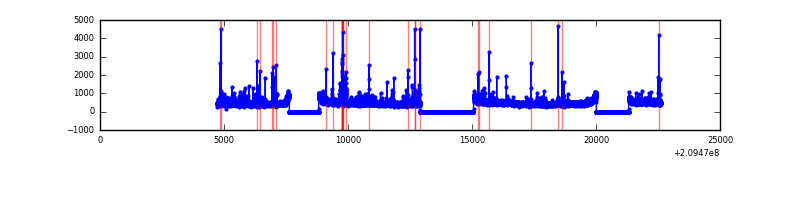 |
| B | 17886 | 13252 | 671 | 671 | 3.75% | 5.06% | 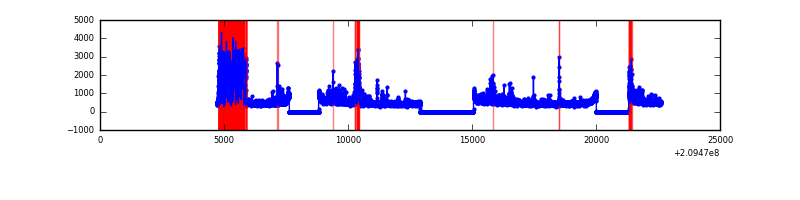 |
| C | 17886 | 13252 | 9 | 9 | 0.05% | 0.07% | 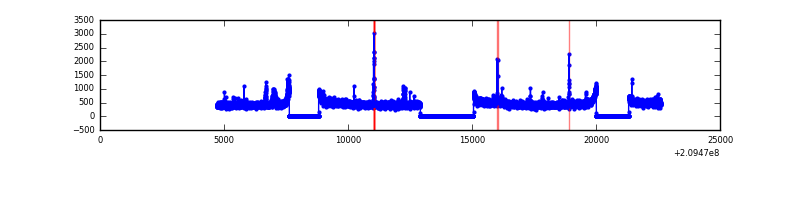 |
| D | 17885 | 13251 | 843 | 843 | 4.71% | 6.36% | 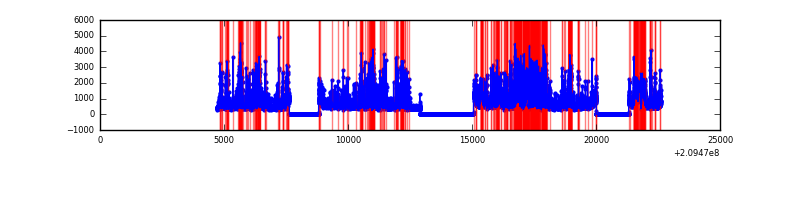 |
Top three noisy pixels from each quadrant. If the there are fewer than three noisy pixels in the level2.evt file, extra rows are filled as -1
| Pixel properties | Quadrant properties | ||||||
|---|---|---|---|---|---|---|---|
| Quadrant | DetID | PixID | Counts | Sigma | Mean | Median | Sigma |
| A | 13 | 251 | 211997 | 649.99 | 1610 | 1578 | 323.7 |
| A | 8 | 15 | 48631 | 145.35 | 1610 | 1578 | 323.7 |
| A | 0 | 31 | 33422 | 98.37 | 1610 | 1578 | 323.7 |
| B | 10 | 16 | 1969834 | 6508.15 | 1596 | 1562 | 302.4 |
| B | 4 | 80 | 273517 | 899.23 | 1596 | 1562 | 302.4 |
| B | 7 | 252 | 159430 | 522.0 | 1596 | 1562 | 302.4 |
| C | 12 | 4 | 107313 | 295.95 | 1557 | 1569 | 357.3 |
| C | 9 | 247 | 32975 | 87.9 | 1557 | 1569 | 357.3 |
| C | 13 | 61 | 12873 | 31.64 | 1557 | 1569 | 357.3 |
| D | 1 | 31 | 2692630 | 7381.66 | 1499 | 1455 | 364.6 |
| D | 2 | 234 | 540267 | 1477.92 | 1499 | 1455 | 364.6 |
| D | 2 | 63 | 515536 | 1410.08 | 1499 | 1455 | 364.6 |
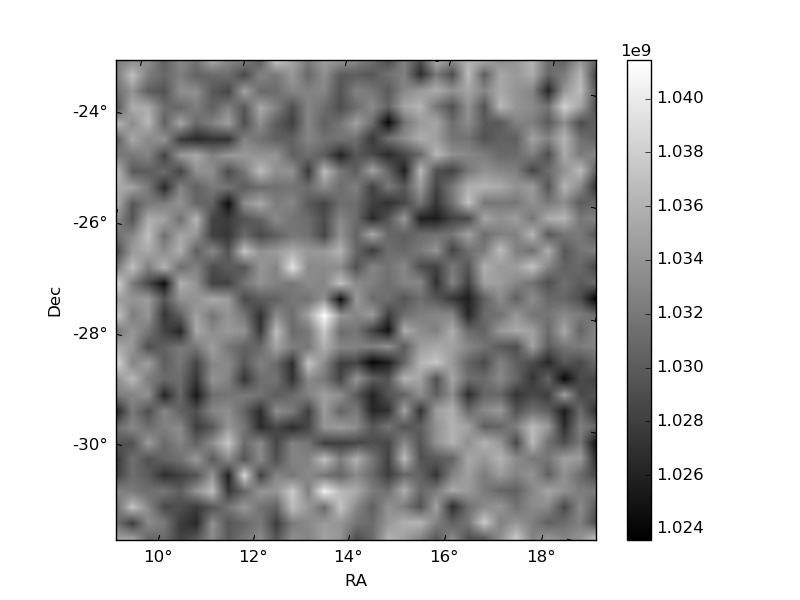
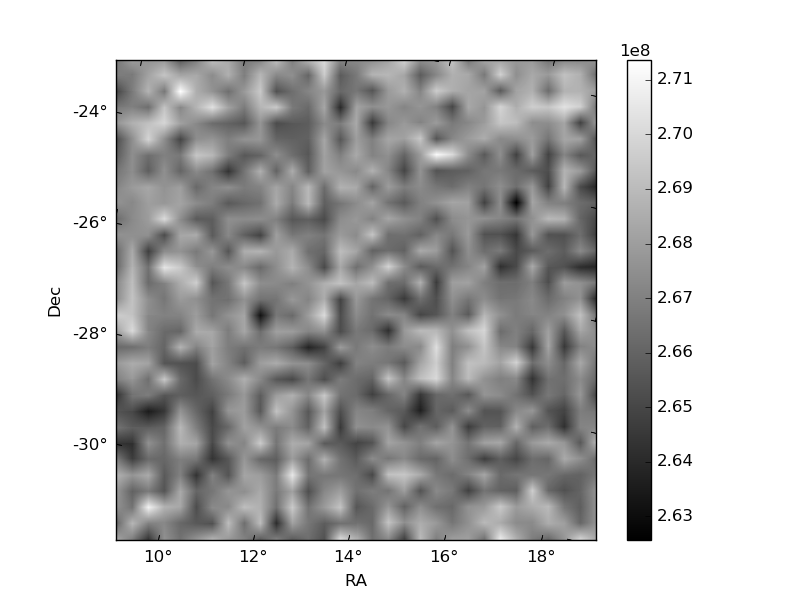
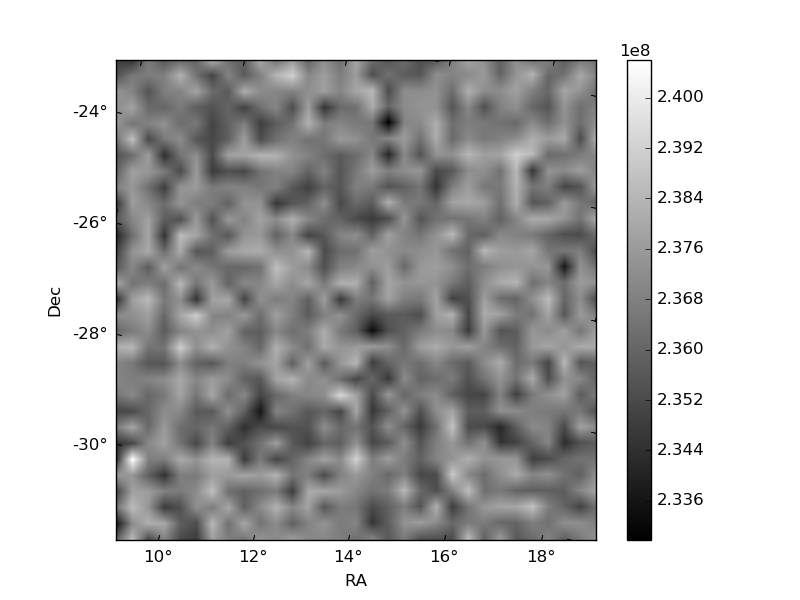
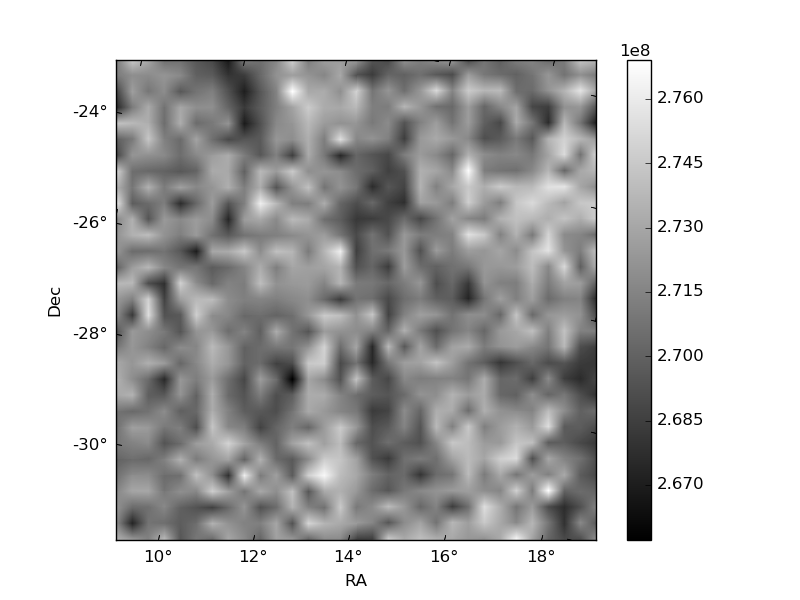
Histogram calculated using DETX and DETY for each event in the final _common_clean file
| Quadrant A | 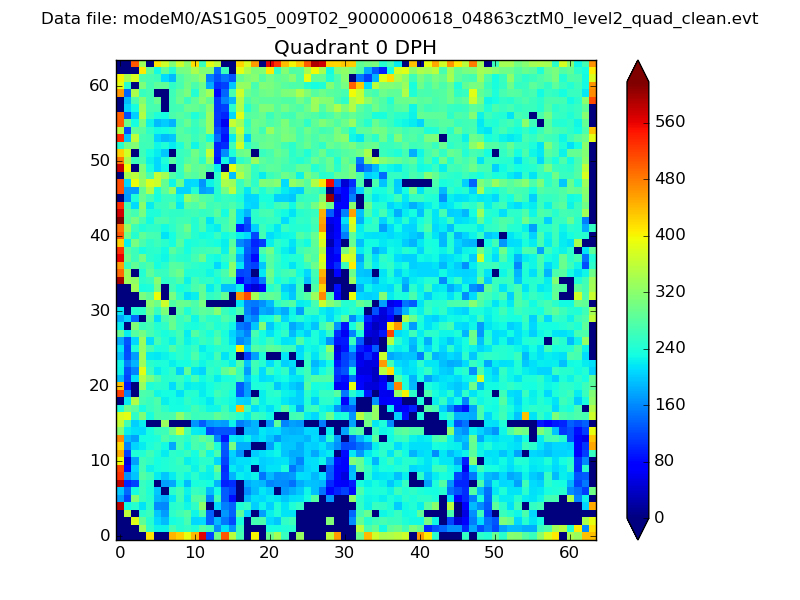 |
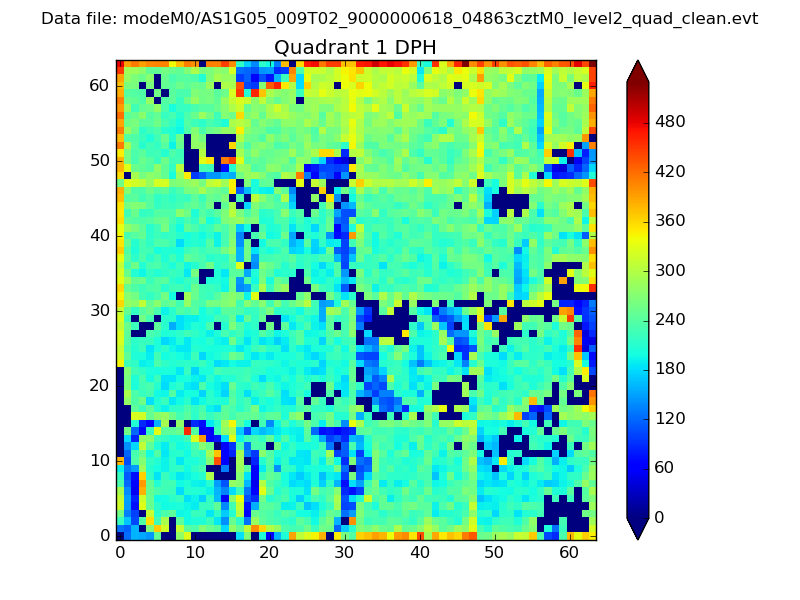 |
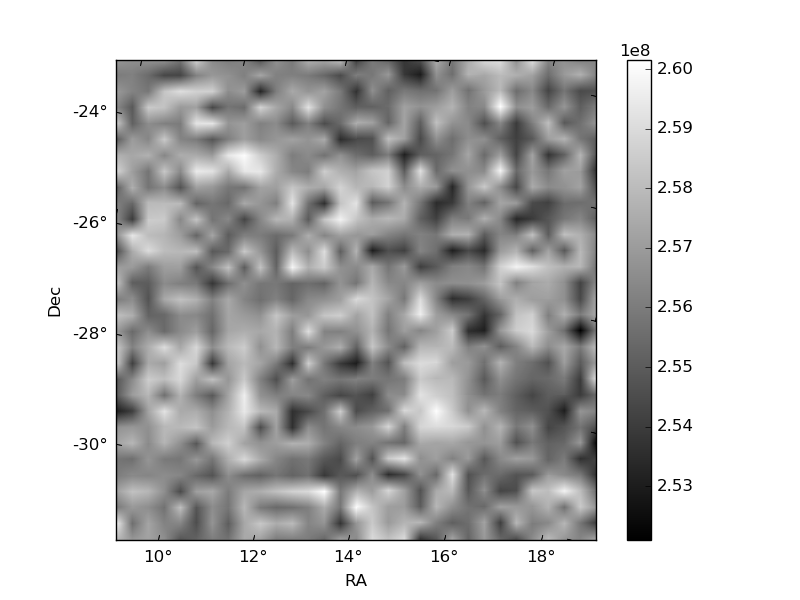
Quadrant B |
|---|---|---|---|
| Quadrant D | 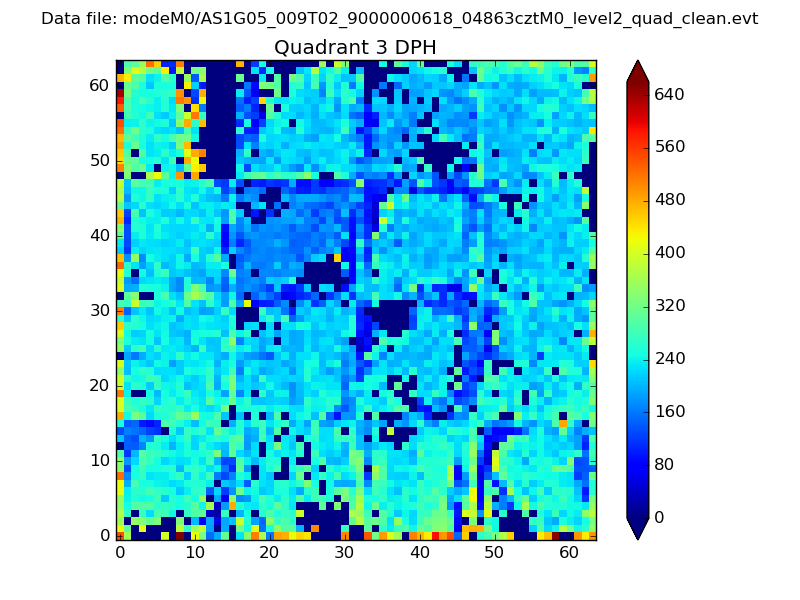 |
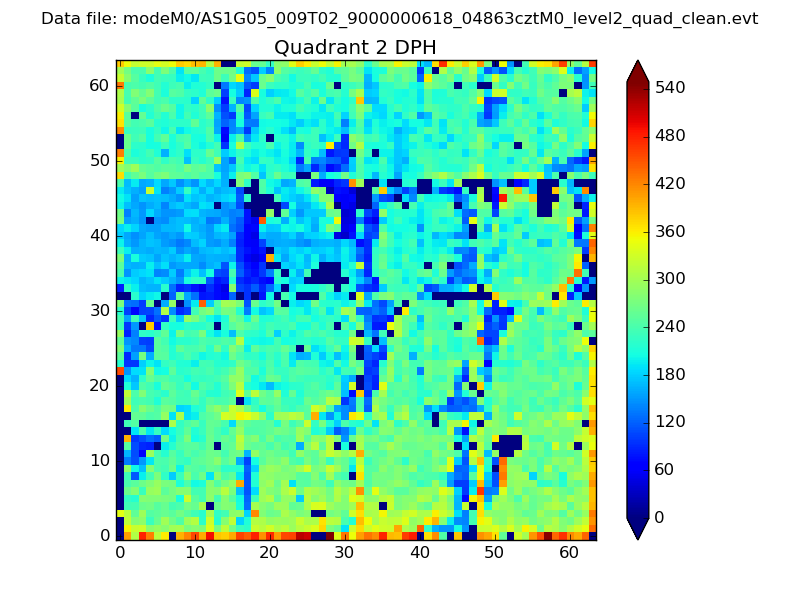 |
Quadrant C |
| Plot type | Count rate plots | Images |
|---|---|---|
| Comparison with Poisson distribution Blue bars denote a histogram of data divided into 1 sec bins. Red curve is a Poisson curve with rate = median count rate of data. |
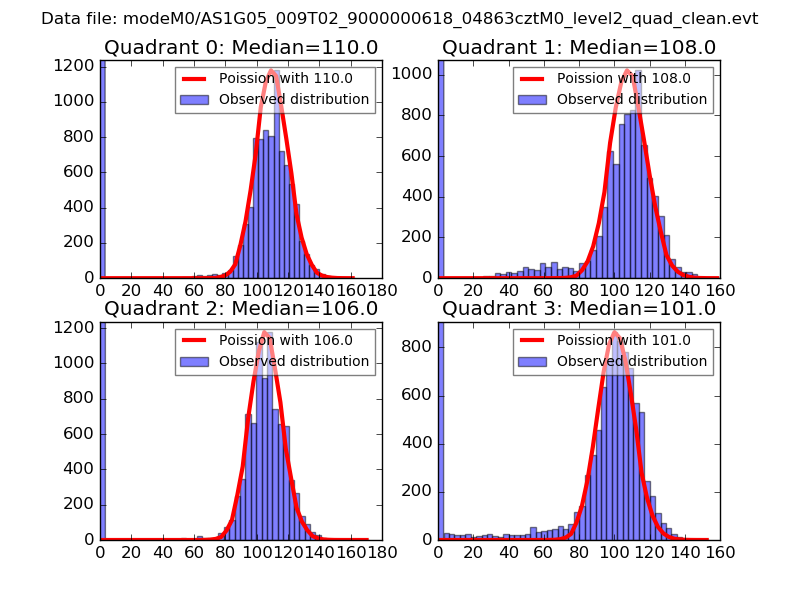 |
 |
| Quadrant-wise count rates Data is divided into 100 sec bins |
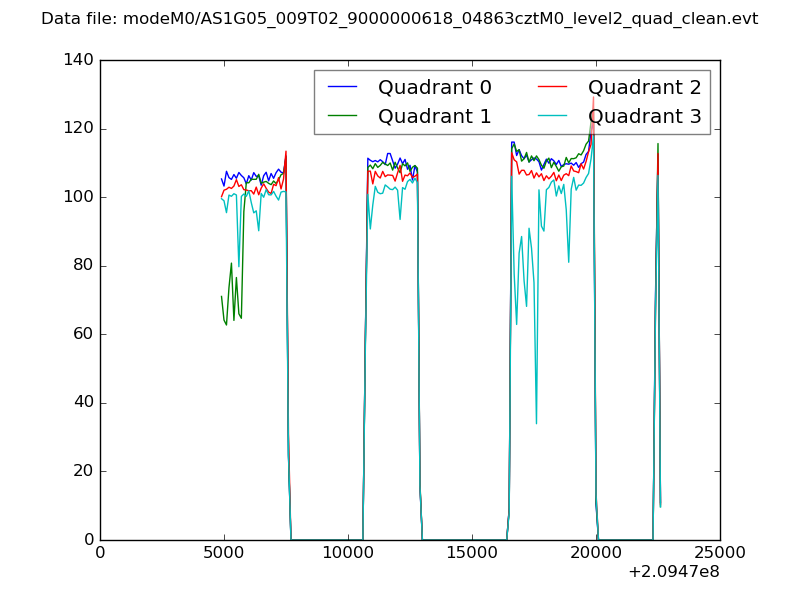 |
|
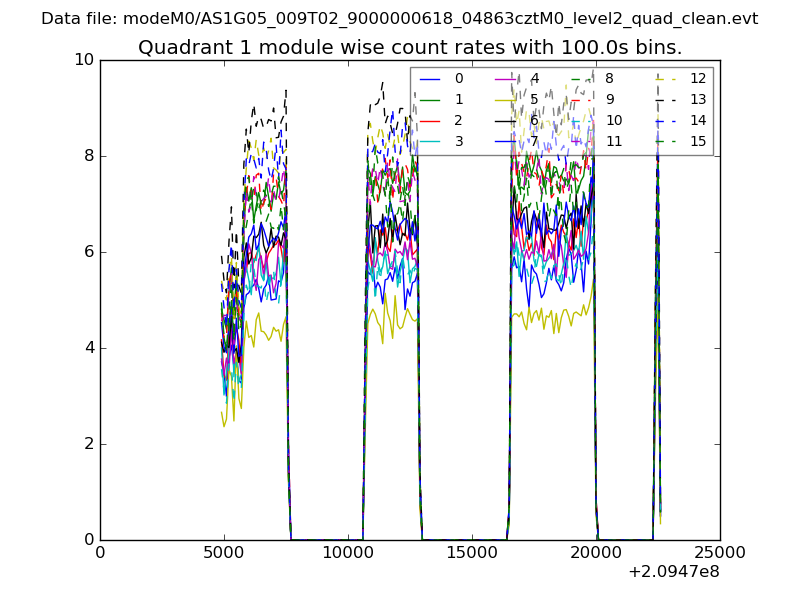
| Module-wise count rates for Quadrant A Data is divided into 100 sec bins |
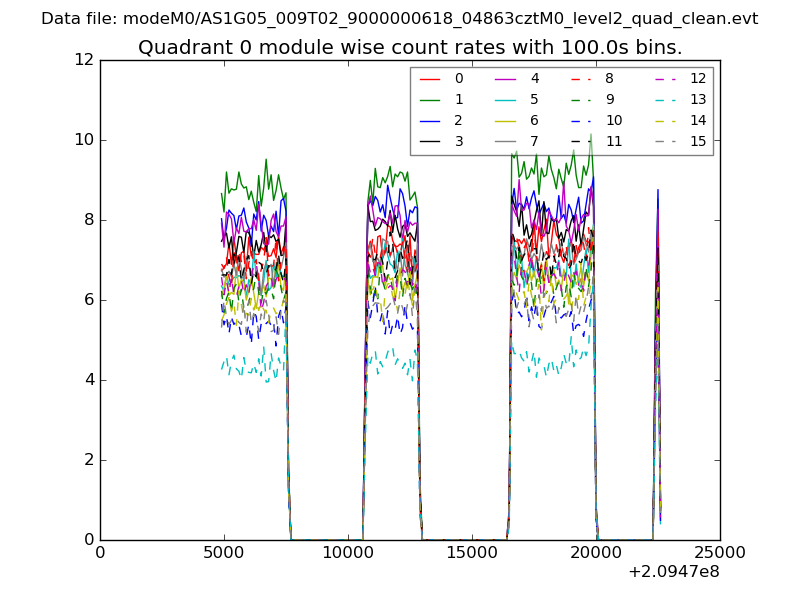 |
 |
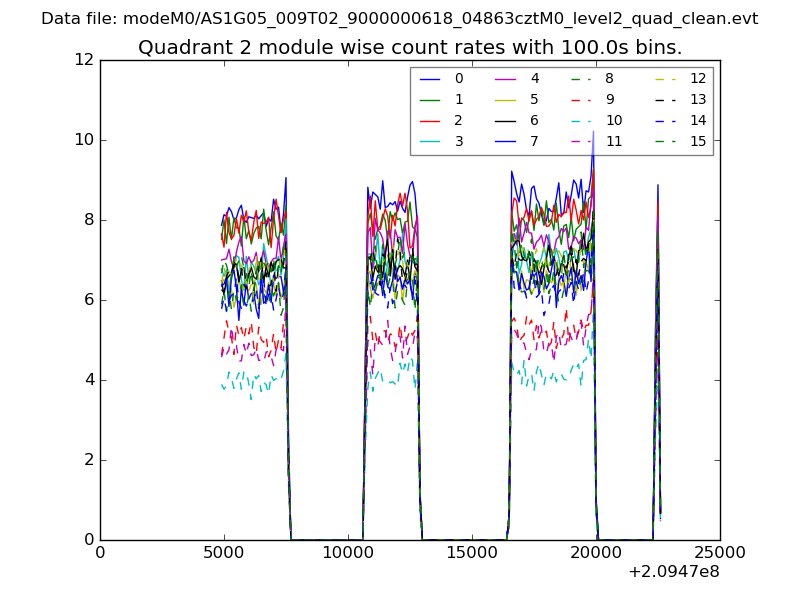
| Module-wise count rates for Quadrant B Data is divided into 100 sec bins |
 |
 |
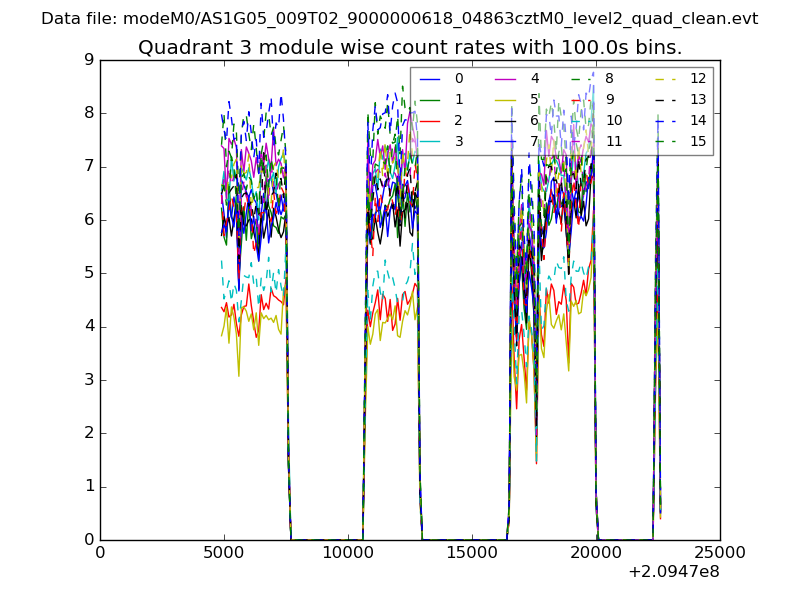
| Module-wise count rates for Quadrant C Data is divided into 100 sec bins |
 |
 |
| Module-wise count rates for Quadrant D Data is divided into 100 sec bins |
 |
 |
| Parameter | Plot |
|---|---|
| CZT HV Monitor | 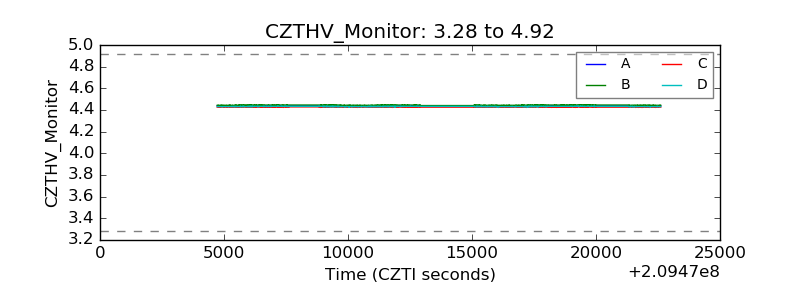 |
| D_VDD | 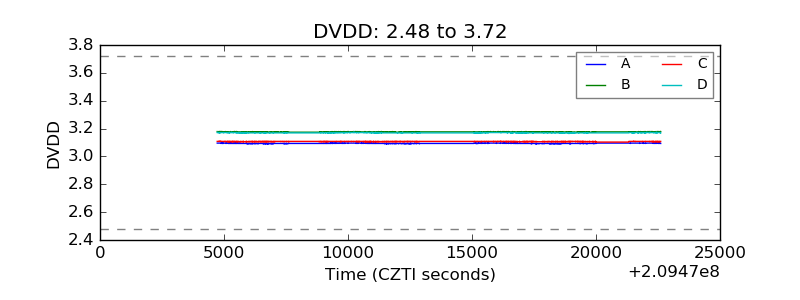 |
| Temperature 1 | 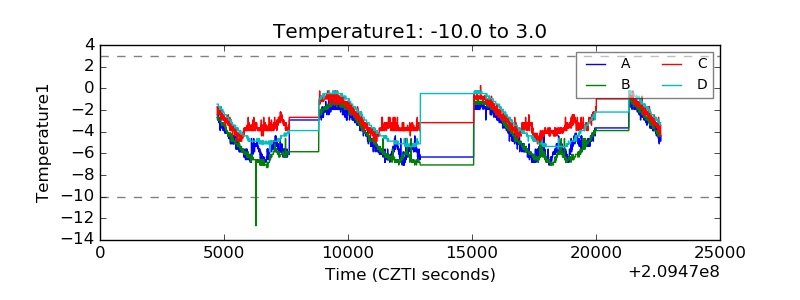 |
| Veto HV Monitor | 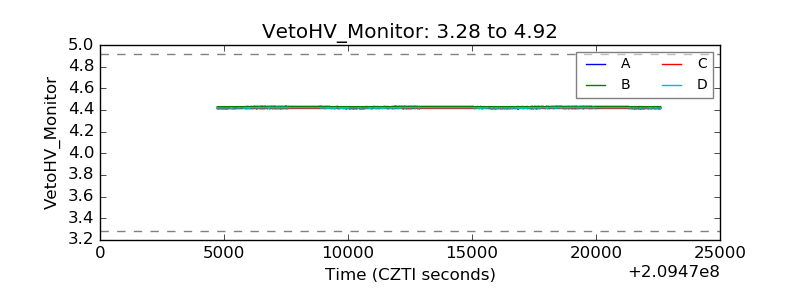 |
| Veto LLD | 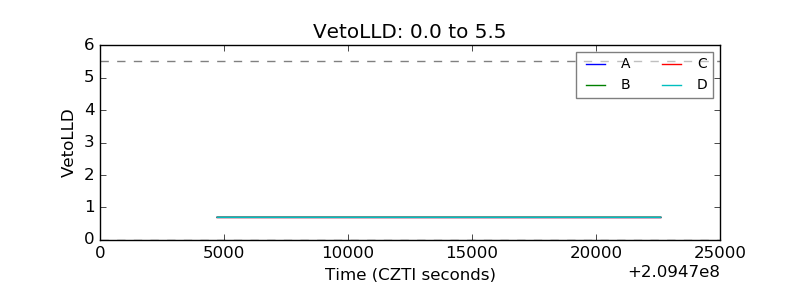 |
| Alpha Counter | 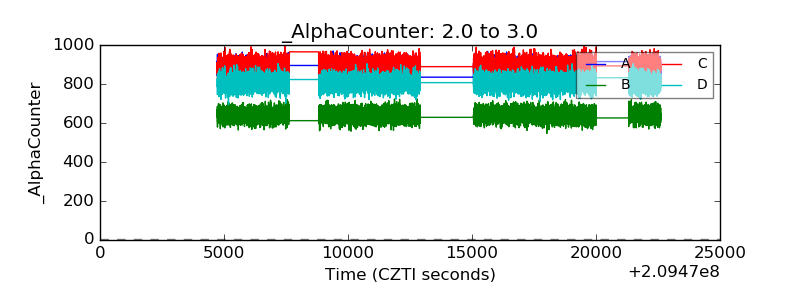 |
| _CPM_Rate | 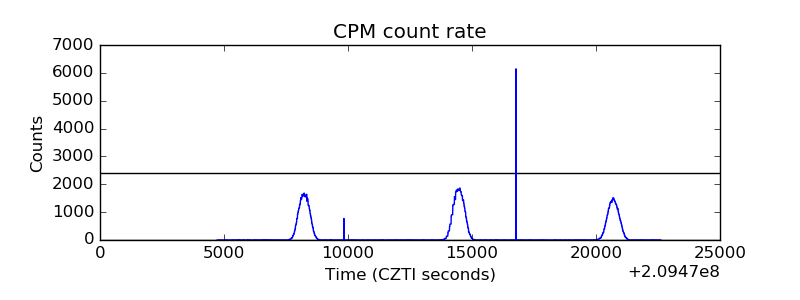 |
| CZT Counter | 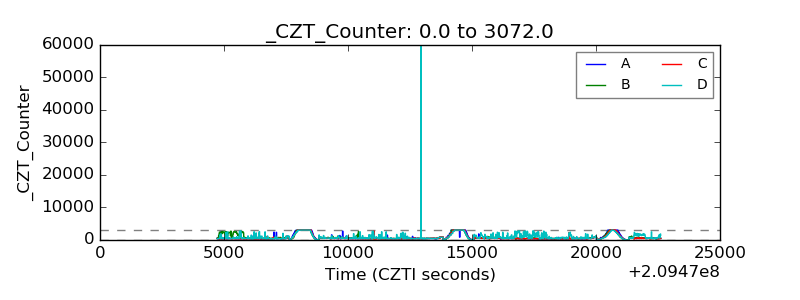 |
| +2.5 Volts monitor | 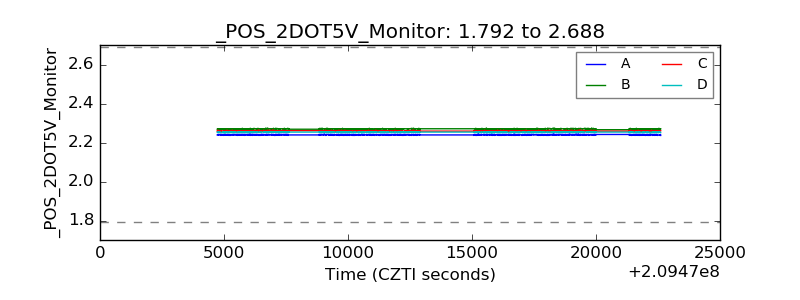 |
| +5 Volts monitor |  |
| _ROLL_ROT | 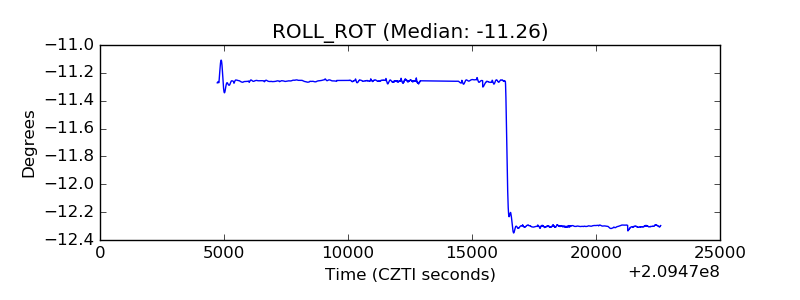 |
| _Roll_DEC | 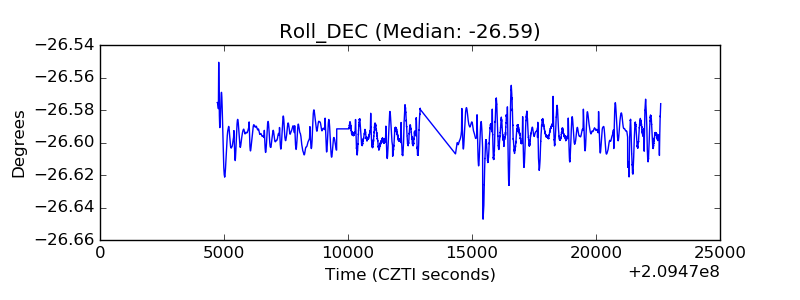 |
| _Roll_RA | 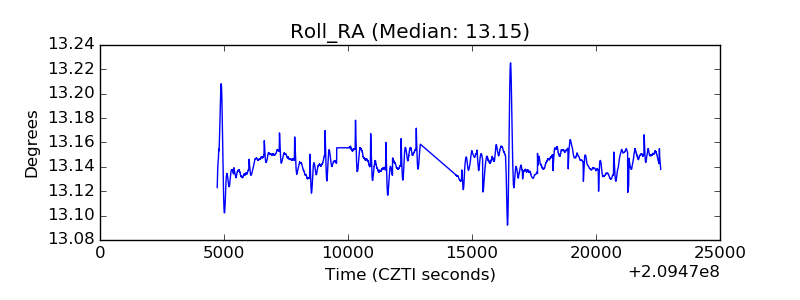 |
| Veto Counter | 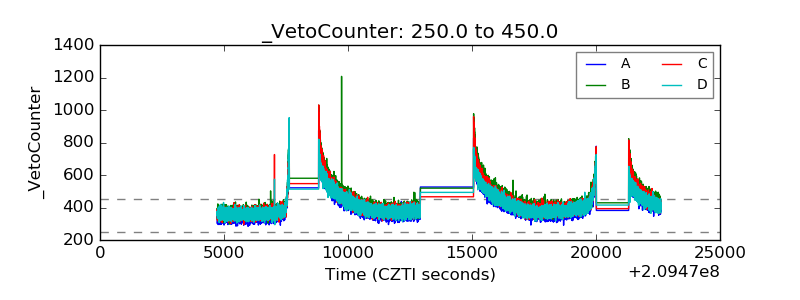 |