| Param | Original file | Final file |
|---|---|---|
| Filename | modeM0/AS1G05_009T02_9000000618_04864cztM0_level2.evt | modeM0/AS1G05_009T02_9000000618_04864cztM0_level2_quad_clean.evt |
| Size (bytes) | 574,145,280 | 74,594,880 |
| Size | 547.5 MB | 71.1 MB |
| Events in quadrant A | 3,172,321 | 469,575 |
| Events in quadrant B | 3,658,945 | 468,411 |
| Events in quadrant C | 2,982,091 | 459,589 |
| Events in quadrant D | 7,144,617 | 418,512 |
| Mode SS | |||
|---|---|---|---|
| Quadrant | BADHDUFLAG | Total packets | Discarded packets |
| A | 0 | 134 | 0 |
| B | 0 | 134 | 0 |
| C | 0 | 134 | 0 |
| D | 0 | 134 | 0 |
| Mode M0 | |||
|---|---|---|---|
| Quadrant | BADHDUFLAG | Total packets | Discarded packets |
| A | 0 | 13619 | 3 |
| B | 0 | 14951 | 2 |
| C | 0 | 13190 | 2 |
| D | 0 | 25645 | 9 |
| Mode M9 | |||
|---|---|---|---|
| Quadrant | BADHDUFLAG | Total packets | Discarded packets |
| A | 0 | 25 | 0 |
| B | 0 | 25 | 0 |
| C | 0 | 25 | 0 |
| D | 0 | 25 | 0 |
| Quadrant | Total seconds | Saturated seconds | Saturation percentage |
|---|---|---|---|
| A | 6328 | 162 | 2.560051% |
| B | 6328 | 198 | 3.128951% |
| C | 6328 | 50 | 0.790139% |
| D | 6327 | 1542 | 24.371740% |
Noise dominated data is calculated using 1-second bins in cleaned event files. If a bin has >2000 counts, and if more than 50% of those come from <1% of pixels, then it is considered to be noise-dominated and hence unusable.
| Quadrant | # 1 sec bins | Bins with >0 counts | Bins with >2000 counts | High rate bins dominated by noise | Noise dominated (total time) | Noise dominated (detector-on time) | Marked lightcurve |
|---|---|---|---|---|---|---|---|
| A | 8928 | 6329 | 12 | 12 | 0.13% | 0.19% | 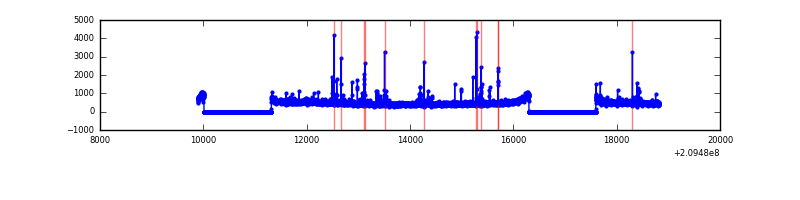 |
| B | 8928 | 6329 | 28 | 28 | 0.31% | 0.44% | 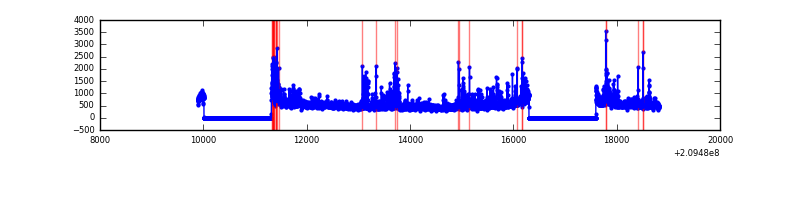 |
| C | 8928 | 6330 | 0 | 0 | 0.00% | 0.00% | 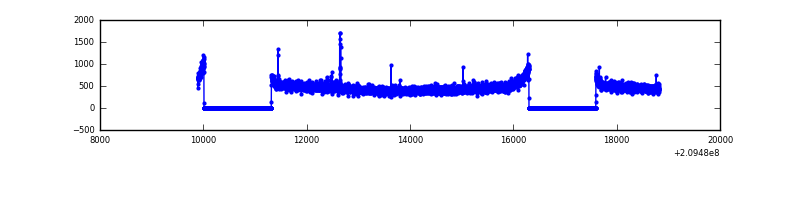 |
| D | 8928 | 6329 | 1213 | 1213 | 13.59% | 19.17% | 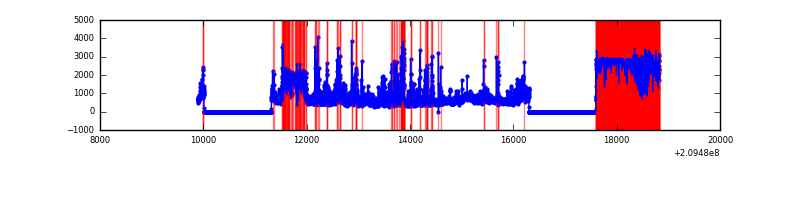 |
Top three noisy pixels from each quadrant. If the there are fewer than three noisy pixels in the level2.evt file, extra rows are filled as -1
| Pixel properties | Quadrant properties | ||||||
|---|---|---|---|---|---|---|---|
| Quadrant | DetID | PixID | Counts | Sigma | Mean | Median | Sigma |
| A | 13 | 251 | 94725 | 591.6 | 778 | 762 | 158.8 |
| A | 0 | 50 | 35934 | 221.44 | 778 | 762 | 158.8 |
| A | 8 | 15 | 31635 | 194.38 | 778 | 762 | 158.8 |
| B | 10 | 16 | 222672 | 1481.85 | 786 | 769 | 149.7 |
| B | 4 | 239 | 131842 | 875.29 | 786 | 769 | 149.7 |
| B | 4 | 80 | 98300 | 651.3 | 786 | 769 | 149.7 |
| C | 12 | 4 | 14305 | 77.48 | 753 | 759 | 174.8 |
| C | 1 | 16 | 13352 | 72.03 | 753 | 759 | 174.8 |
| C | 13 | 61 | 6199 | 31.12 | 753 | 759 | 174.8 |
| D | 10 | 15 | 2337579 | 14597.45 | 656 | 638 | 160.1 |
| D | 1 | 31 | 631964 | 3943.51 | 656 | 638 | 160.1 |
| D | 2 | 63 | 552456 | 3446.87 | 656 | 638 | 160.1 |
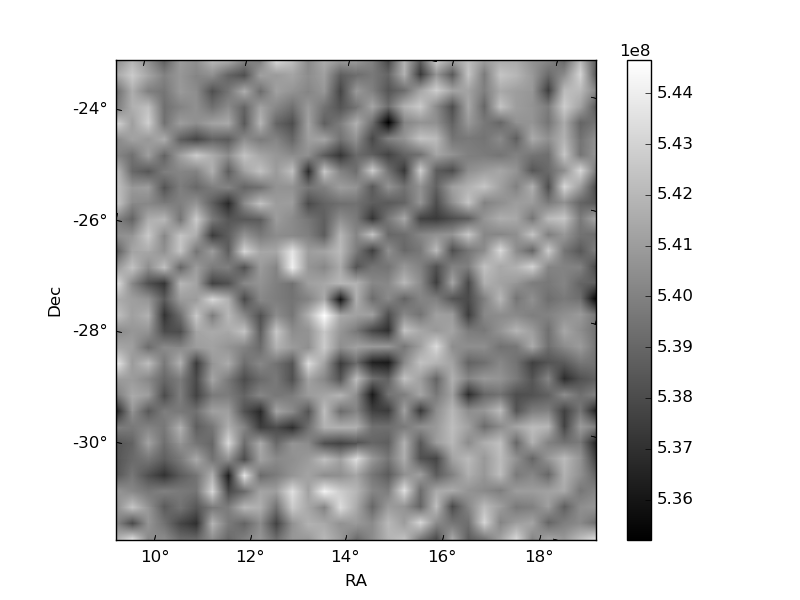
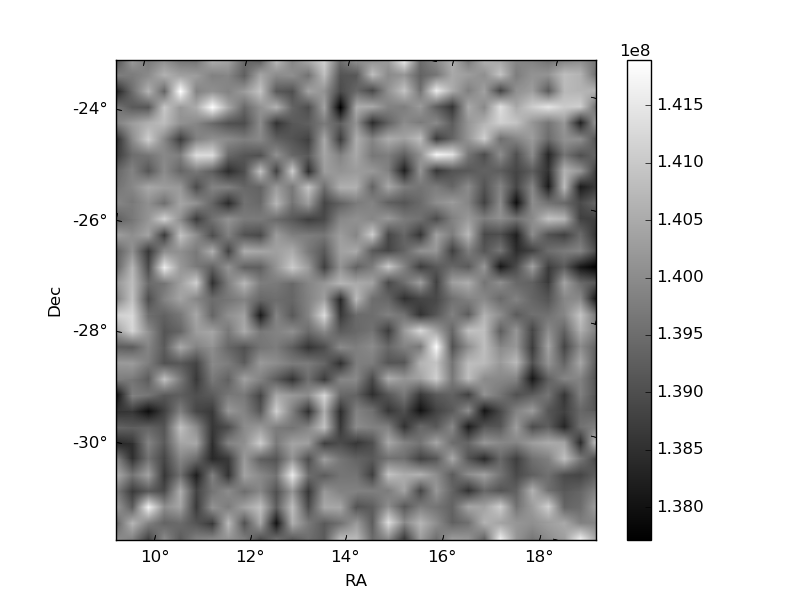
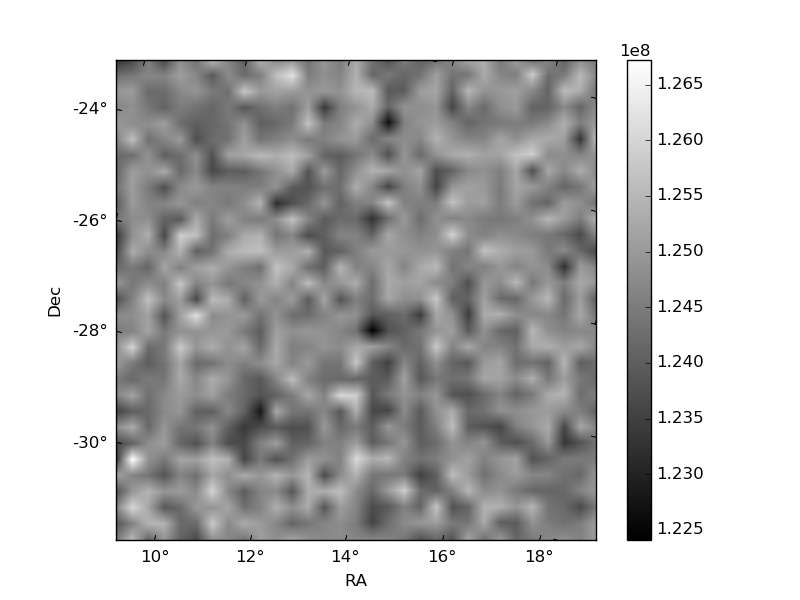
Histogram calculated using DETX and DETY for each event in the final _common_clean file
| Quadrant A | 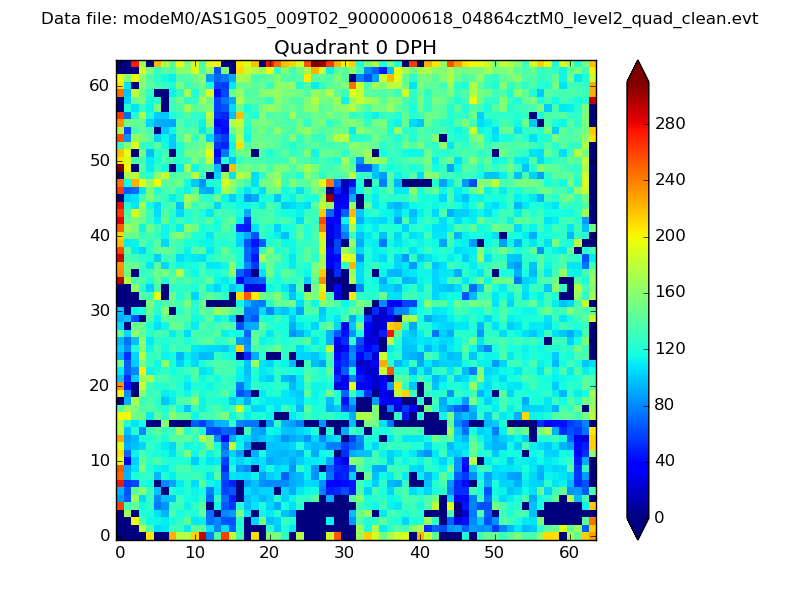 |
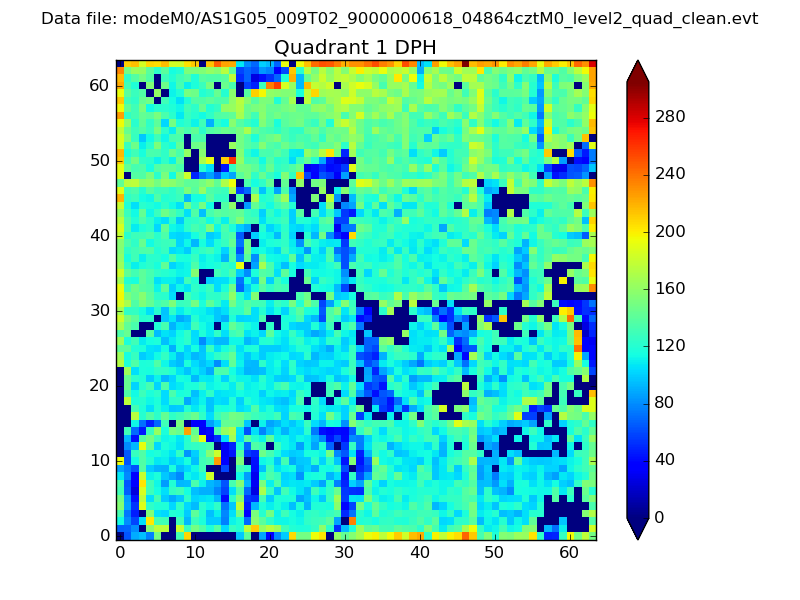 |
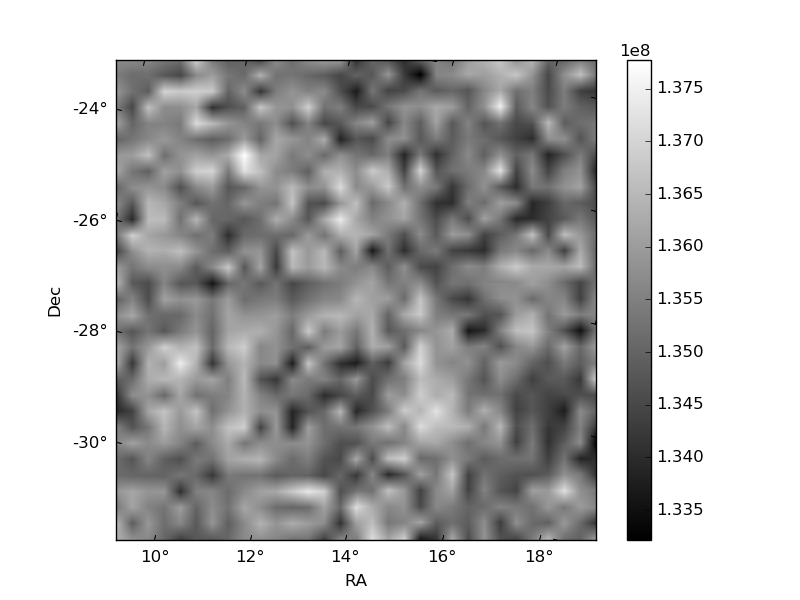
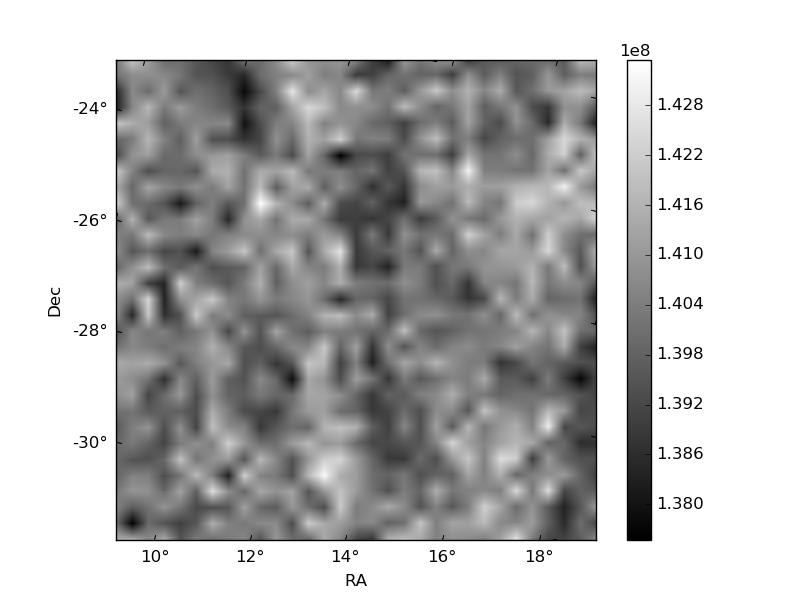
Quadrant B |
|---|---|---|---|
| Quadrant D | 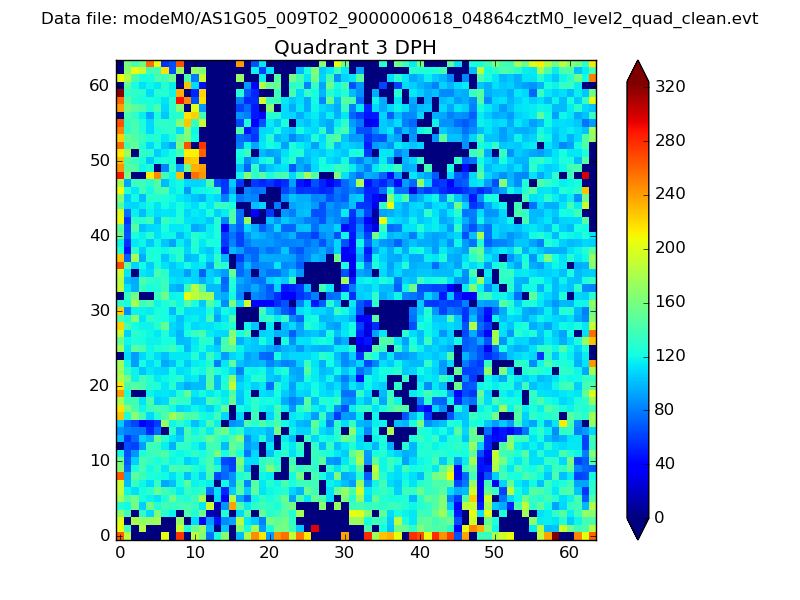 |
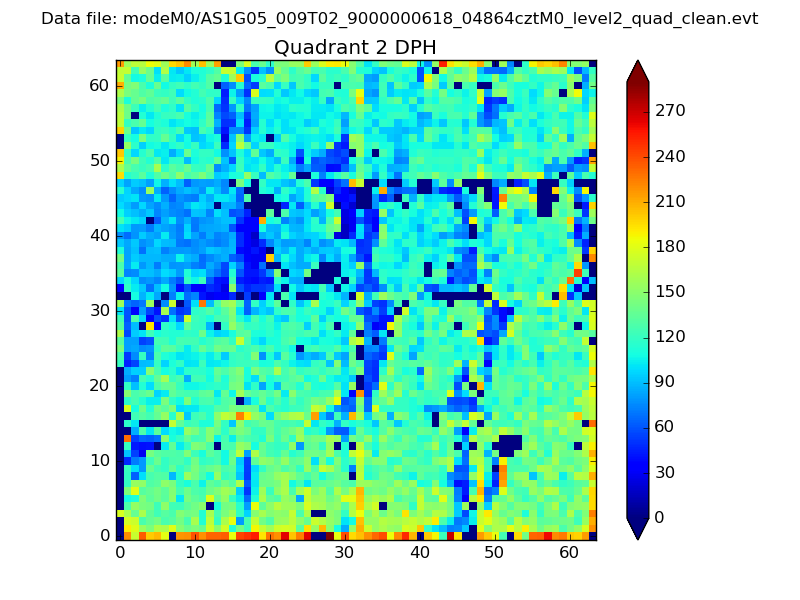 |
Quadrant C |
| Plot type | Count rate plots | Images |
|---|---|---|
| Comparison with Poisson distribution Blue bars denote a histogram of data divided into 1 sec bins. Red curve is a Poisson curve with rate = median count rate of data. |
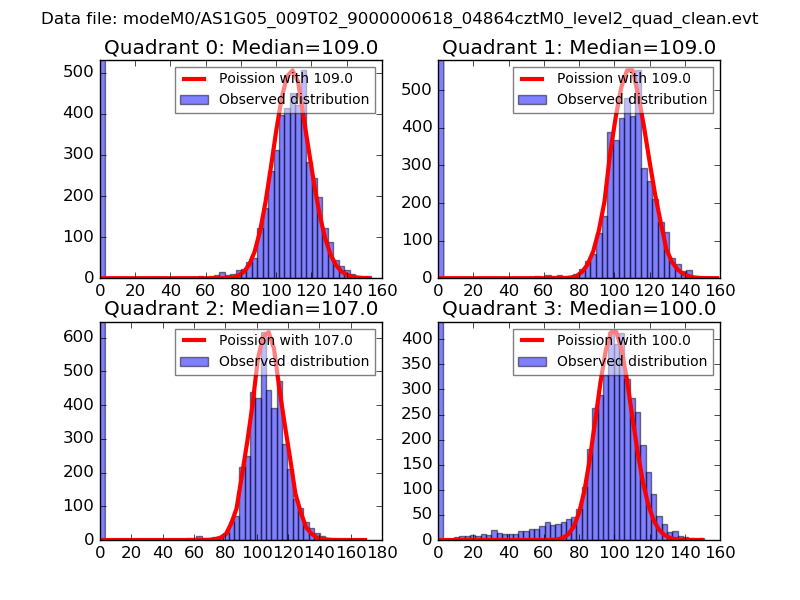 |
 |
| Quadrant-wise count rates Data is divided into 100 sec bins |
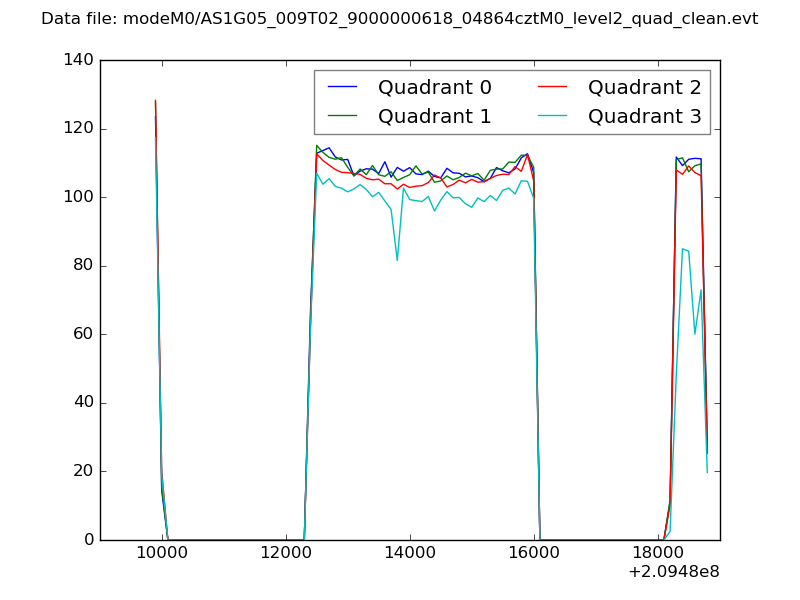 |
|
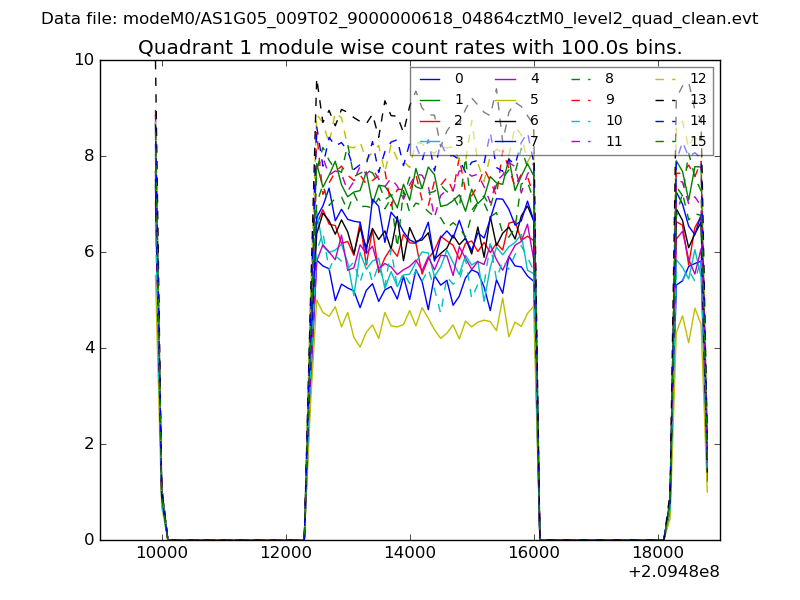
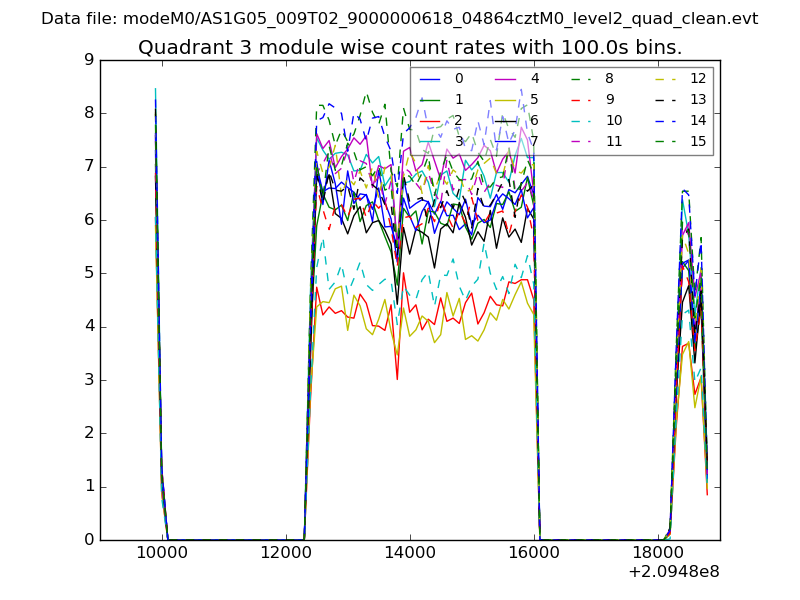
| Module-wise count rates for Quadrant A Data is divided into 100 sec bins |
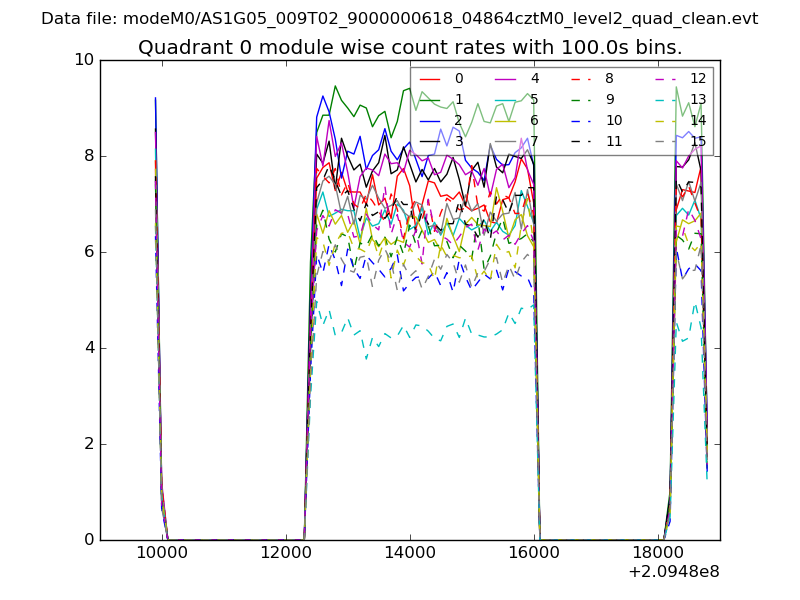 |
 |
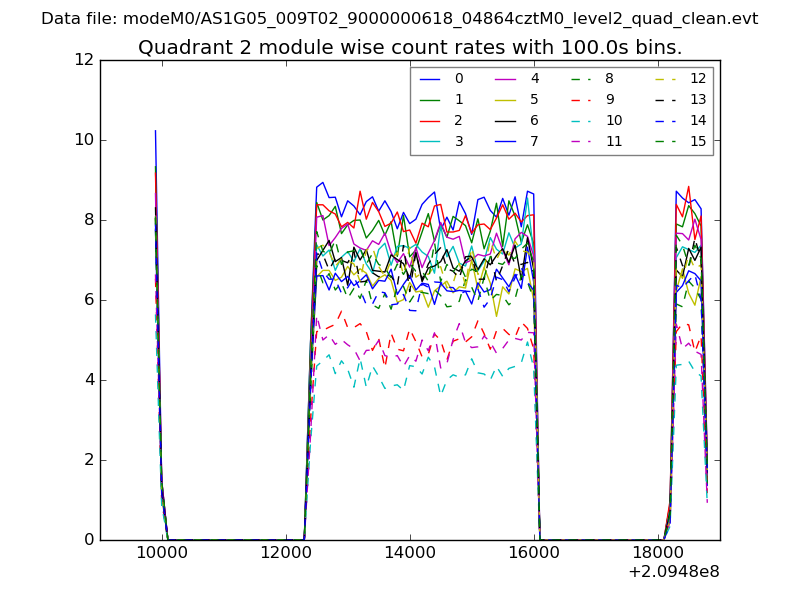
| Module-wise count rates for Quadrant B Data is divided into 100 sec bins |
 |
 |
| Module-wise count rates for Quadrant C Data is divided into 100 sec bins |
 |
 |
| Module-wise count rates for Quadrant D Data is divided into 100 sec bins |
 |
 |
| Parameter | Plot |
|---|---|
| CZT HV Monitor | 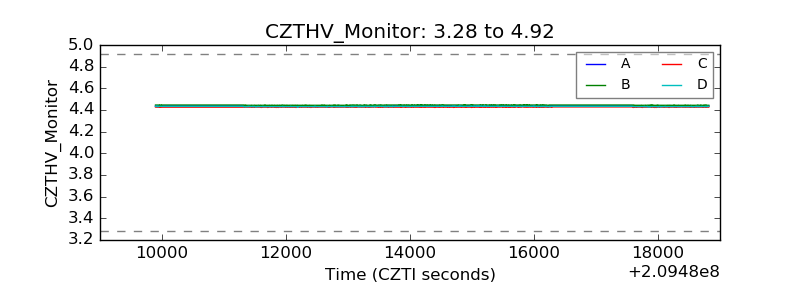 |
| D_VDD | 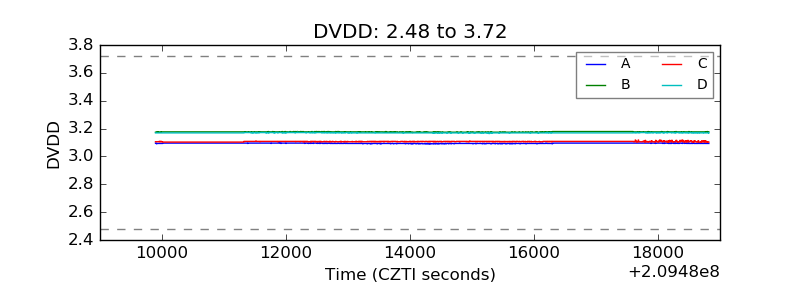 |
| Temperature 1 | 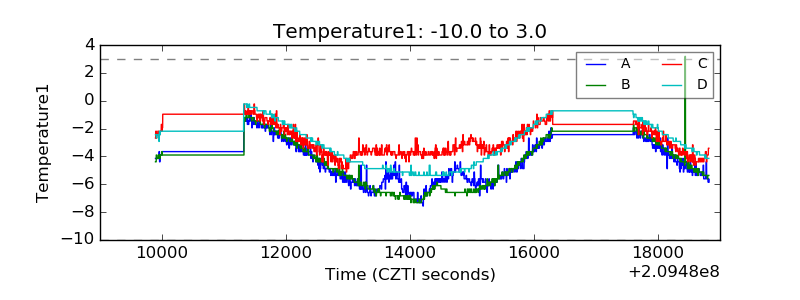 |
| Veto HV Monitor | 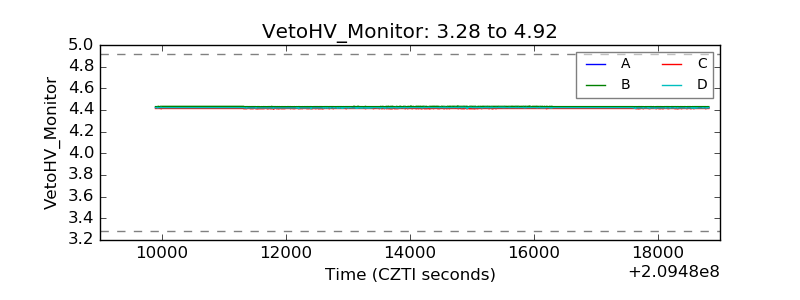 |
| Veto LLD | 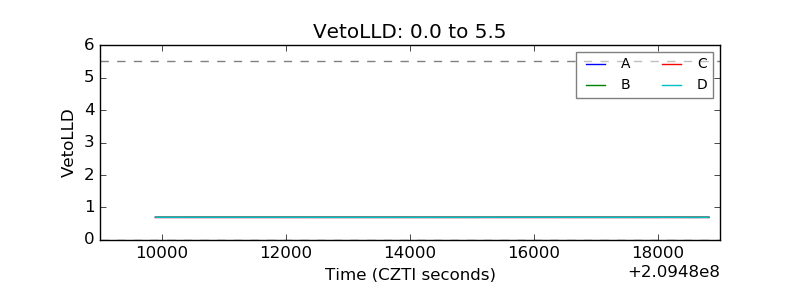 |
| Alpha Counter | 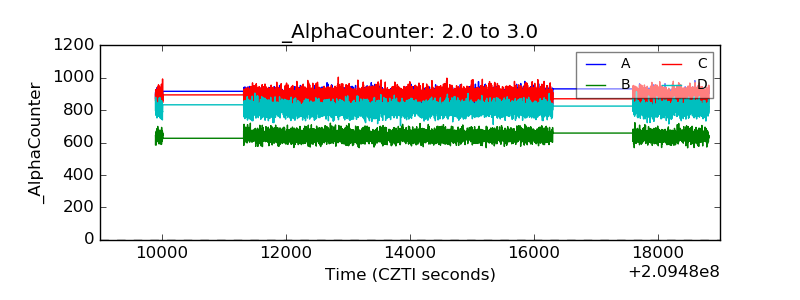 |
| _CPM_Rate | 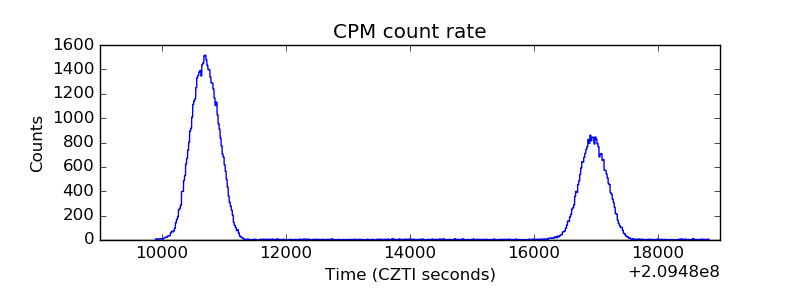 |
| CZT Counter | 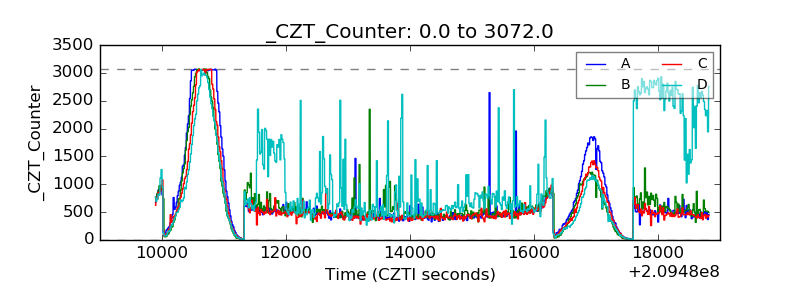 |
| +2.5 Volts monitor |  |
| +5 Volts monitor |  |
| _ROLL_ROT | 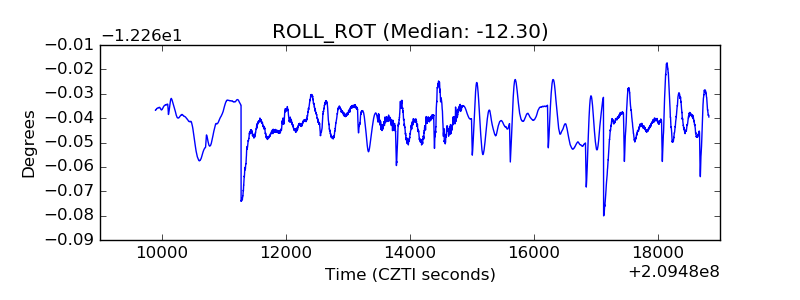 |
| _Roll_DEC | 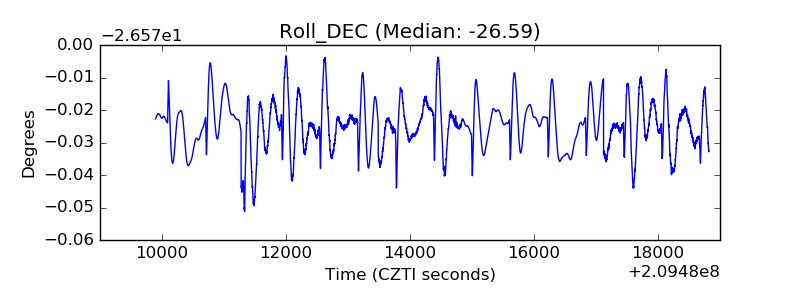 |
| _Roll_RA | 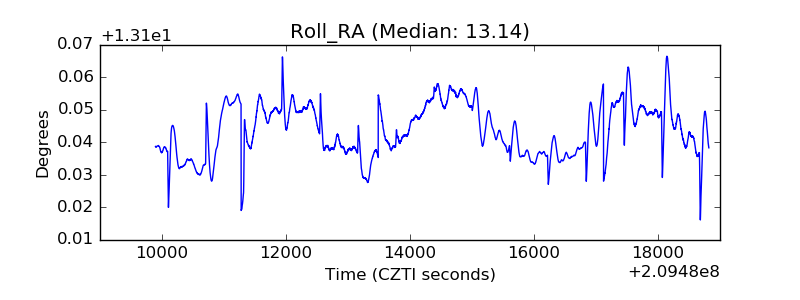 |
| Veto Counter | 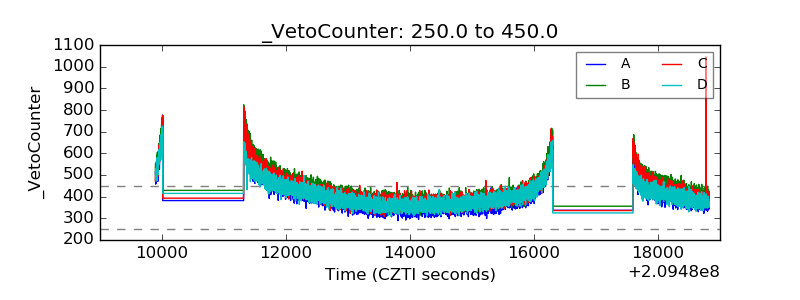 |