| Param | Original file | Final file |
|---|---|---|
| Filename | modeM0/AS1G05_009T02_9000000618_04865cztM0_level2.evt | modeM0/AS1G05_009T02_9000000618_04865cztM0_level2_quad_clean.evt |
| Size (bytes) | 542,335,680 | 76,956,480 |
| Size | 517.2 MB | 73.4 MB |
| Events in quadrant A | 3,217,820 | 482,760 |
| Events in quadrant B | 3,280,890 | 484,730 |
| Events in quadrant C | 2,906,431 | 475,841 |
| Events in quadrant D | 6,579,640 | 434,511 |
| Mode SS | |||
|---|---|---|---|
| Quadrant | BADHDUFLAG | Total packets | Discarded packets |
| A | 0 | 134 | 0 |
| B | 0 | 134 | 0 |
| C | 0 | 134 | 0 |
| D | 0 | 134 | 0 |
| Mode M0 | |||
|---|---|---|---|
| Quadrant | BADHDUFLAG | Total packets | Discarded packets |
| A | 0 | 14001 | 3 |
| B | 0 | 14098 | 2 |
| C | 0 | 13208 | 2 |
| D | 0 | 24002 | 2 |
| Mode M9 | |||
|---|---|---|---|
| Quadrant | BADHDUFLAG | Total packets | Discarded packets |
| A | 0 | 11 | 0 |
| B | 0 | 11 | 0 |
| C | 0 | 11 | 0 |
| D | 0 | 12 | 0 |
| Quadrant | Total seconds | Saturated seconds | Saturation percentage |
|---|---|---|---|
| A | 6475 | 61 | 0.942085% |
| B | 6475 | 61 | 0.942085% |
| C | 6475 | 11 | 0.169884% |
| D | 6475 | 1140 | 17.606178% |
Noise dominated data is calculated using 1-second bins in cleaned event files. If a bin has >2000 counts, and if more than 50% of those come from <1% of pixels, then it is considered to be noise-dominated and hence unusable.
| Quadrant | # 1 sec bins | Bins with >0 counts | Bins with >2000 counts | High rate bins dominated by noise | Noise dominated (total time) | Noise dominated (detector-on time) | Marked lightcurve |
|---|---|---|---|---|---|---|---|
| A | 7535 | 6476 | 35 | 35 | 0.46% | 0.54% | 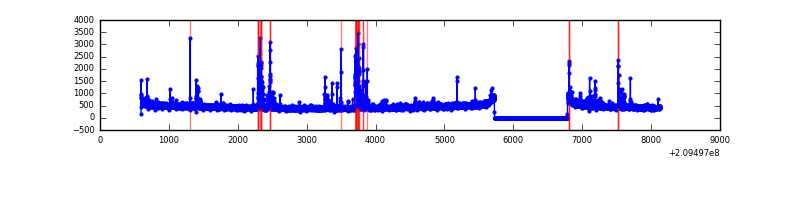 |
| B | 7535 | 6476 | 11 | 11 | 0.15% | 0.17% | 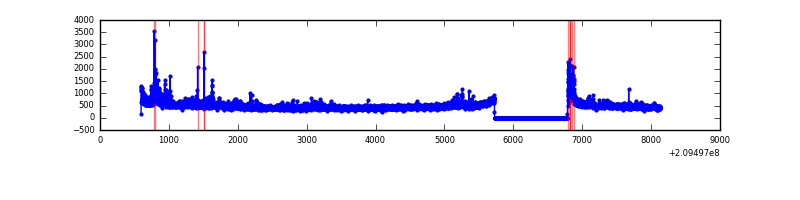 |
| C | 7535 | 6476 | 0 | 0 | 0.00% | 0.00% | 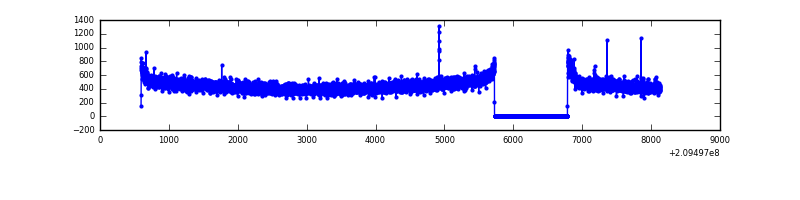 |
| D | 7535 | 6476 | 1132 | 1132 | 15.02% | 17.48% | 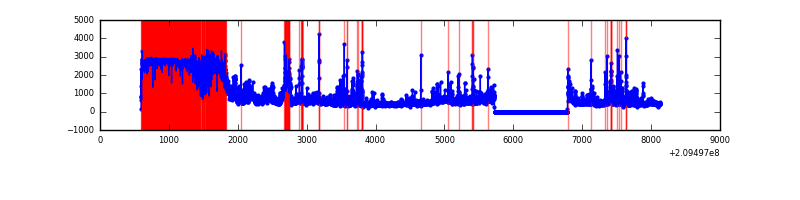 |
Top three noisy pixels from each quadrant. If the there are fewer than three noisy pixels in the level2.evt file, extra rows are filled as -1
| Pixel properties | Quadrant properties | ||||||
|---|---|---|---|---|---|---|---|
| Quadrant | DetID | PixID | Counts | Sigma | Mean | Median | Sigma |
| A | 0 | 50 | 201414 | 1313.17 | 750 | 734 | 152.8 |
| A | 13 | 251 | 63908 | 413.38 | 750 | 734 | 152.8 |
| A | 8 | 15 | 27437 | 174.73 | 750 | 734 | 152.8 |
| B | 4 | 80 | 86811 | 582.44 | 763 | 744 | 147.8 |
| B | 7 | 252 | 65098 | 435.5 | 763 | 744 | 147.8 |
| B | 10 | 16 | 60148 | 402.0 | 763 | 744 | 147.8 |
| C | 8 | 128 | 15726 | 87.95 | 731 | 737 | 170.4 |
| C | 1 | 16 | 9161 | 49.43 | 731 | 737 | 170.4 |
| C | 8 | 112 | 7666 | 40.66 | 731 | 737 | 170.4 |
| D | 10 | 15 | 2542246 | 16003.91 | 644 | 624 | 158.8 |
| D | 13 | 53 | 559115 | 3516.67 | 644 | 624 | 158.8 |
| D | 2 | 136 | 285774 | 1795.51 | 644 | 624 | 158.8 |
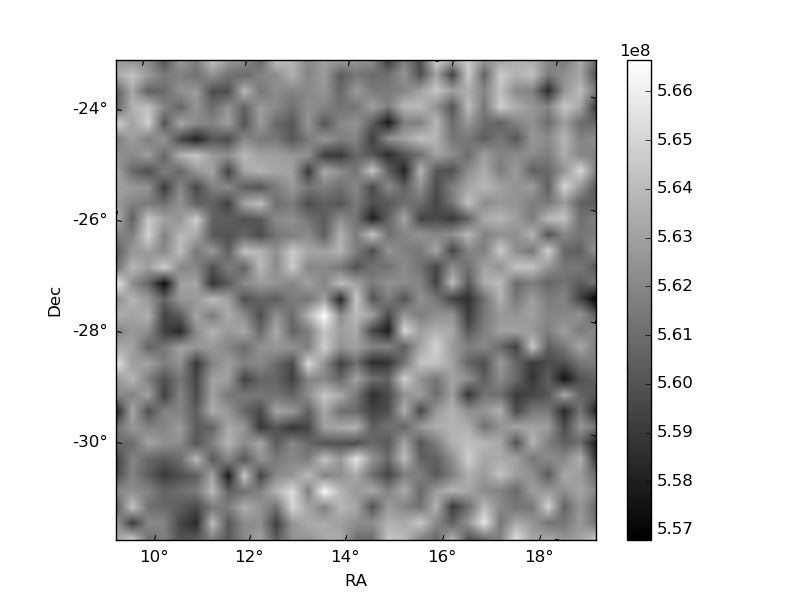
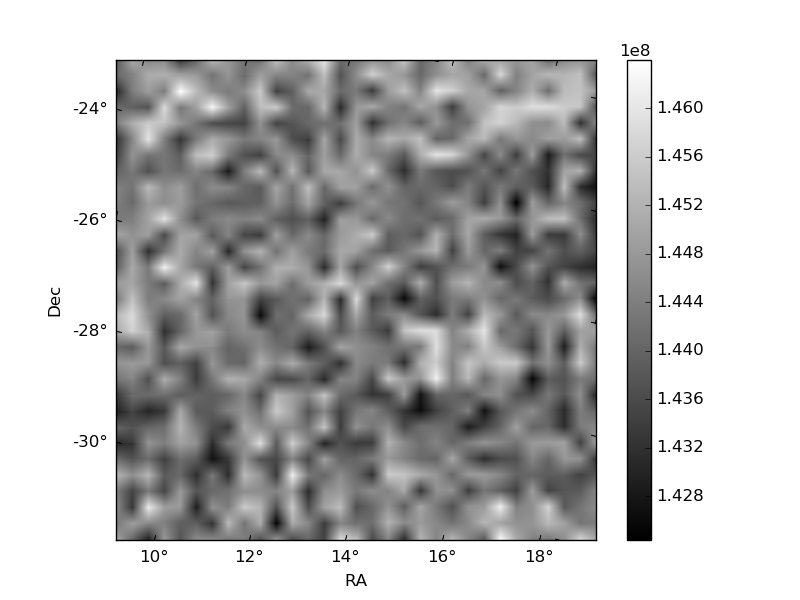
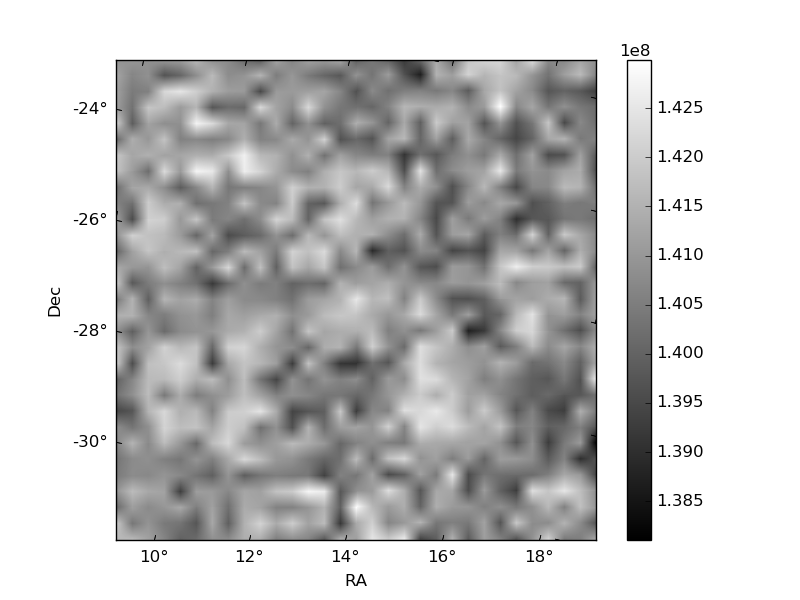
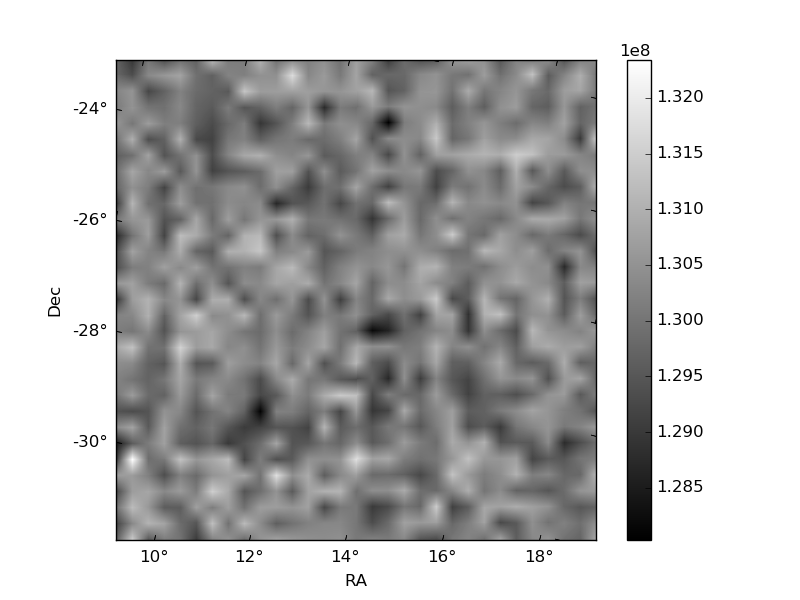
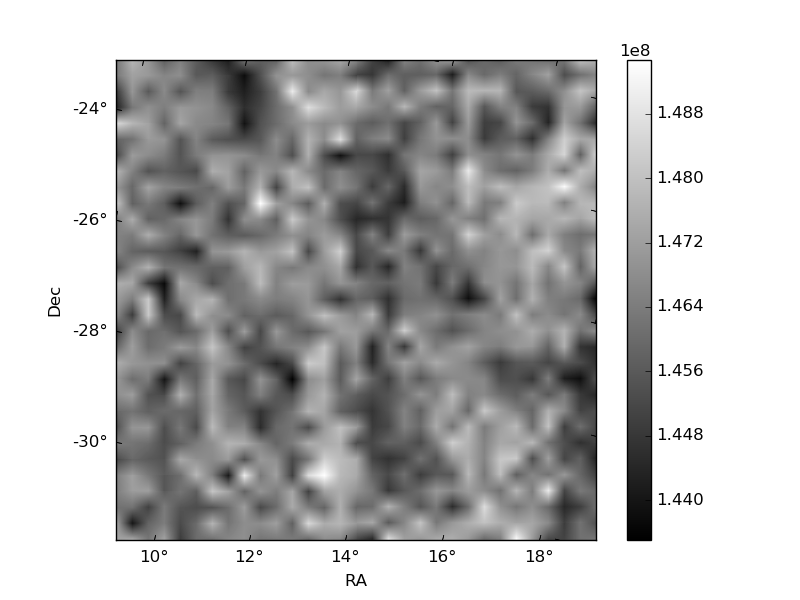
Histogram calculated using DETX and DETY for each event in the final _common_clean file
| Quadrant A | 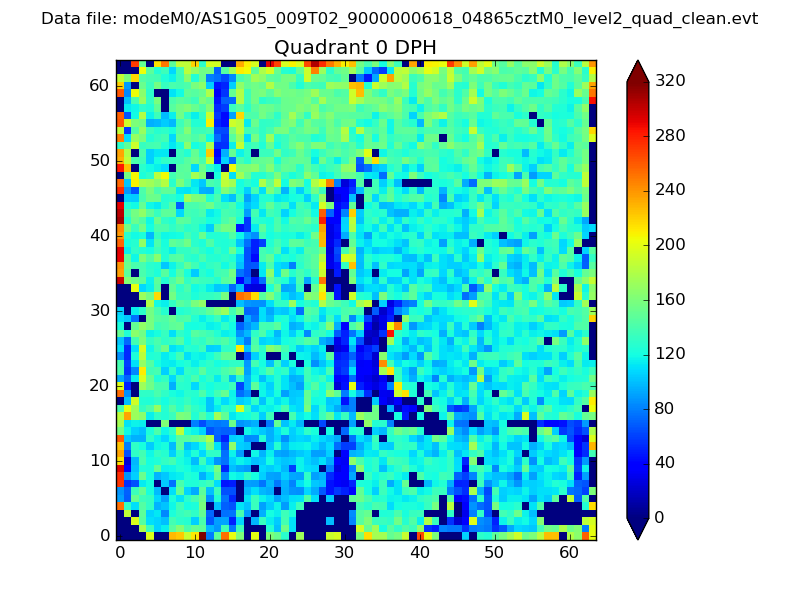 |
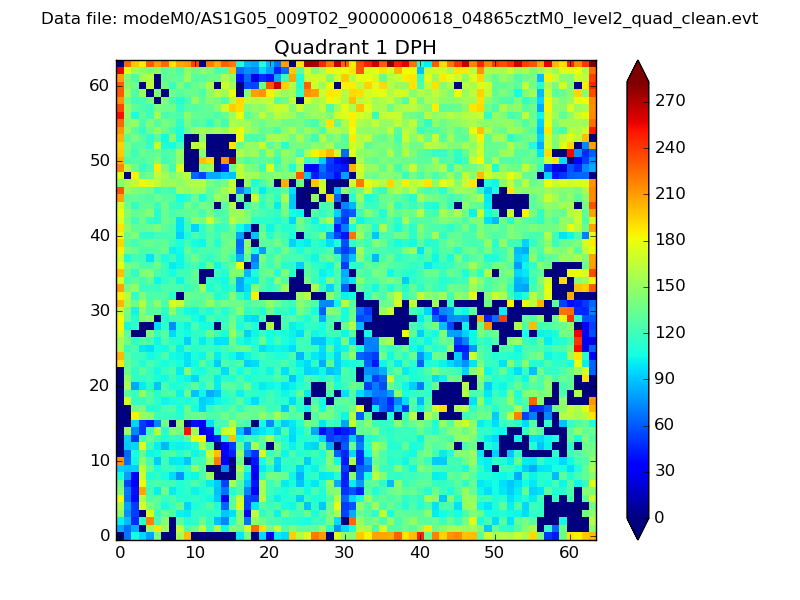 |
Quadrant B |
|---|---|---|---|
| Quadrant D | 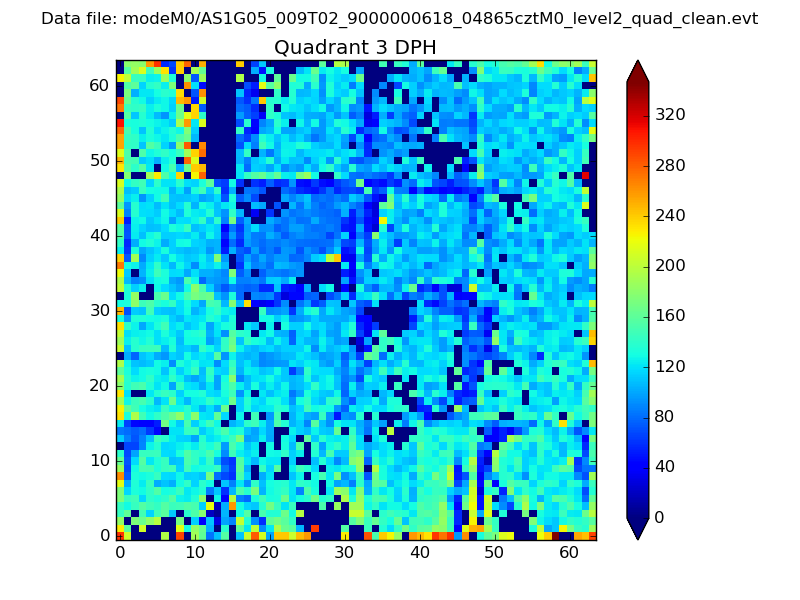 |
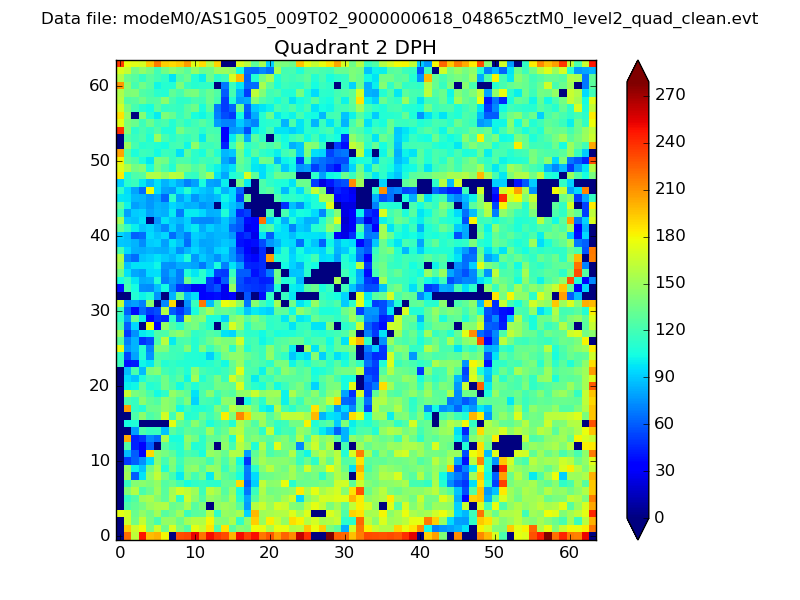 |
Quadrant C |
| Plot type | Count rate plots | Images |
|---|---|---|
| Comparison with Poisson distribution Blue bars denote a histogram of data divided into 1 sec bins. Red curve is a Poisson curve with rate = median count rate of data. |
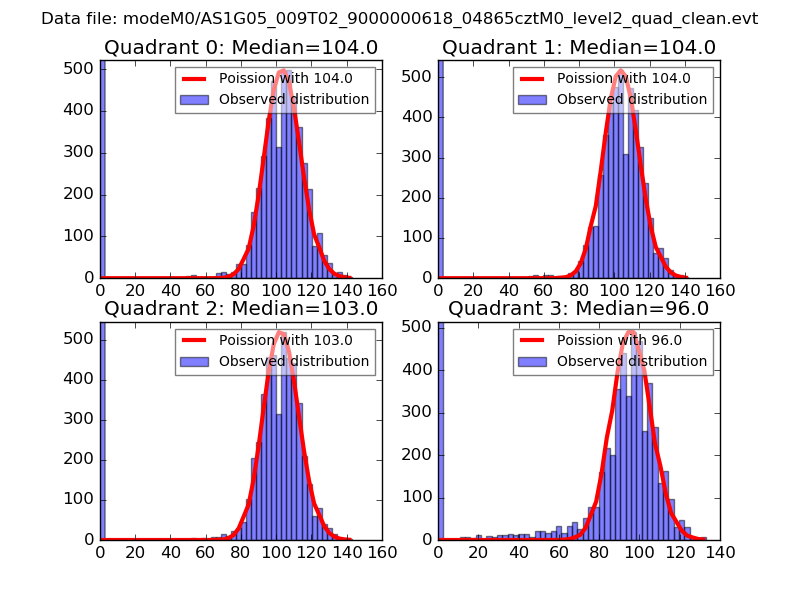 |
 |
| Quadrant-wise count rates Data is divided into 100 sec bins |
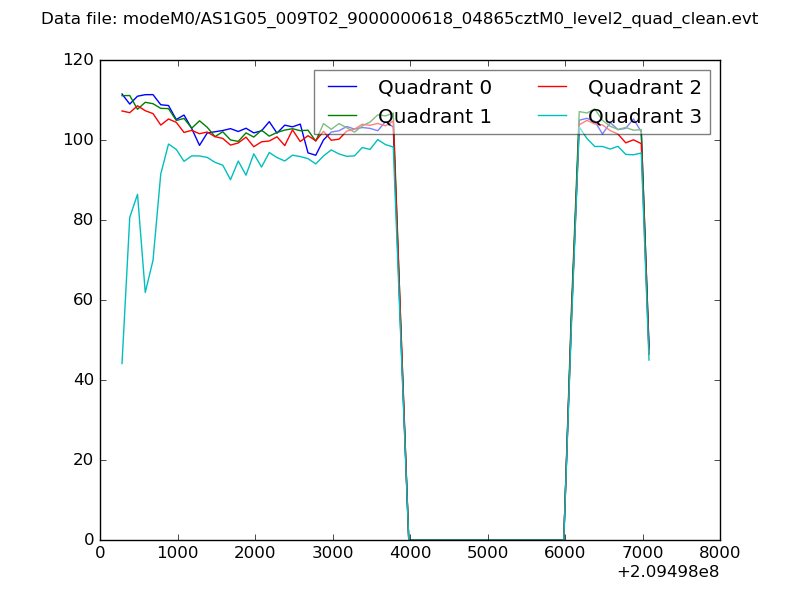 |
|
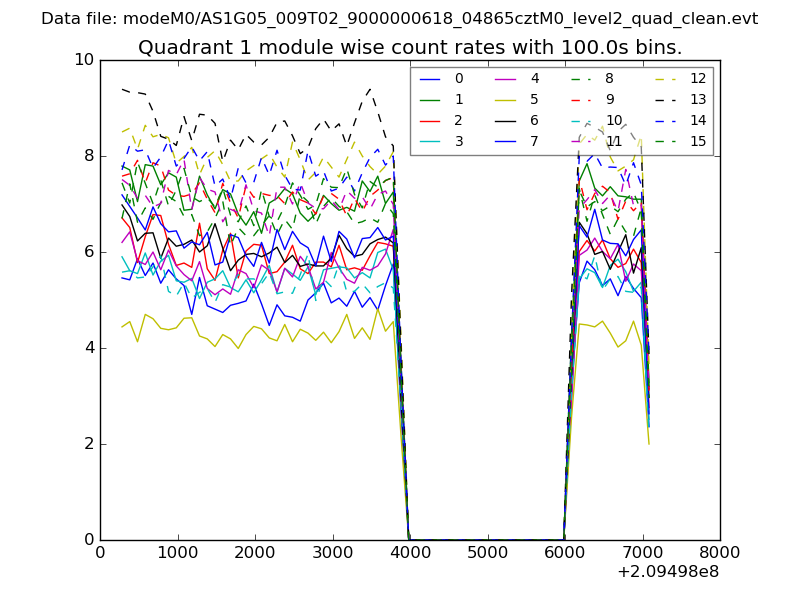
| Module-wise count rates for Quadrant A Data is divided into 100 sec bins |
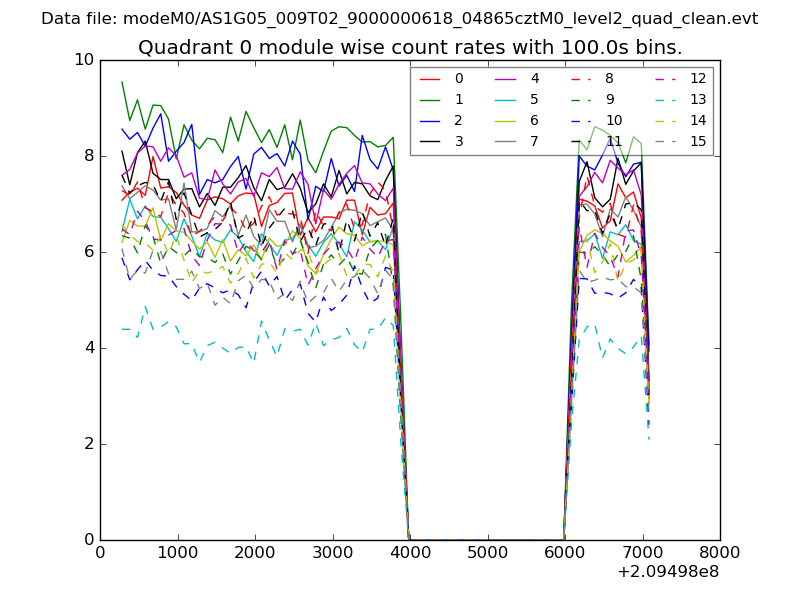 |
 |
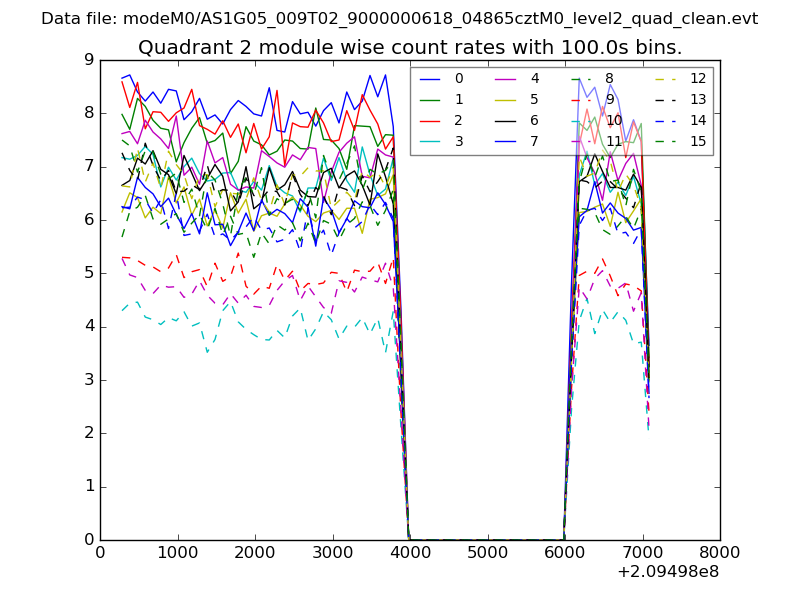
| Module-wise count rates for Quadrant B Data is divided into 100 sec bins |
 |
 |
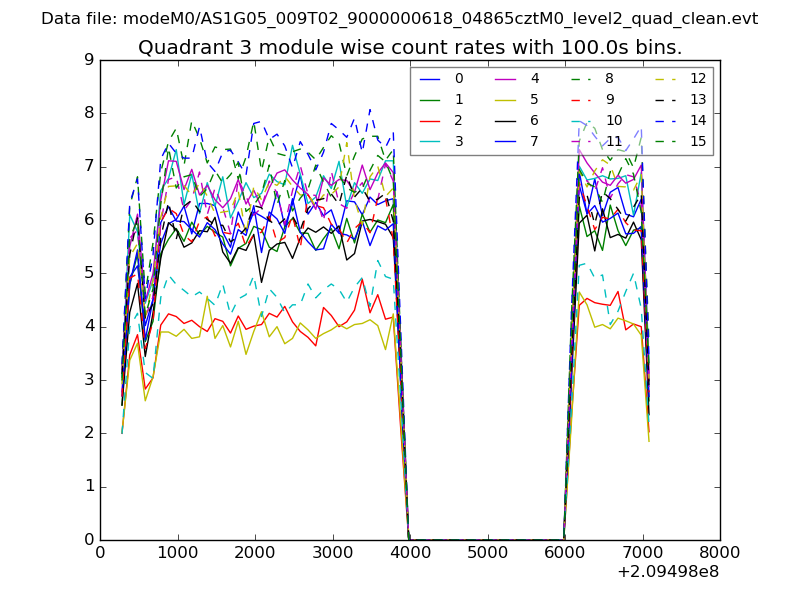
| Module-wise count rates for Quadrant C Data is divided into 100 sec bins |
 |
 |
| Module-wise count rates for Quadrant D Data is divided into 100 sec bins |
 |
 |
| Parameter | Plot |
|---|---|
| CZT HV Monitor | 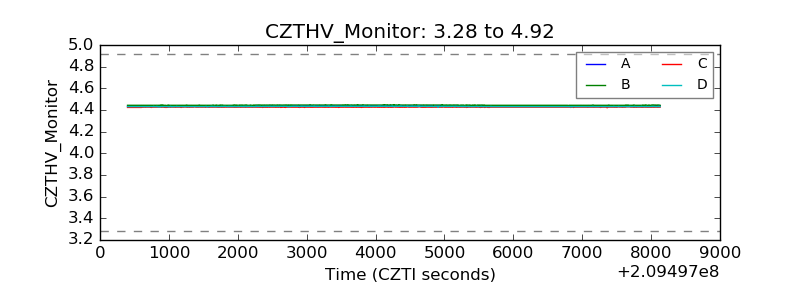 |
| D_VDD | 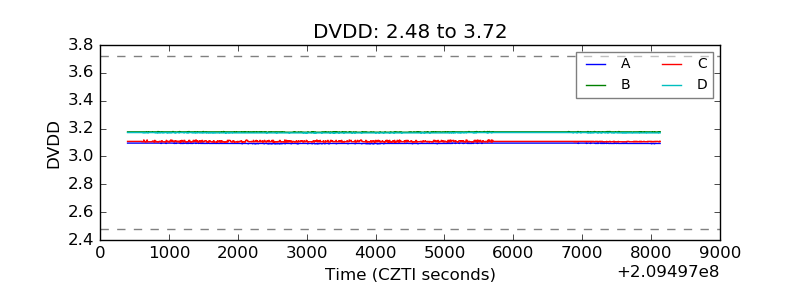 |
| Temperature 1 | 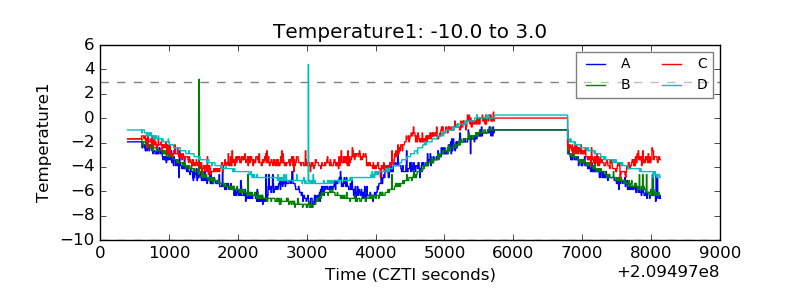 |
| Veto HV Monitor | 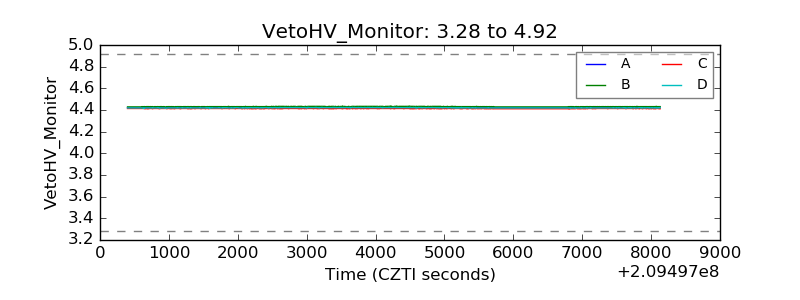 |
| Veto LLD | 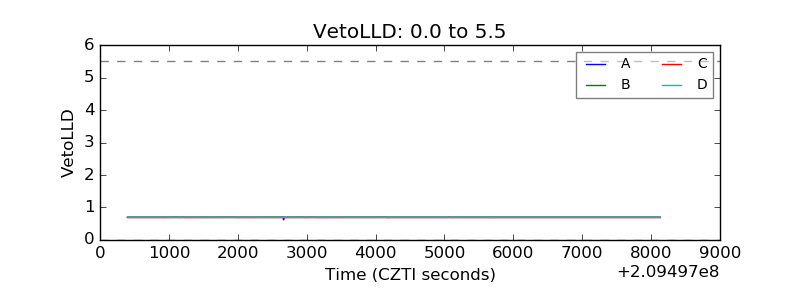 |
| Alpha Counter | 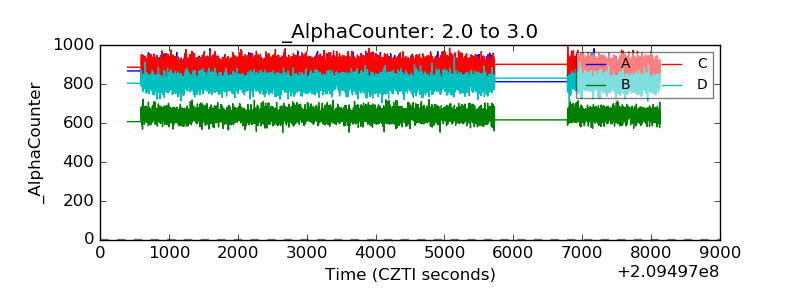 |
| _CPM_Rate | 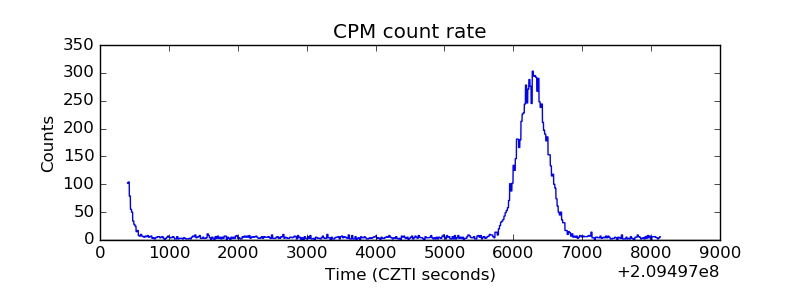 |
| CZT Counter | 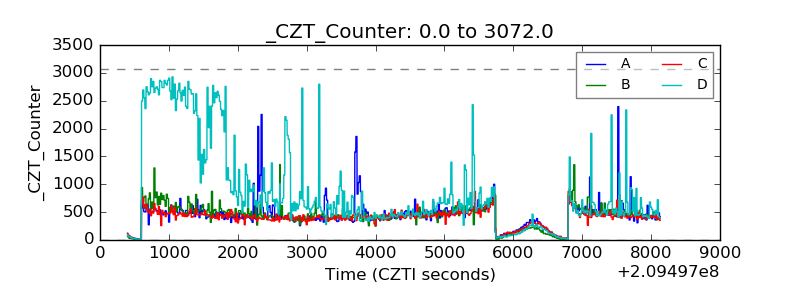 |
| +2.5 Volts monitor |  |
| +5 Volts monitor |  |
| _ROLL_ROT | 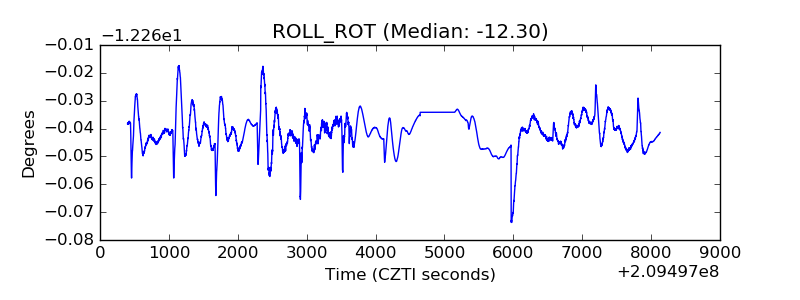 |
| _Roll_DEC | 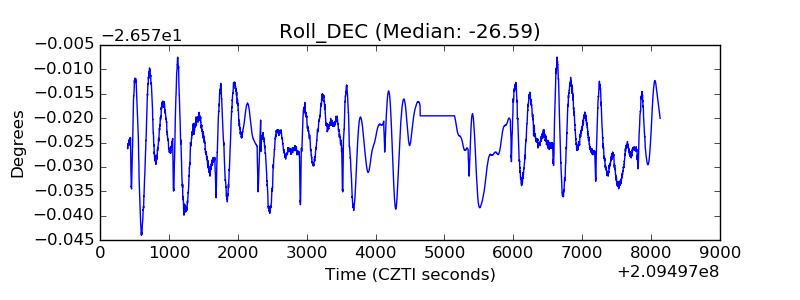 |
| _Roll_RA | 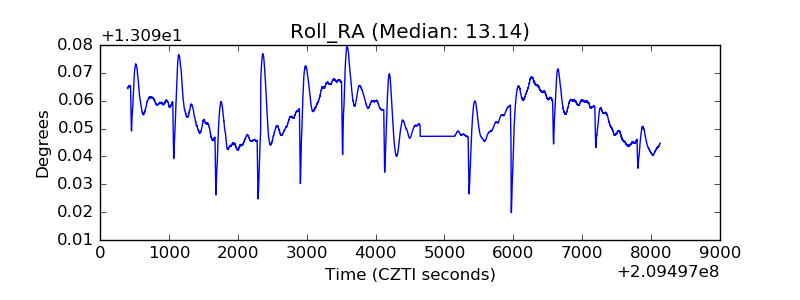 |
| Veto Counter | 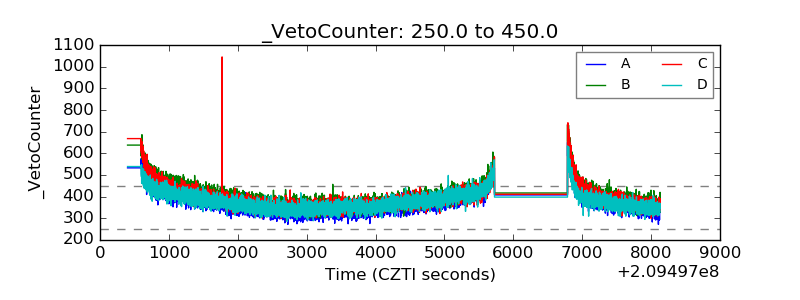 |