| Param | Original file | Final file |
|---|---|---|
| Filename | modeM0/AS1G05_009T02_9000000618_04866cztM0_level2.evt | modeM0/AS1G05_009T02_9000000618_04866cztM0_level2_quad_clean.evt |
| Size (bytes) | 528,039,360 | 93,286,080 |
| Size | 503.6 MB | 89.0 MB |
| Events in quadrant A | 3,801,746 | 580,461 |
| Events in quadrant B | 4,209,848 | 587,992 |
| Events in quadrant C | 3,401,520 | 577,809 |
| Events in quadrant D | 4,067,615 | 555,089 |
| Mode SS | |||
|---|---|---|---|
| Quadrant | BADHDUFLAG | Total packets | Discarded packets |
| A | 0 | 156 | 0 |
| B | 0 | 156 | 0 |
| C | 0 | 156 | 0 |
| D | 0 | 156 | 0 |
| Mode M0 | |||
|---|---|---|---|
| Quadrant | BADHDUFLAG | Total packets | Discarded packets |
| A | 0 | 16614 | 3 |
| B | 0 | 17725 | 2 |
| C | 0 | 15495 | 2 |
| D | 0 | 17575 | 2 |
| Mode M9 | |||
|---|---|---|---|
| Quadrant | BADHDUFLAG | Total packets | Discarded packets |
| A | 0 | 17 | 0 |
| B | 0 | 17 | 0 |
| C | 0 | 17 | 0 |
| D | 0 | 17 | 0 |
| Quadrant | Total seconds | Saturated seconds | Saturation percentage |
|---|---|---|---|
| A | 7521 | 115 | 1.529052% |
| B | 7521 | 226 | 3.004920% |
| C | 7521 | 21 | 0.279218% |
| D | 7521 | 125 | 1.662013% |
Noise dominated data is calculated using 1-second bins in cleaned event files. If a bin has >2000 counts, and if more than 50% of those come from <1% of pixels, then it is considered to be noise-dominated and hence unusable.
| Quadrant | # 1 sec bins | Bins with >0 counts | Bins with >2000 counts | High rate bins dominated by noise | Noise dominated (total time) | Noise dominated (detector-on time) | Marked lightcurve |
|---|---|---|---|---|---|---|---|
| A | 9296 | 7523 | 58 | 58 | 0.62% | 0.77% | 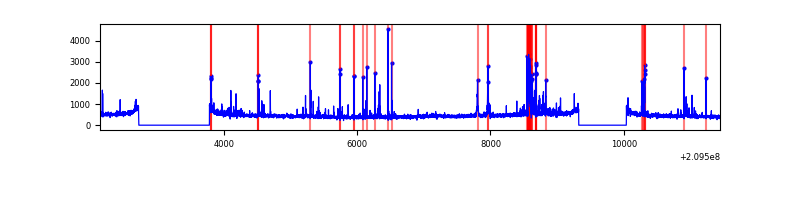 |
| B | 9296 | 7523 | 112 | 112 | 1.20% | 1.49% | 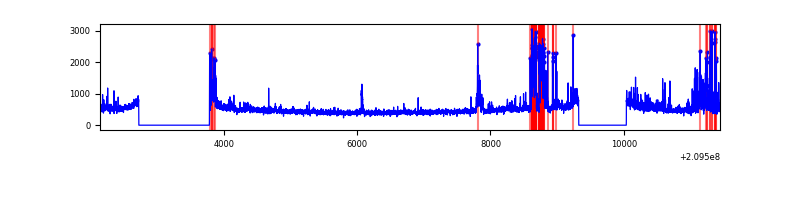 |
| C | 9296 | 7523 | 1 | 1 | 0.01% | 0.01% | 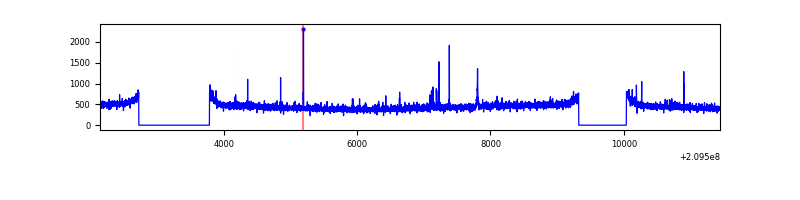 |
| D | 9296 | 7523 | 70 | 70 | 0.75% | 0.93% | 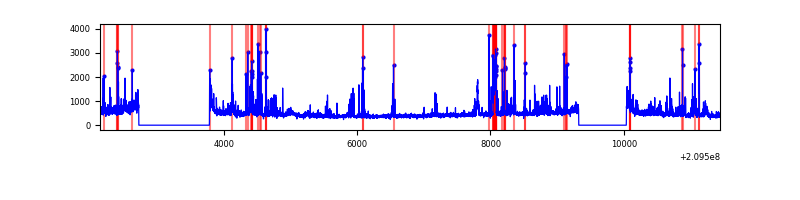 |
Top three noisy pixels from each quadrant. If the there are fewer than three noisy pixels in the level2.evt file, extra rows are filled as -1
| Pixel properties | Quadrant properties | ||||||
|---|---|---|---|---|---|---|---|
| Quadrant | DetID | PixID | Counts | Sigma | Mean | Median | Sigma |
| A | 13 | 251 | 300980 | 1677.34 | 877 | 857 | 178.9 |
| A | 0 | 50 | 65257 | 359.92 | 877 | 857 | 178.9 |
| A | 8 | 15 | 22897 | 123.18 | 877 | 857 | 178.9 |
| B | 10 | 16 | 525616 | 3089.23 | 883 | 861 | 169.9 |
| B | 4 | 80 | 74656 | 434.43 | 883 | 861 | 169.9 |
| B | 15 | 204 | 57310 | 332.32 | 883 | 861 | 169.9 |
| C | 1 | 16 | 34574 | 167.81 | 856 | 861 | 200.9 |
| C | 9 | 247 | 10469 | 47.82 | 856 | 861 | 200.9 |
| C | 8 | 128 | 7099 | 31.05 | 856 | 861 | 200.9 |
| D | 2 | 136 | 383419 | 1805.64 | 852 | 825 | 211.9 |
| D | 13 | 235 | 134208 | 629.5 | 852 | 825 | 211.9 |
| D | 10 | 231 | 94212 | 440.74 | 852 | 825 | 211.9 |
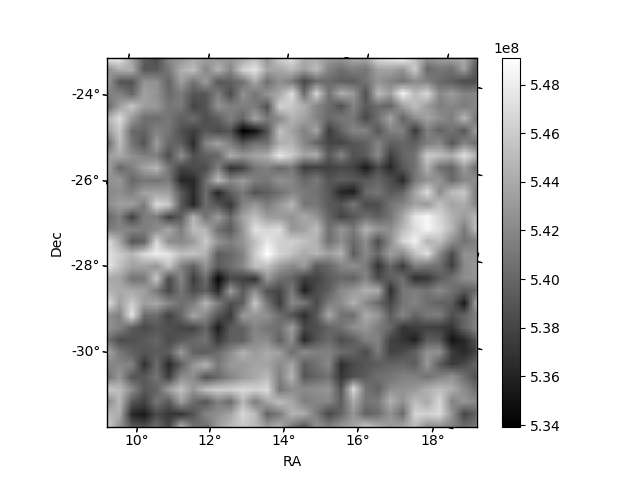
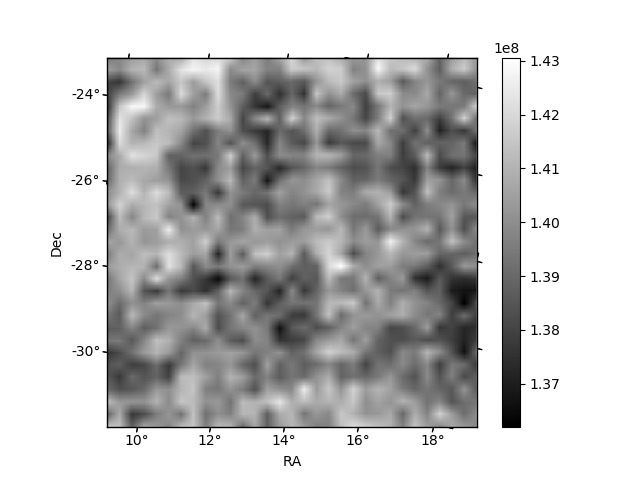
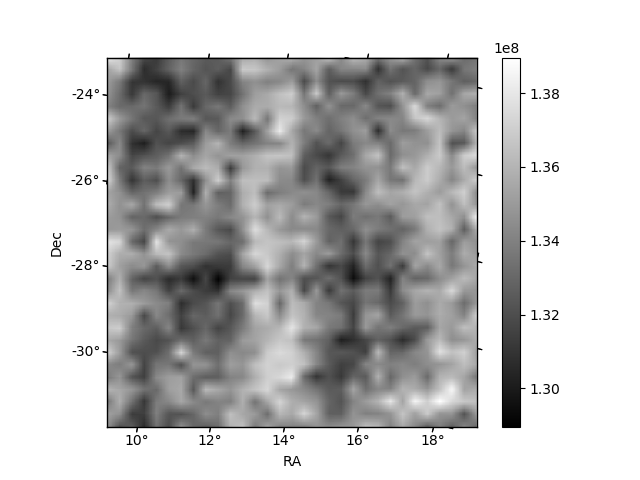
Histogram calculated using DETX and DETY for each event in the final _common_clean file
| Quadrant A | 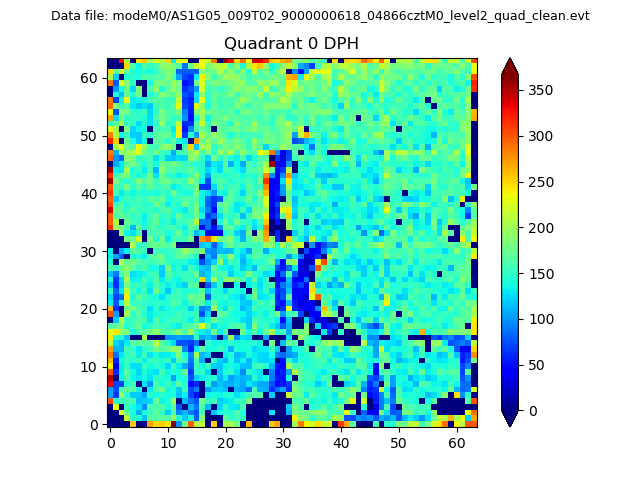 |
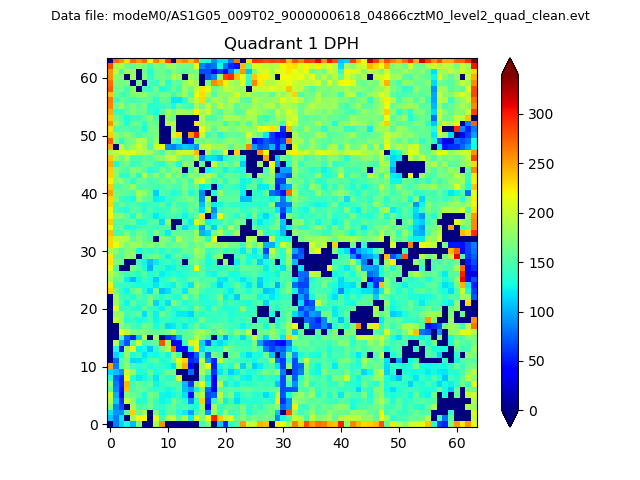 |
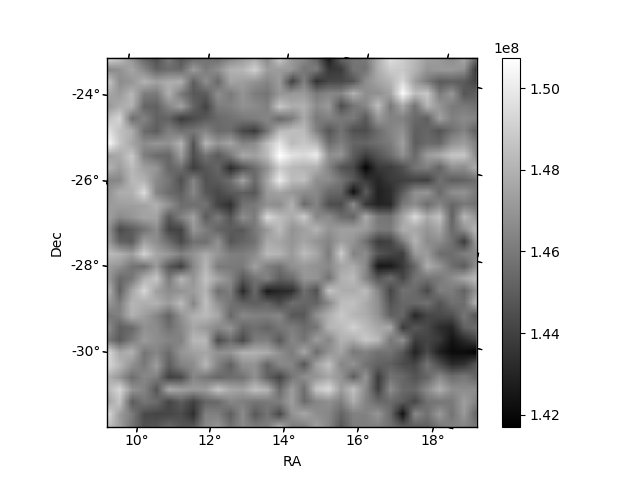
Quadrant B |
|---|---|---|---|
| Quadrant D | 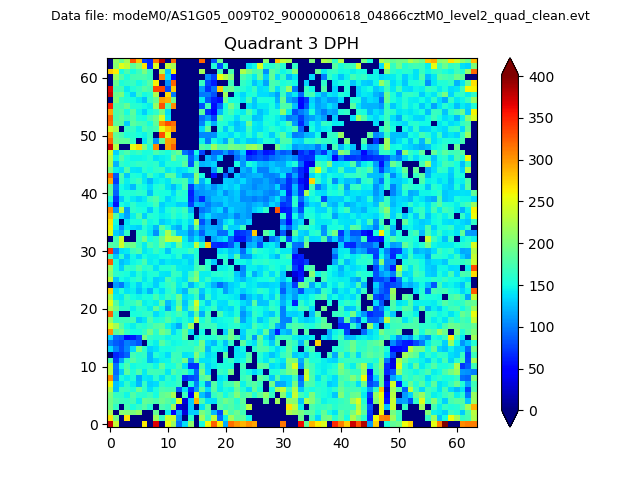 |
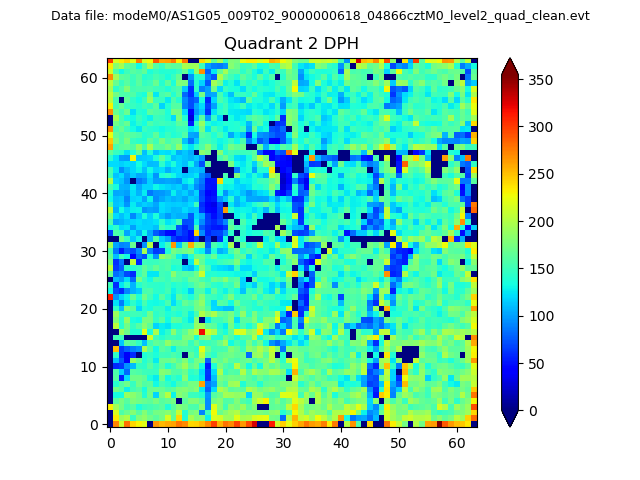 |
Quadrant C |
| Plot type | Count rate plots | Images |
|---|---|---|
| Comparison with Poisson distribution Blue bars denote a histogram of data divided into 1 sec bins. Red curve is a Poisson curve with rate = median count rate of data. |
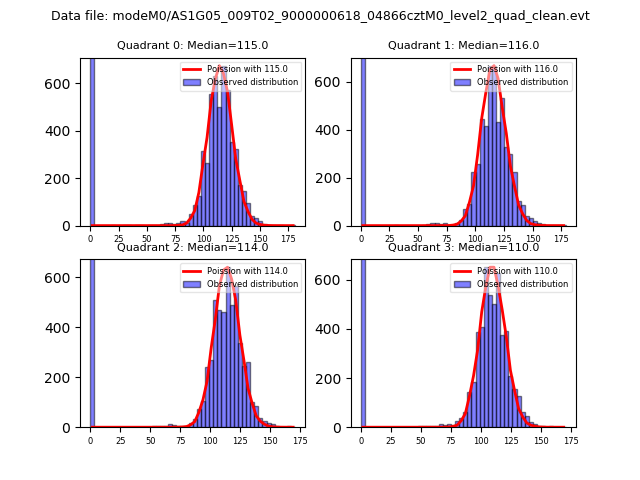 |
 |
| Quadrant-wise count rates Data is divided into 100 sec bins |
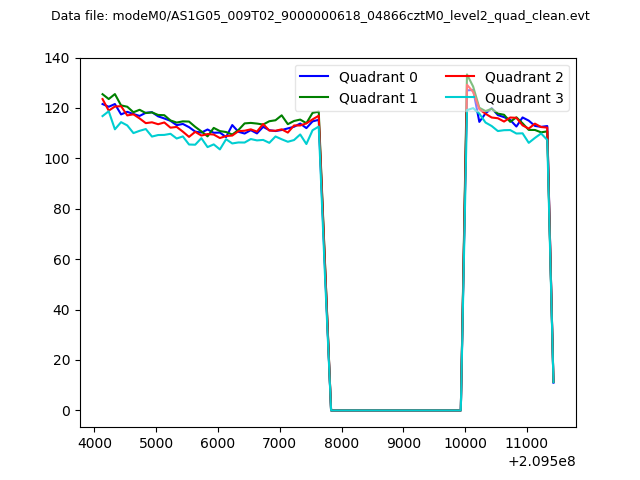 |
|
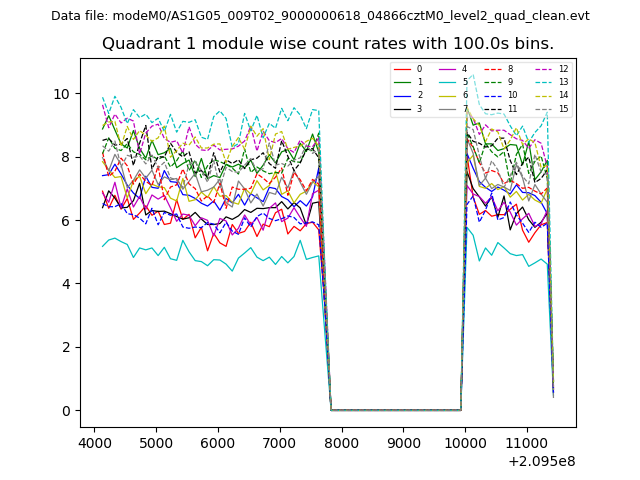
| Module-wise count rates for Quadrant A Data is divided into 100 sec bins |
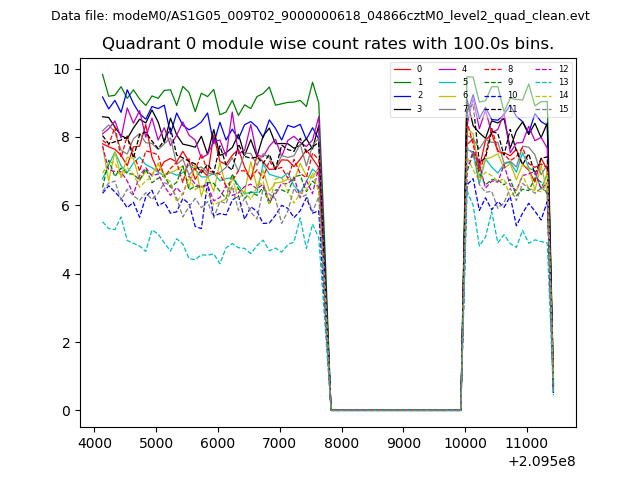 |
 |
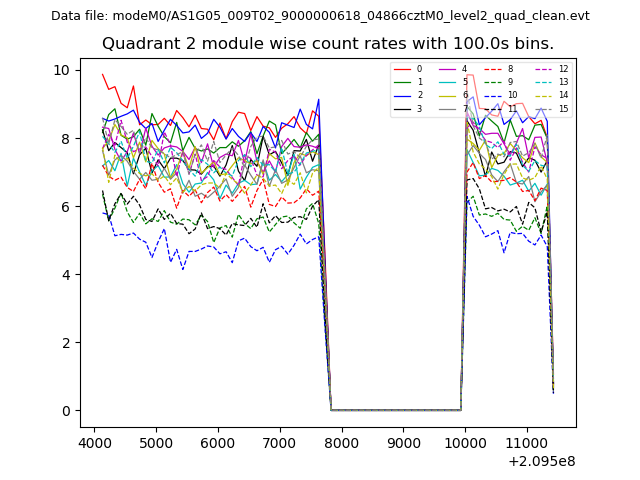
| Module-wise count rates for Quadrant B Data is divided into 100 sec bins |
 |
 |
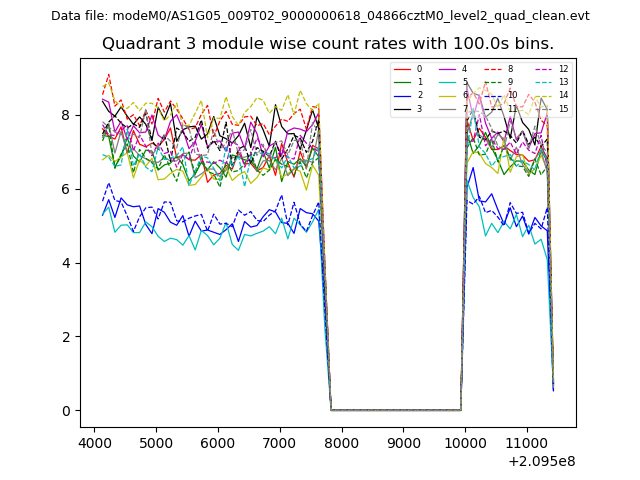
| Module-wise count rates for Quadrant C Data is divided into 100 sec bins |
 |
 |
| Module-wise count rates for Quadrant D Data is divided into 100 sec bins |
 |
 |
| Parameter | Plot |
|---|---|
| CZT HV Monitor | 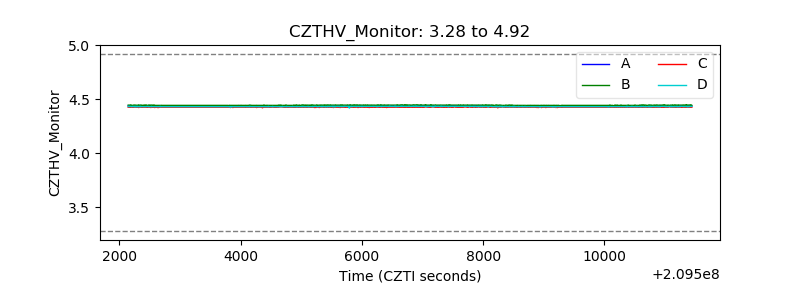 |
| D_VDD | 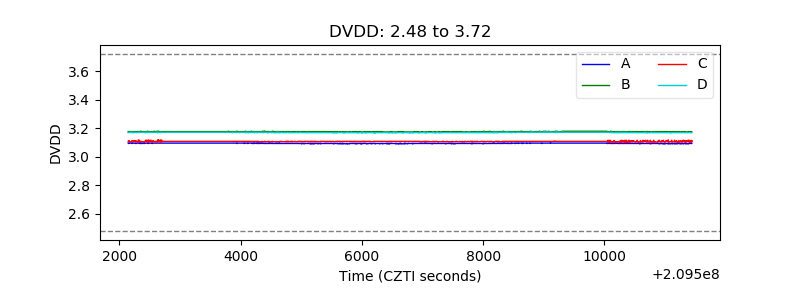 |
| Temperature 1 | 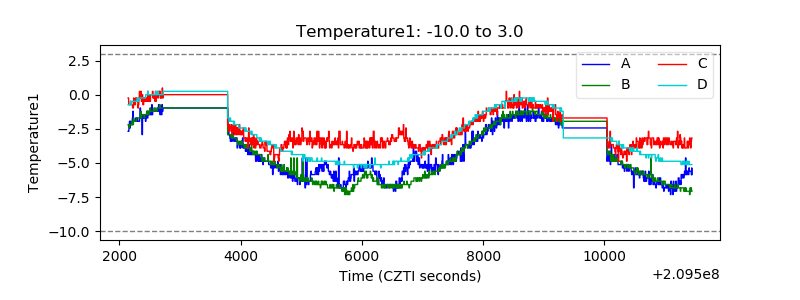 |
| Veto HV Monitor | 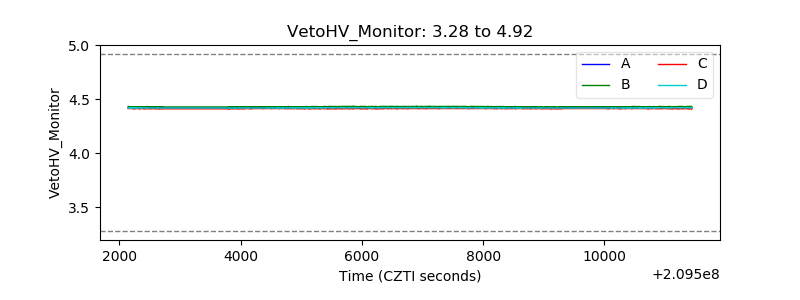 |
| Veto LLD | 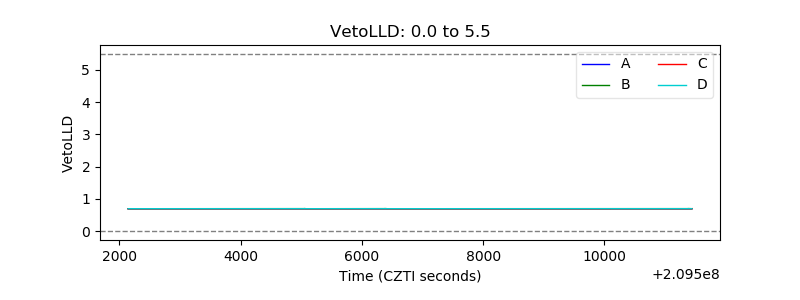 |
| Alpha Counter | 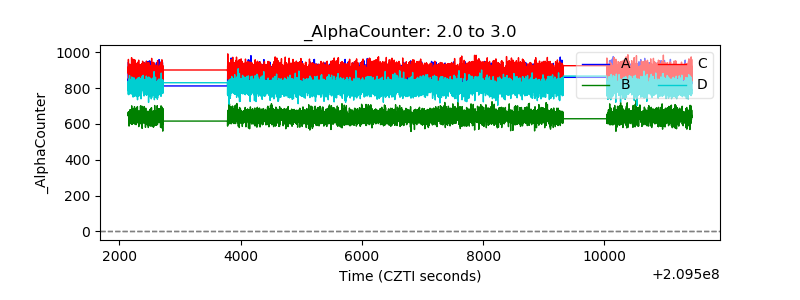 |
| _CPM_Rate | 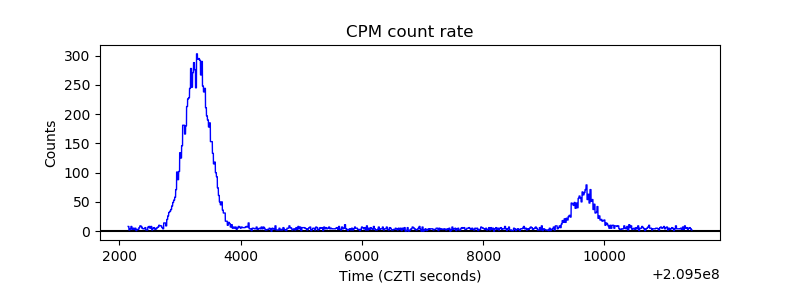 |
| CZT Counter | 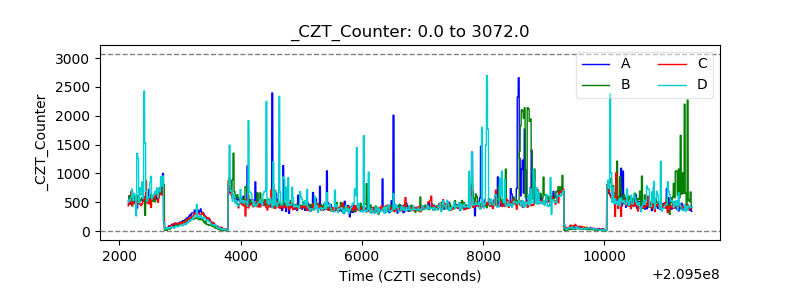 |
| +2.5 Volts monitor |  |
| +5 Volts monitor |  |
| _ROLL_ROT | 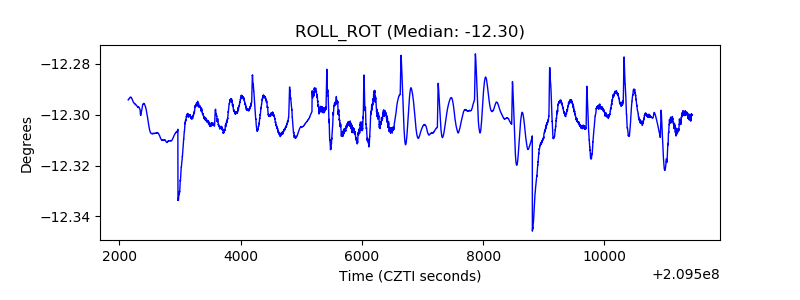 |
| _Roll_DEC | 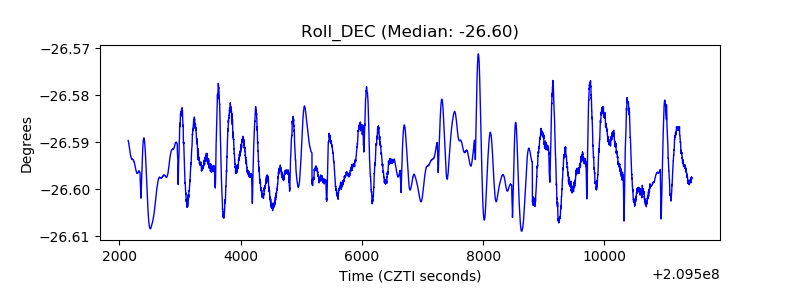 |
| _Roll_RA | 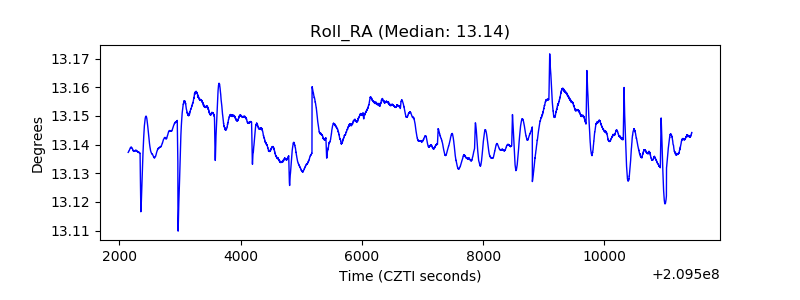 |
| Veto Counter | 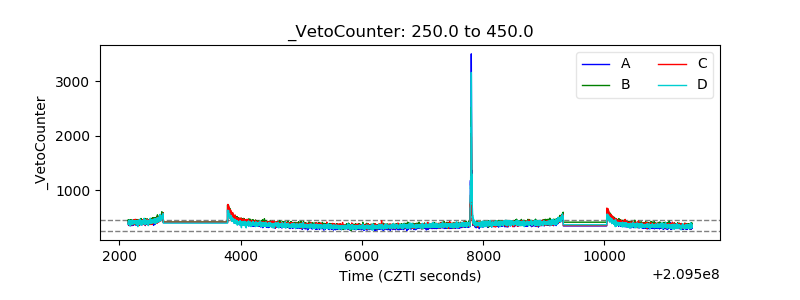 |