| Param | Original file | Final file |
|---|---|---|
| Filename | modeM0/AS1G05_009T02_9000000618_04867cztM0_level2.evt | modeM0/AS1G05_009T02_9000000618_04867cztM0_level2_quad_clean.evt |
| Size (bytes) | 513,144,000 | 86,518,080 |
| Size | 489.4 MB | 82.5 MB |
| Events in quadrant A | 3,484,828 | 531,743 |
| Events in quadrant B | 4,142,666 | 531,116 |
| Events in quadrant C | 3,419,619 | 527,458 |
| Events in quadrant D | 3,982,408 | 506,113 |
| Mode SS | |||
|---|---|---|---|
| Quadrant | BADHDUFLAG | Total packets | Discarded packets |
| A | 0 | 154 | 0 |
| B | 0 | 154 | 0 |
| C | 0 | 154 | 0 |
| D | 0 | 154 | 0 |
| Mode M0 | |||
|---|---|---|---|
| Quadrant | BADHDUFLAG | Total packets | Discarded packets |
| A | 0 | 15808 | 3 |
| B | 0 | 17477 | 2 |
| C | 0 | 15676 | 2 |
| D | 0 | 17480 | 2 |
| Mode M9 | |||
|---|---|---|---|
| Quadrant | BADHDUFLAG | Total packets | Discarded packets |
| A | 0 | 6 | 0 |
| B | 0 | 6 | 0 |
| C | 0 | 6 | 0 |
| D | 0 | 7 | 0 |
| Quadrant | Total seconds | Saturated seconds | Saturation percentage |
|---|---|---|---|
| A | 7525 | 49 | 0.651163% |
| B | 7525 | 125 | 1.661130% |
| C | 7525 | 57 | 0.757475% |
| D | 7525 | 201 | 2.671096% |
Noise dominated data is calculated using 1-second bins in cleaned event files. If a bin has >2000 counts, and if more than 50% of those come from <1% of pixels, then it is considered to be noise-dominated and hence unusable.
| Quadrant | # 1 sec bins | Bins with >0 counts | Bins with >2000 counts | High rate bins dominated by noise | Noise dominated (total time) | Noise dominated (detector-on time) | Marked lightcurve |
|---|---|---|---|---|---|---|---|
| A | 7800 | 7527 | 8 | 8 | 0.10% | 0.11% | 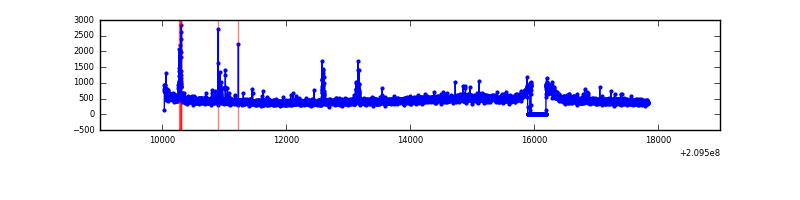 |
| B | 7800 | 7527 | 42 | 42 | 0.54% | 0.56% | 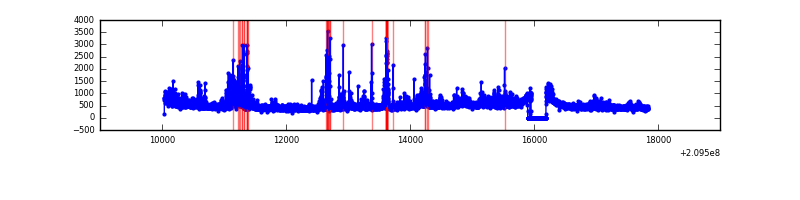 |
| C | 7800 | 7527 | 11 | 11 | 0.14% | 0.15% | 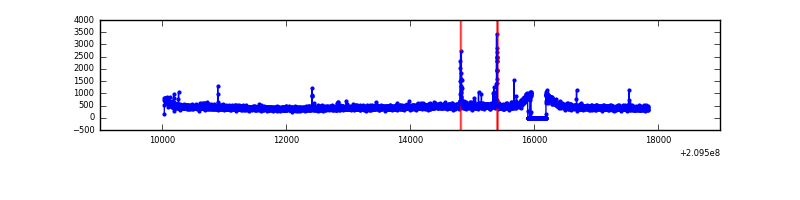 |
| D | 7800 | 7527 | 77 | 77 | 0.99% | 1.02% | 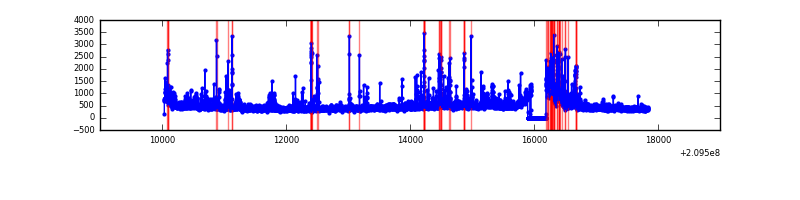 |
Top three noisy pixels from each quadrant. If the there are fewer than three noisy pixels in the level2.evt file, extra rows are filled as -1
| Pixel properties | Quadrant properties | ||||||
|---|---|---|---|---|---|---|---|
| Quadrant | DetID | PixID | Counts | Sigma | Mean | Median | Sigma |
| A | 13 | 251 | 90696 | 505.13 | 864 | 844 | 177.9 |
| A | 8 | 15 | 35776 | 196.38 | 864 | 844 | 177.9 |
| A | 0 | 50 | 24543 | 133.23 | 864 | 844 | 177.9 |
| B | 10 | 16 | 521015 | 3062.08 | 876 | 856 | 169.9 |
| B | 15 | 204 | 90699 | 528.89 | 876 | 856 | 169.9 |
| B | 4 | 80 | 77268 | 449.82 | 876 | 856 | 169.9 |
| C | 9 | 247 | 42335 | 207.99 | 847 | 848 | 199.5 |
| C | 1 | 16 | 39260 | 192.58 | 847 | 848 | 199.5 |
| C | 8 | 128 | 16445 | 78.19 | 847 | 848 | 199.5 |
| D | 2 | 136 | 287241 | 1382.17 | 835 | 808 | 207.2 |
| D | 2 | 63 | 200313 | 962.7 | 835 | 808 | 207.2 |
| D | 2 | 234 | 152103 | 730.07 | 835 | 808 | 207.2 |
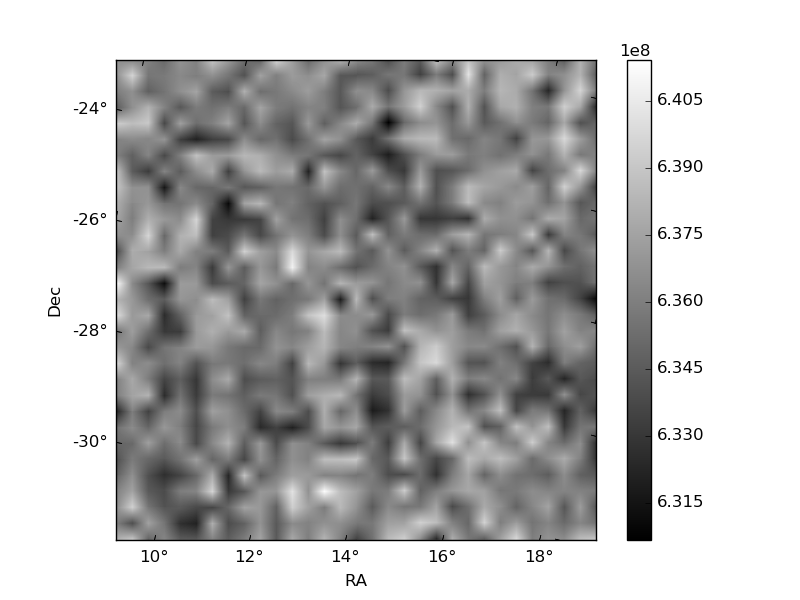
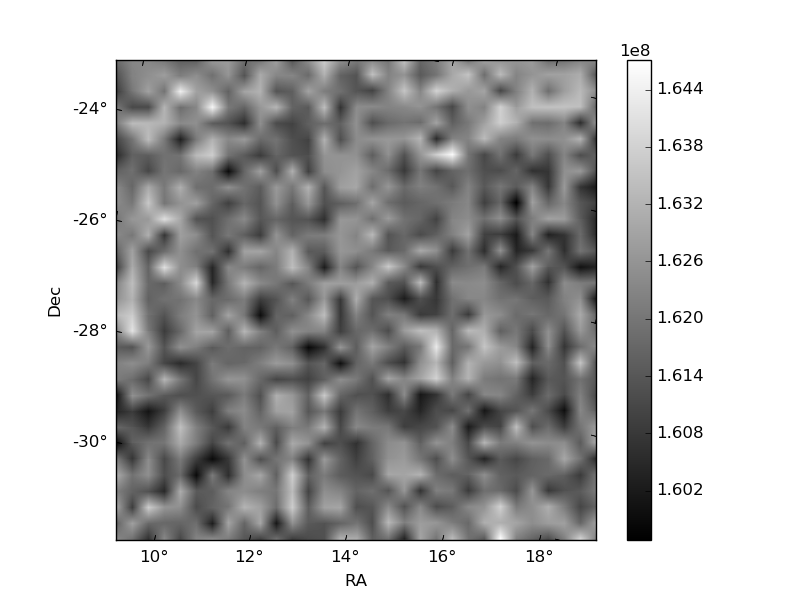
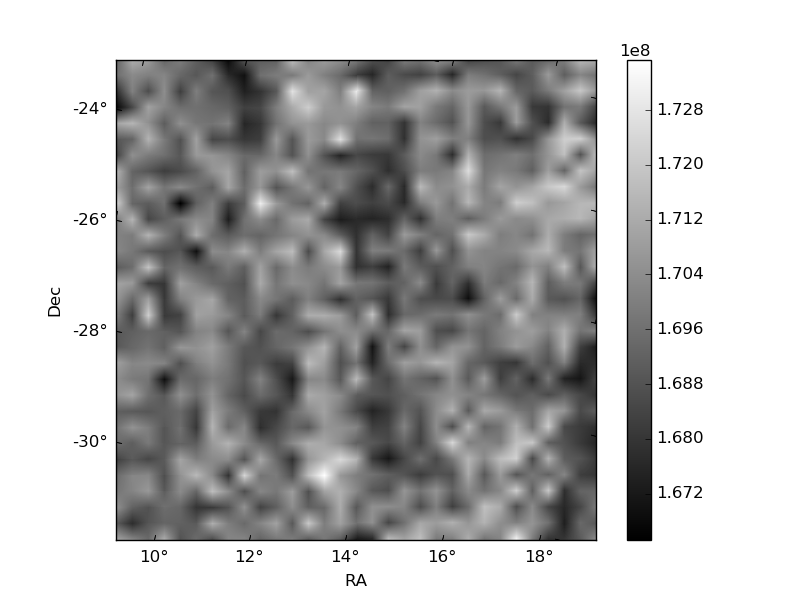
Histogram calculated using DETX and DETY for each event in the final _common_clean file
| Quadrant A | 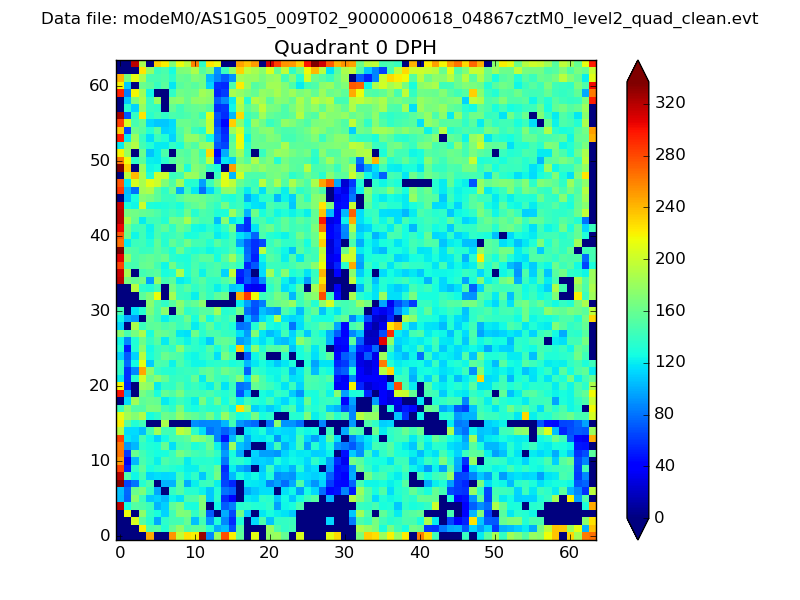 |
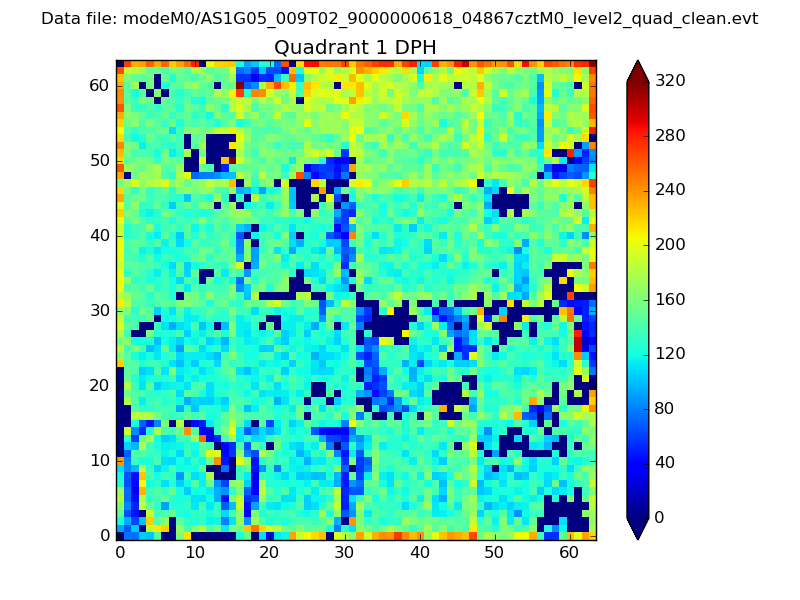 |
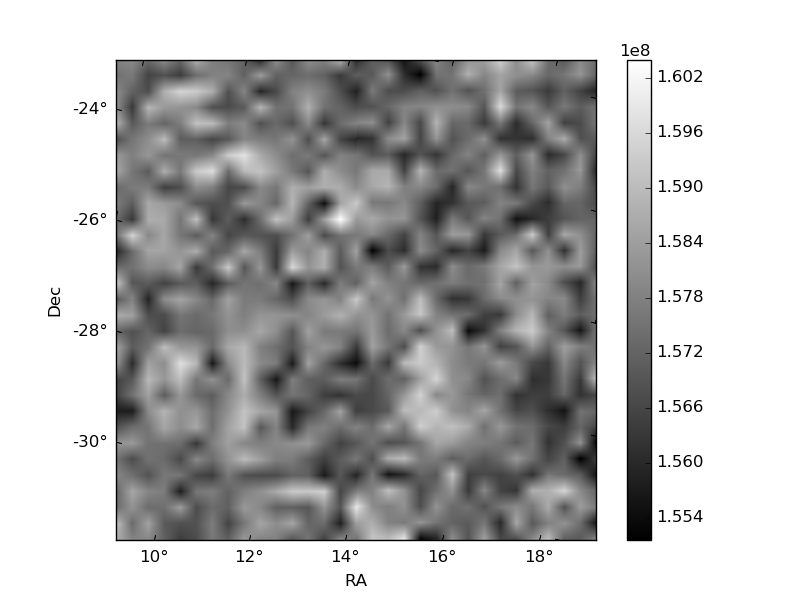
Quadrant B |
|---|---|---|---|
| Quadrant D | 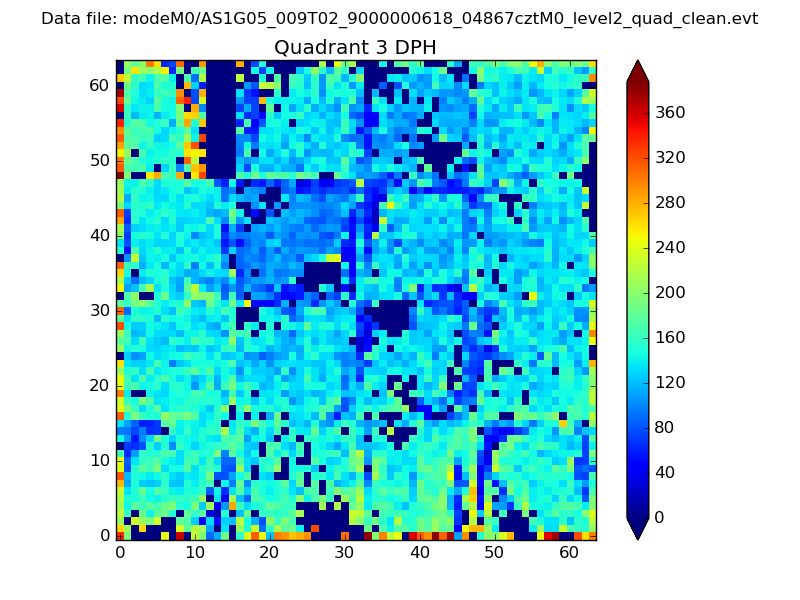 |
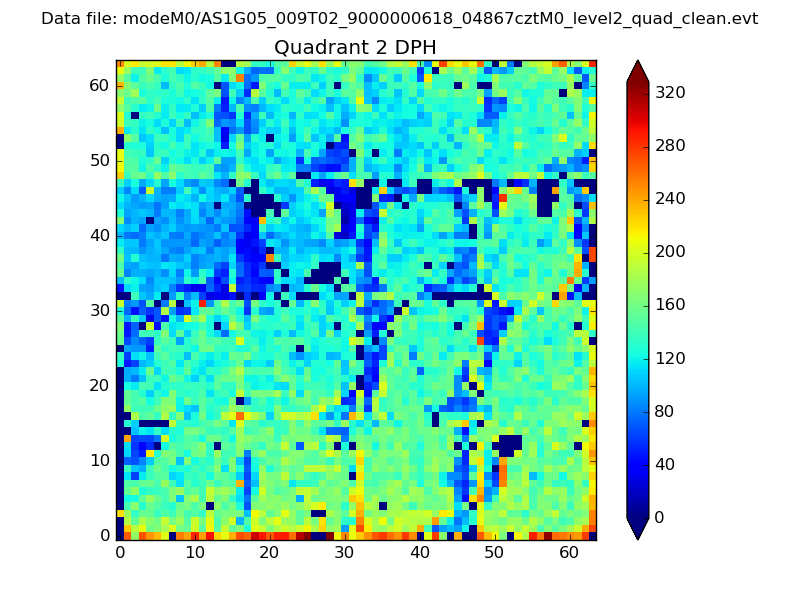 |
Quadrant C |
| Plot type | Count rate plots | Images |
|---|---|---|
| Comparison with Poisson distribution Blue bars denote a histogram of data divided into 1 sec bins. Red curve is a Poisson curve with rate = median count rate of data. |
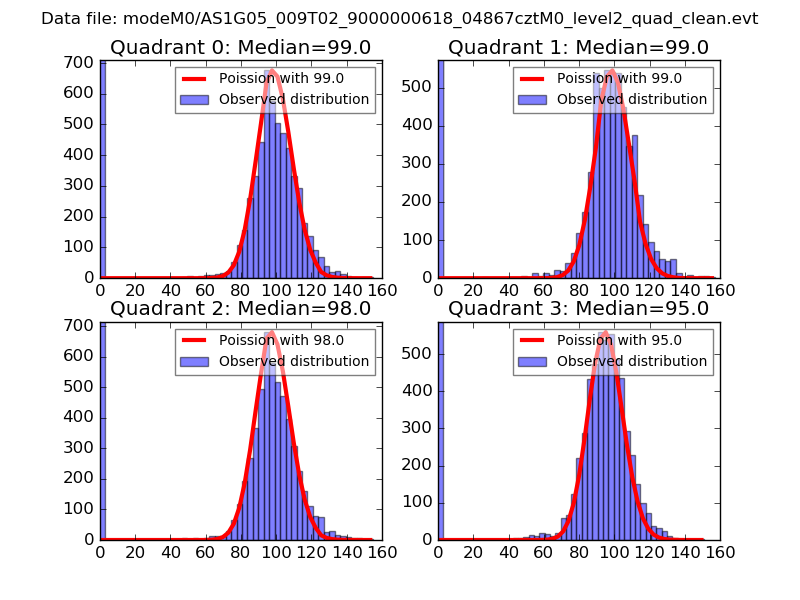 |
 |
| Quadrant-wise count rates Data is divided into 100 sec bins |
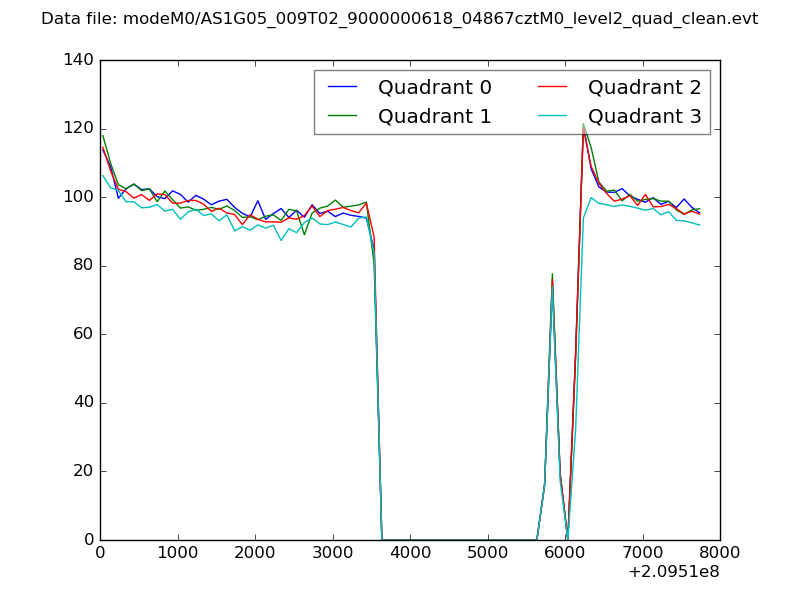 |
|
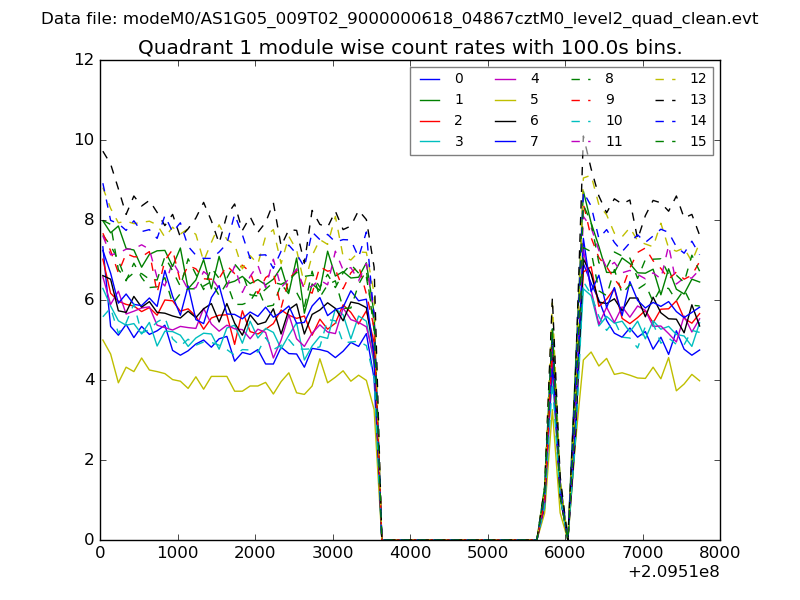
| Module-wise count rates for Quadrant A Data is divided into 100 sec bins |
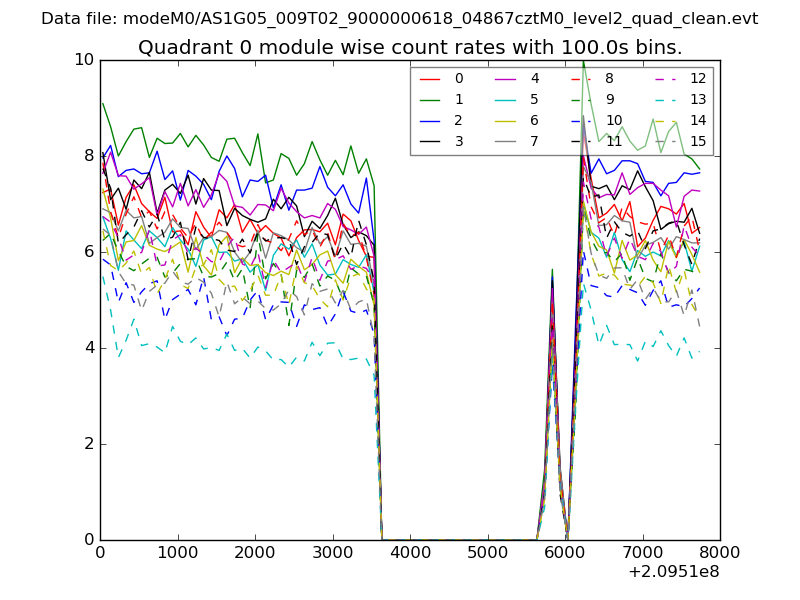 |
 |
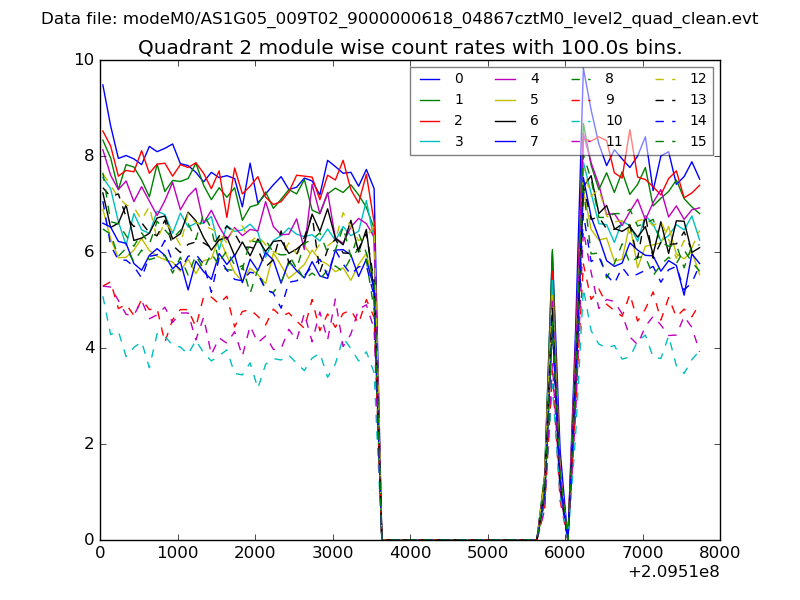
| Module-wise count rates for Quadrant B Data is divided into 100 sec bins |
 |
 |
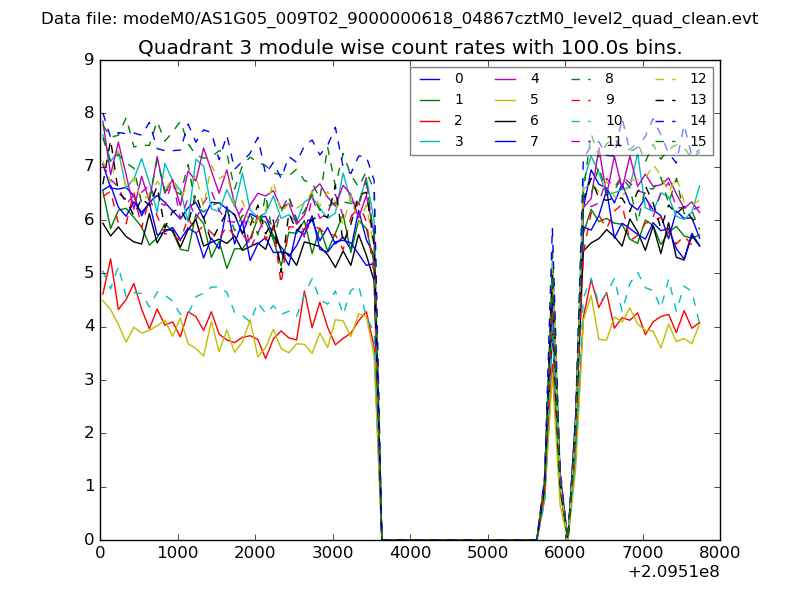
| Module-wise count rates for Quadrant C Data is divided into 100 sec bins |
 |
 |
| Module-wise count rates for Quadrant D Data is divided into 100 sec bins |
 |
 |
| Parameter | Plot |
|---|---|
| CZT HV Monitor |  |
| D_VDD |  |
| Temperature 1 | 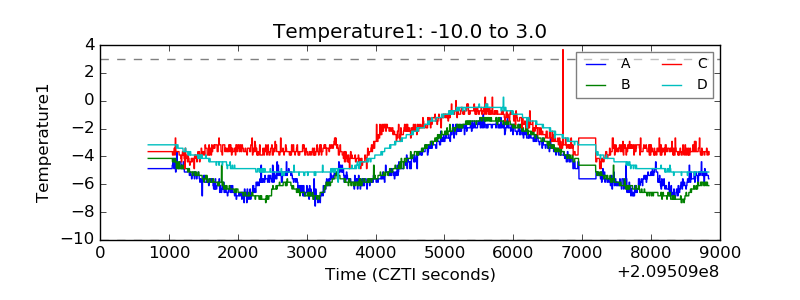 |
| Veto HV Monitor | 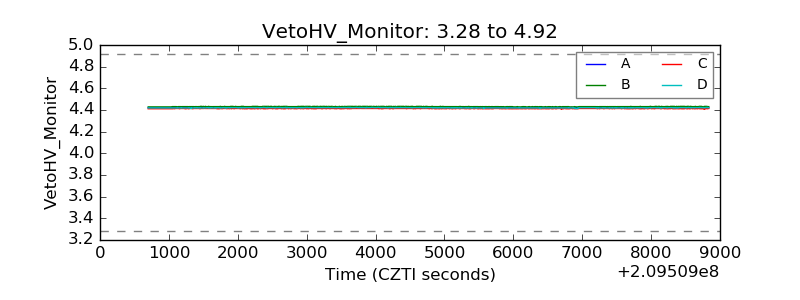 |
| Veto LLD | 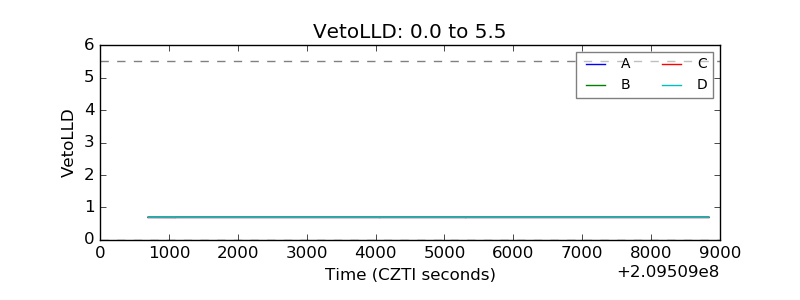 |
| Alpha Counter | 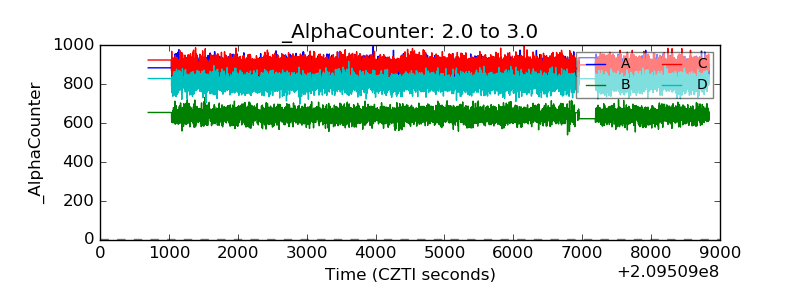 |
| _CPM_Rate | 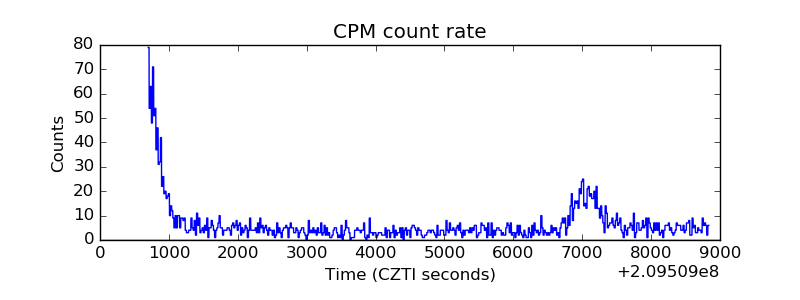 |
| CZT Counter | 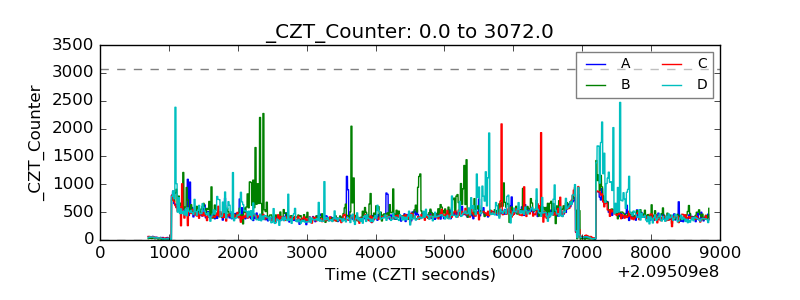 |
| +2.5 Volts monitor |  |
| +5 Volts monitor |  |
| _ROLL_ROT | 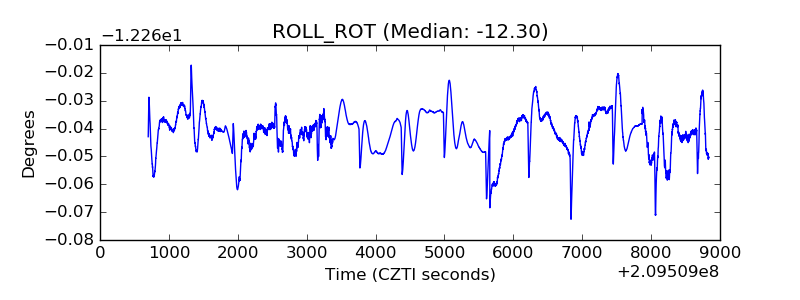 |
| _Roll_DEC | 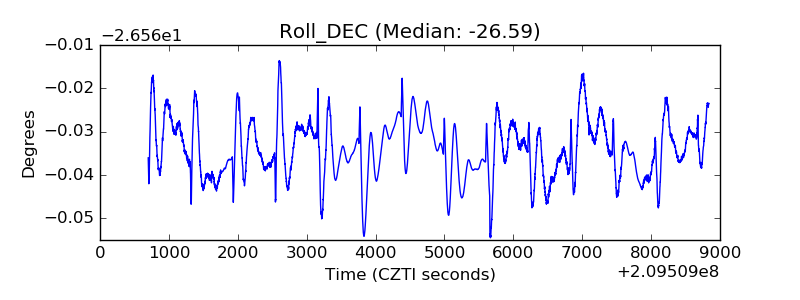 |
| _Roll_RA | 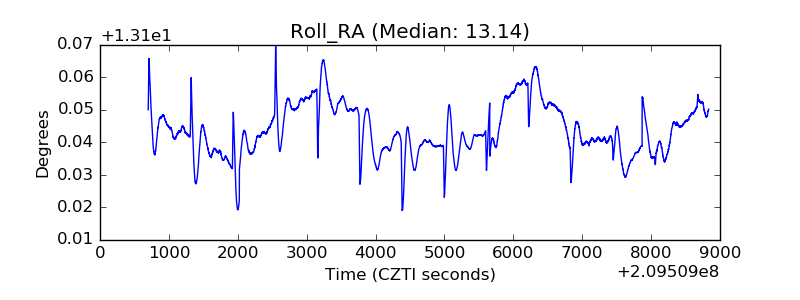 |
| Veto Counter | 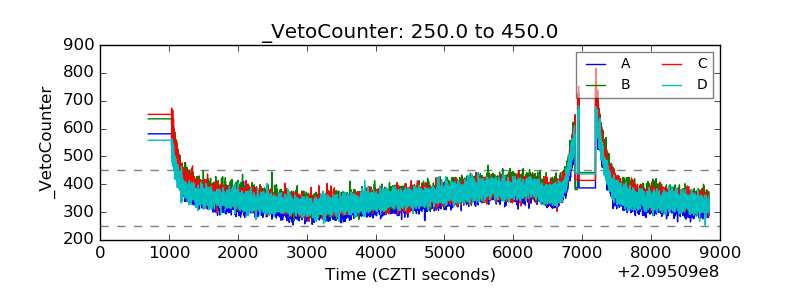 |