| Param | Original file | Final file |
|---|---|---|
| Filename | modeM0/AS1G05_009T02_9000000618_04873cztM0_level2.evt | modeM0/AS1G05_009T02_9000000618_04873cztM0_level2_quad_clean.evt |
| Size (bytes) | 1,633,602,240 | 238,956,480 |
| Size | 1.5 GB | 227.9 MB |
| Events in quadrant A | 10,813,834 | 1,429,927 |
| Events in quadrant B | 13,085,362 | 1,423,172 |
| Events in quadrant C | 10,410,269 | 1,429,314 |
| Events in quadrant D | 13,581,678 | 1,343,819 |
| Mode SS | |||
|---|---|---|---|
| Quadrant | BADHDUFLAG | Total packets | Discarded packets |
| A | 0 | 498 | 20 |
| B | 0 | 498 | 16 |
| C | 0 | 498 | 14 |
| D | 0 | 498 | 32 |
| Mode M0 | |||
|---|---|---|---|
| Quadrant | BADHDUFLAG | Total packets | Discarded packets |
| A | 0 | 50825 | 1902 |
| B | 0 | 57071 | 2259 |
| C | 0 | 50022 | 1773 |
| D | 0 | 60296 | 3113 |
| Mode M9 | |||
|---|---|---|---|
| Quadrant | BADHDUFLAG | Total packets | Discarded packets |
| A | 0 | 15 | 0 |
| B | 0 | 14 | 0 |
| C | 0 | 14 | 0 |
| D | 0 | 14 | 0 |
| Quadrant | Total seconds | Saturated seconds | Saturation percentage |
|---|---|---|---|
| A | 23414 | 384 | 1.640044% |
| B | 23392 | 847 | 3.620896% |
| C | 23465 | 320 | 1.363733% |
| D | 23292 | 1011 | 4.340546% |
Noise dominated data is calculated using 1-second bins in cleaned event files. If a bin has >2000 counts, and if more than 50% of those come from <1% of pixels, then it is considered to be noise-dominated and hence unusable.
| Quadrant | # 1 sec bins | Bins with >0 counts | Bins with >2000 counts | High rate bins dominated by noise | Noise dominated (total time) | Noise dominated (detector-on time) | Marked lightcurve |
|---|---|---|---|---|---|---|---|
| A | 25693 | 24123 | 52 | 52 | 0.20% | 0.22% | 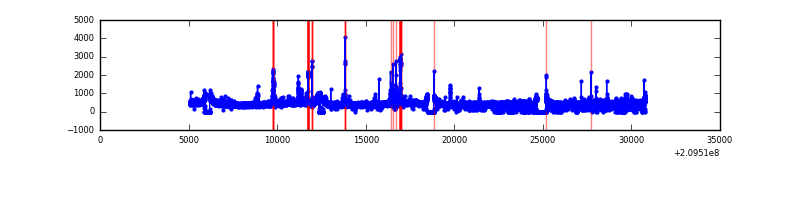 |
| B | 25693 | 24083 | 242 | 242 | 0.94% | 1.00% | 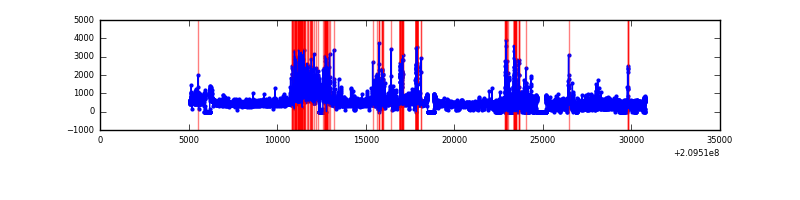 |
| C | 25693 | 24128 | 10 | 10 | 0.04% | 0.04% | 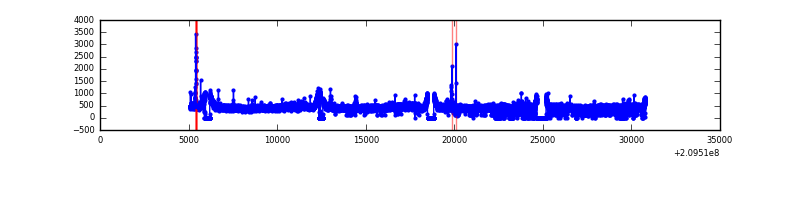 |
| D | 25693 | 24023 | 528 | 528 | 2.06% | 2.20% | 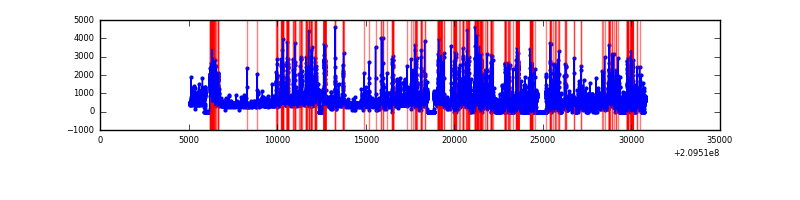 |
Top three noisy pixels from each quadrant. If the there are fewer than three noisy pixels in the level2.evt file, extra rows are filled as -1
| Pixel properties | Quadrant properties | ||||||
|---|---|---|---|---|---|---|---|
| Quadrant | DetID | PixID | Counts | Sigma | Mean | Median | Sigma |
| A | 13 | 251 | 347437 | 623.4 | 2687 | 2628 | 553.1 |
| A | 8 | 15 | 67462 | 117.22 | 2687 | 2628 | 553.1 |
| A | 0 | 50 | 39023 | 65.8 | 2687 | 2628 | 553.1 |
| B | 10 | 16 | 1940524 | 3737.99 | 2695 | 2632 | 518.4 |
| B | 15 | 204 | 255586 | 487.92 | 2695 | 2632 | 518.4 |
| B | 4 | 80 | 187342 | 356.29 | 2695 | 2632 | 518.4 |
| C | 1 | 16 | 47739 | 73.25 | 2641 | 2646 | 615.6 |
| C | 9 | 247 | 42741 | 65.13 | 2641 | 2646 | 615.6 |
| C | 13 | 61 | 21523 | 30.66 | 2641 | 2646 | 615.6 |
| D | 13 | 235 | 1122824 | 1764.32 | 2588 | 2505 | 635.0 |
| D | 2 | 136 | 720797 | 1131.19 | 2588 | 2505 | 635.0 |
| D | 1 | 31 | 514965 | 807.04 | 2588 | 2505 | 635.0 |
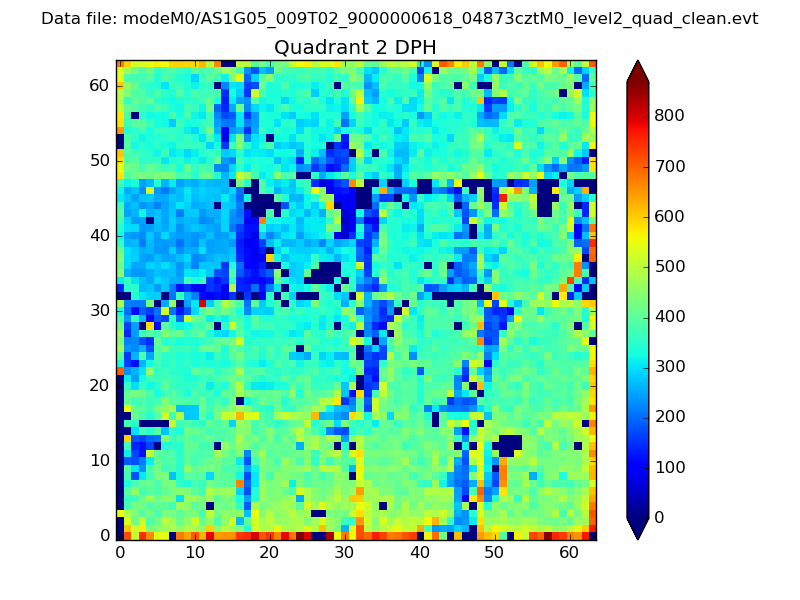
Histogram calculated using DETX and DETY for each event in the final _common_clean file
| Quadrant A | 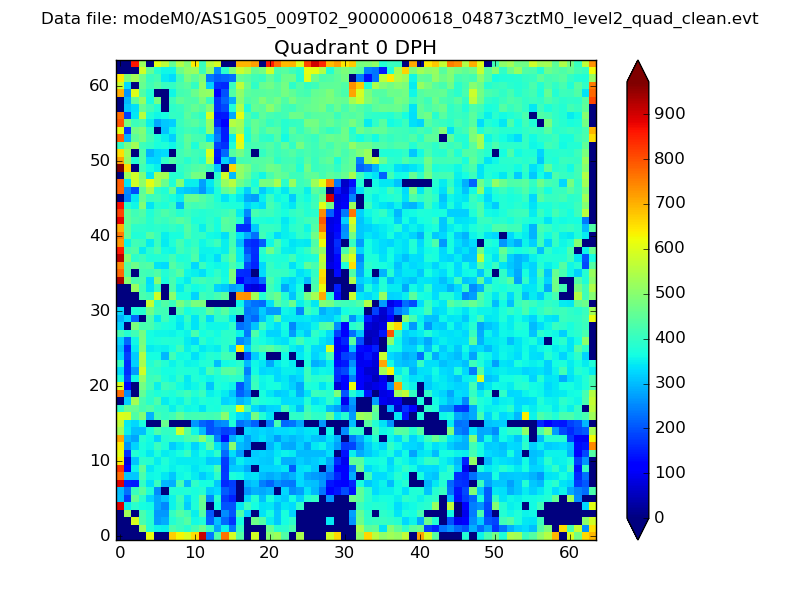 |
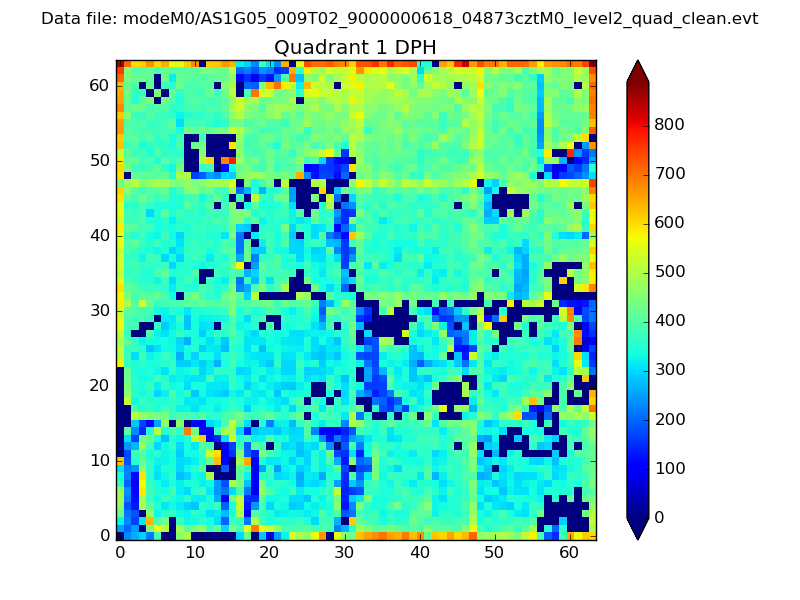 |
Quadrant B |
|---|---|---|---|
| Quadrant D | 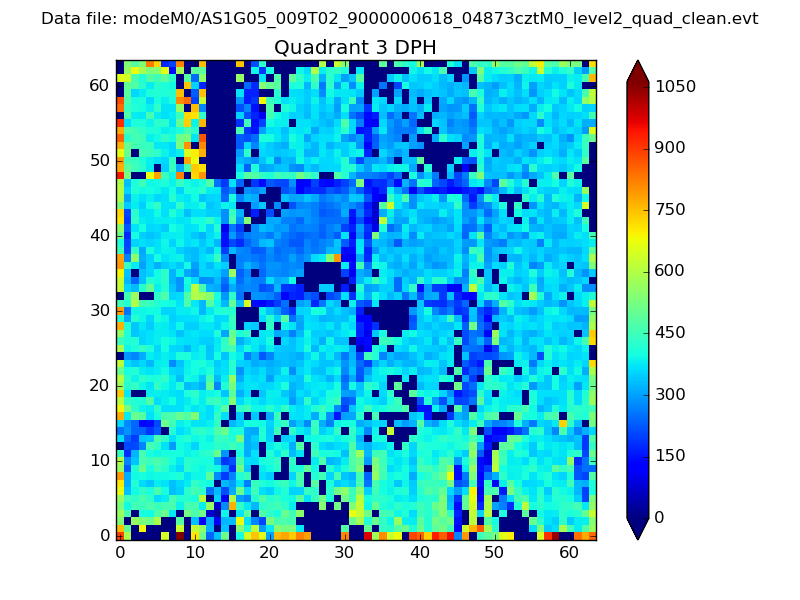 |
 |
Quadrant C |
| Plot type | Count rate plots | Images |
|---|---|---|
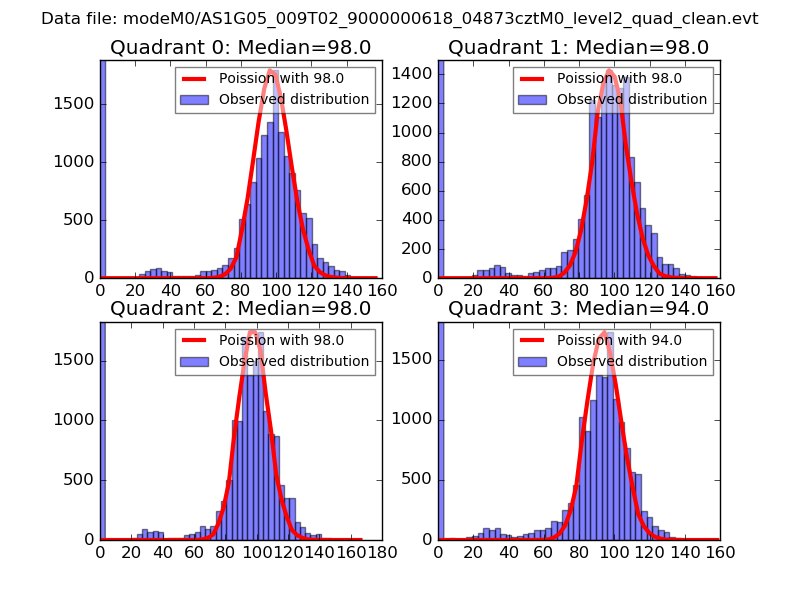
| Comparison with Poisson distribution Blue bars denote a histogram of data divided into 1 sec bins. Red curve is a Poisson curve with rate = median count rate of data. |
 |
 |
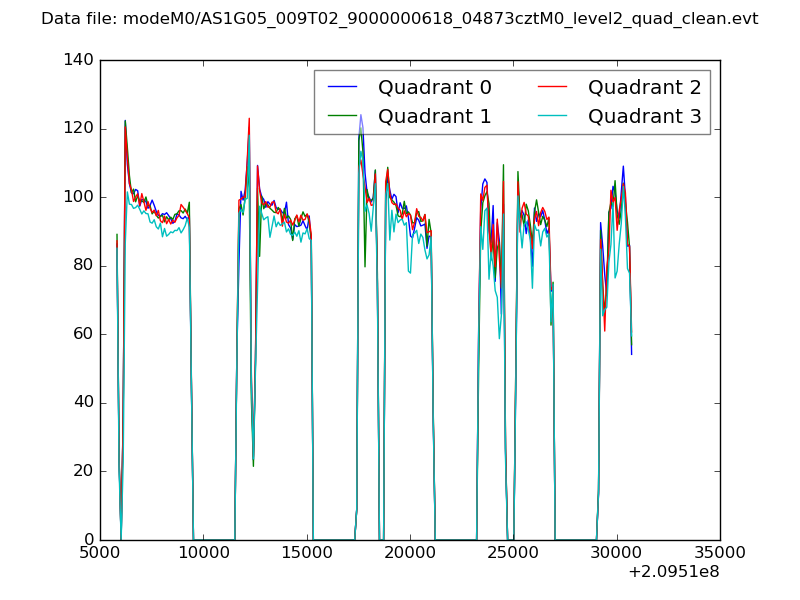
| Quadrant-wise count rates Data is divided into 100 sec bins |
 |
|
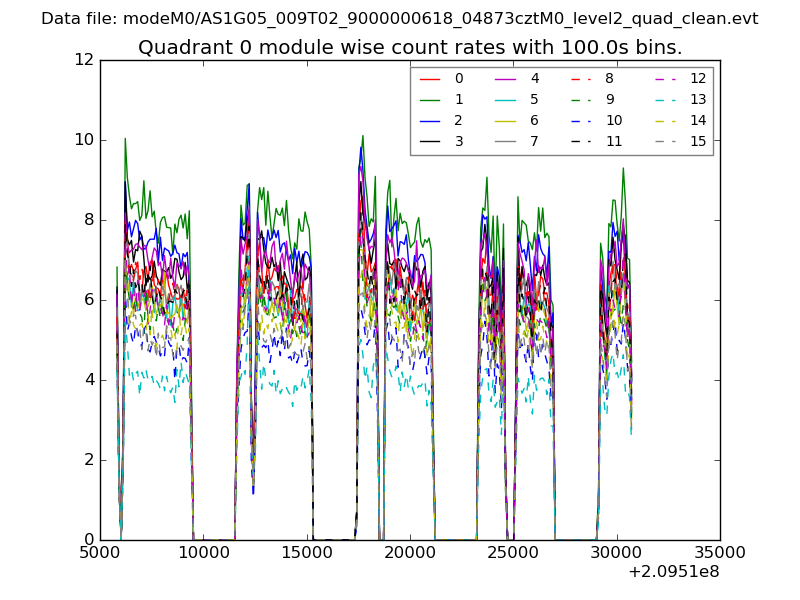
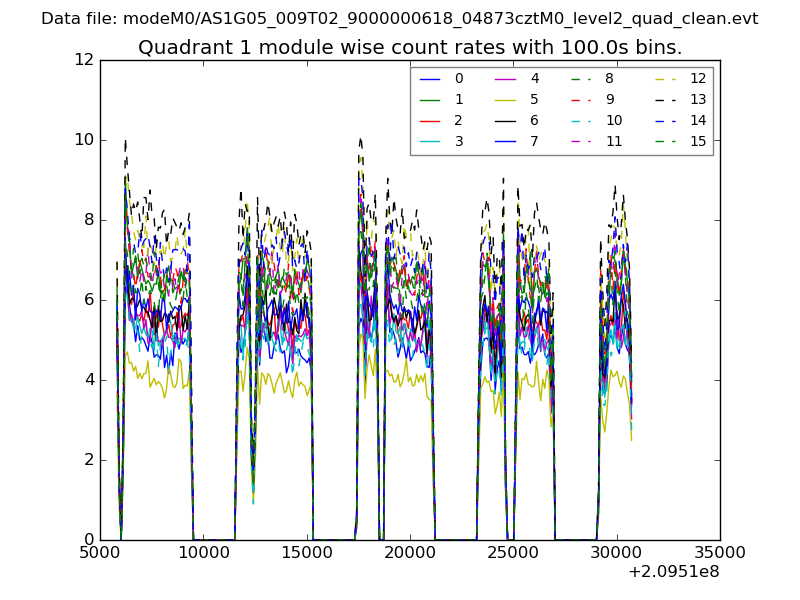
| Module-wise count rates for Quadrant A Data is divided into 100 sec bins |
 |
 |
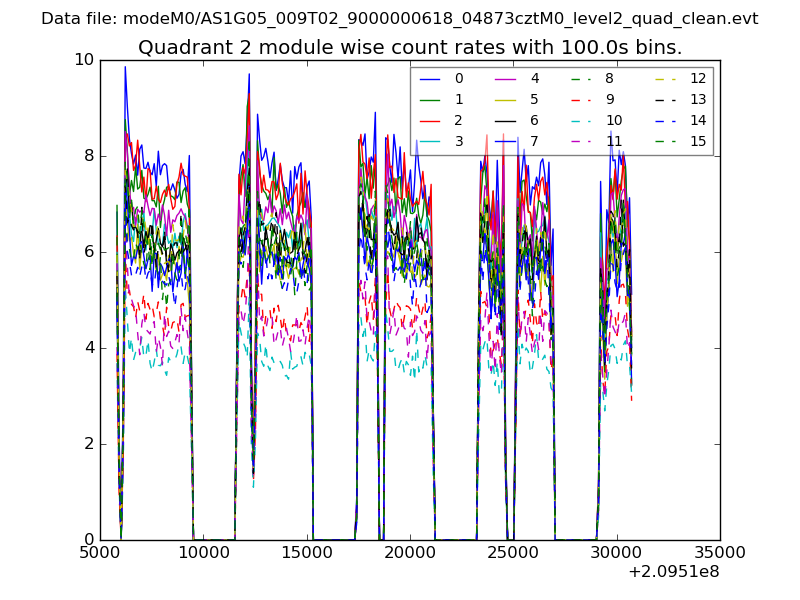
| Module-wise count rates for Quadrant B Data is divided into 100 sec bins |
 |
 |
| Module-wise count rates for Quadrant C Data is divided into 100 sec bins |
 |
 |
| Module-wise count rates for Quadrant D Data is divided into 100 sec bins |
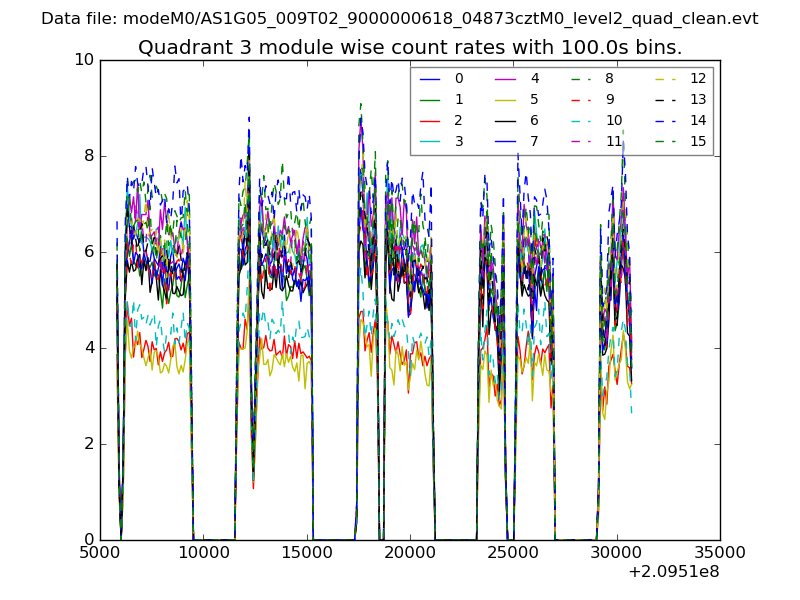 |
 |
| Parameter | Plot |
|---|---|
| CZT HV Monitor | 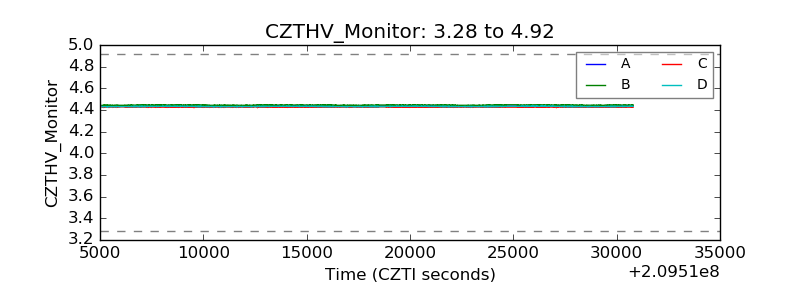 |
| D_VDD | 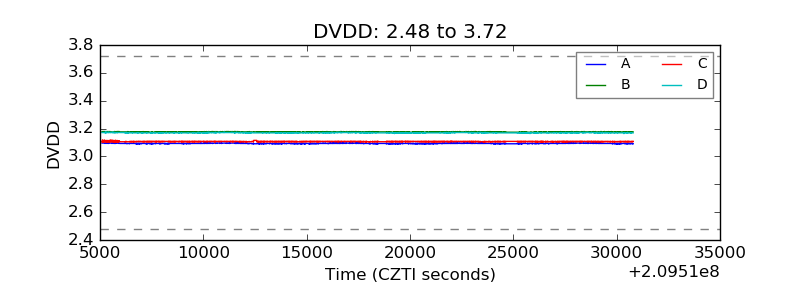 |
| Temperature 1 | 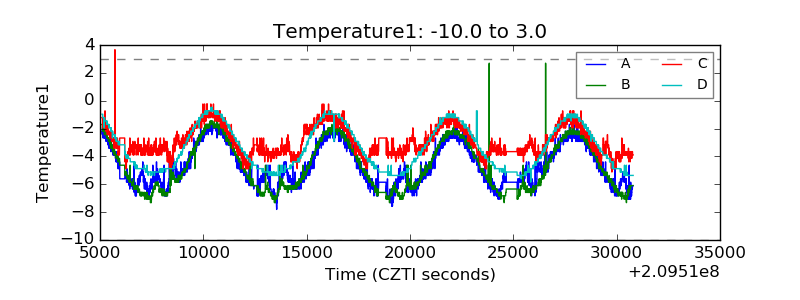 |
| Veto HV Monitor | 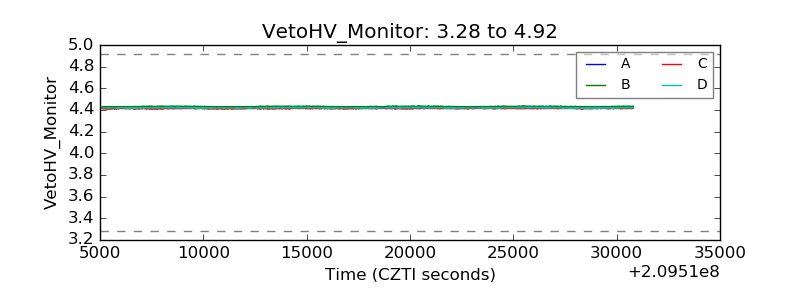 |
| Veto LLD | 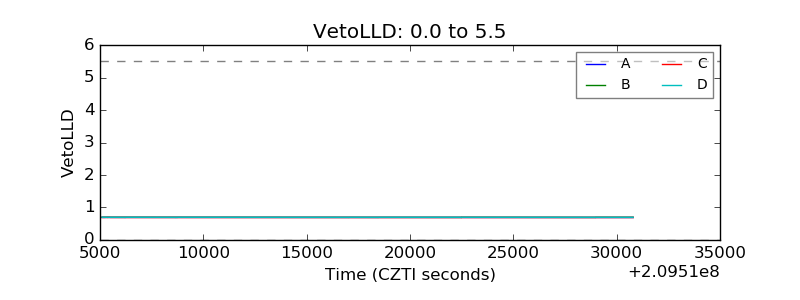 |
| Alpha Counter | 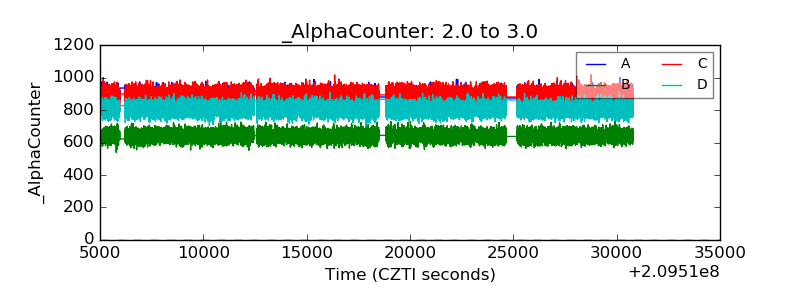 |
| _CPM_Rate | 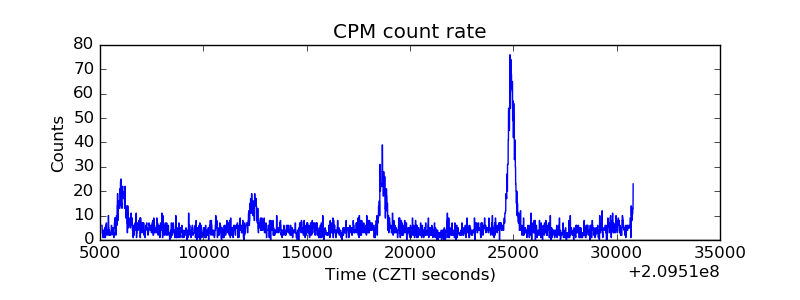 |
| CZT Counter | 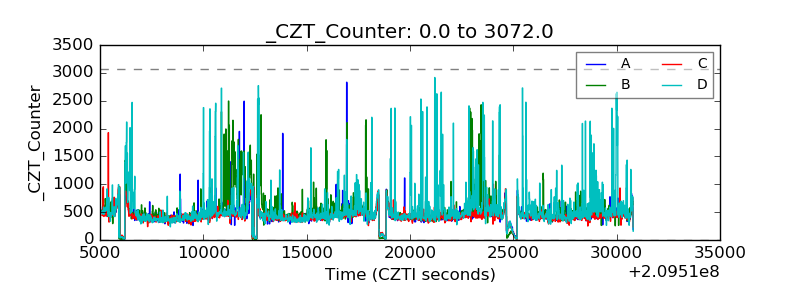 |
| +2.5 Volts monitor | 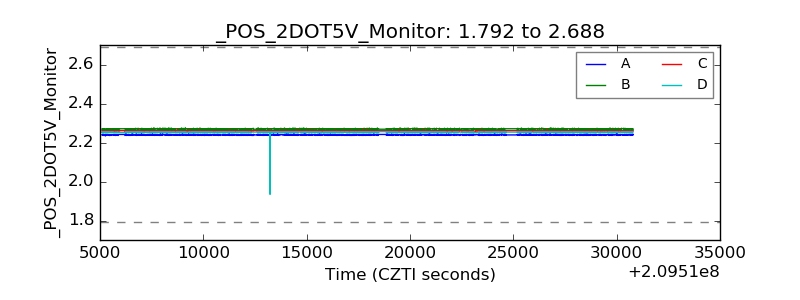 |
| +5 Volts monitor | 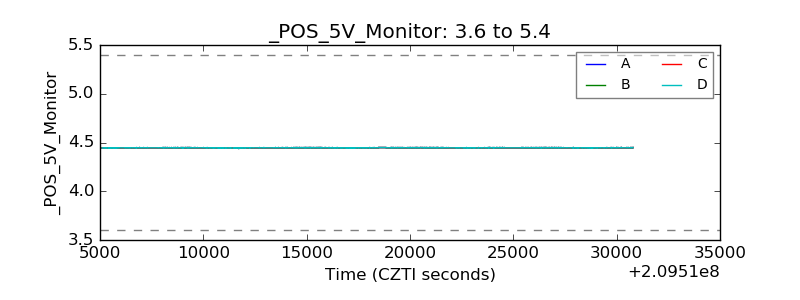 |
| _ROLL_ROT | 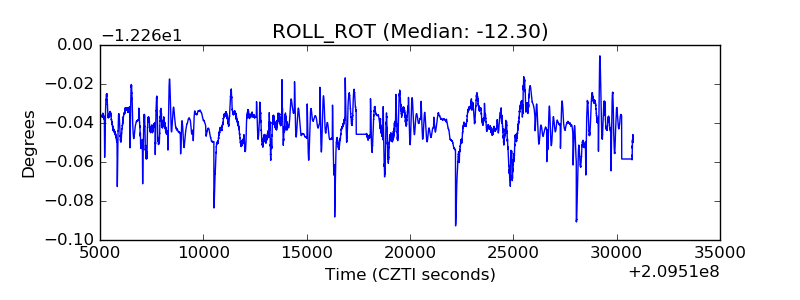 |
| _Roll_DEC | 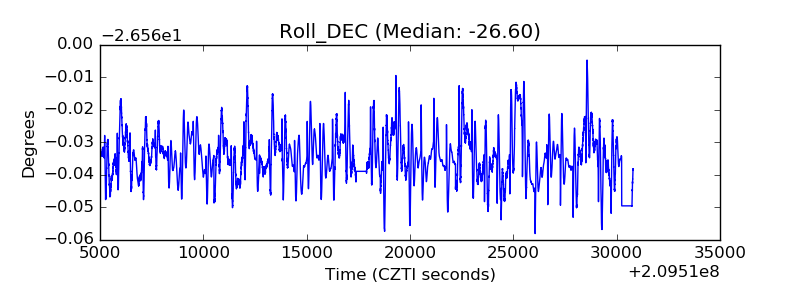 |
| _Roll_RA | 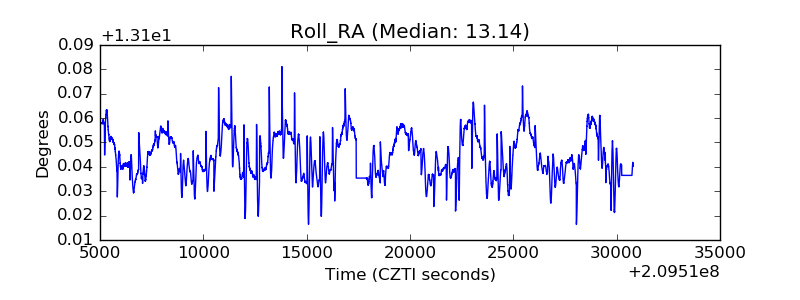 |
| Veto Counter | 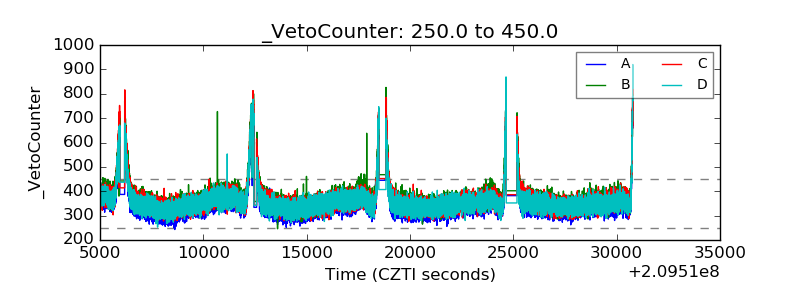 |