| Param | Original file | Final file |
|---|---|---|
| Filename | modeM0/AS1G05_009T02_9000000618_04875cztM0_level2.evt | modeM0/AS1G05_009T02_9000000618_04875cztM0_level2_quad_clean.evt |
| Size (bytes) | 1,379,183,040 | 165,741,120 |
| Size | 1.3 GB | 158.1 MB |
| Events in quadrant A | 12,781,619 | 937,675 |
| Events in quadrant B | 8,768,192 | 983,656 |
| Events in quadrant C | 7,824,171 | 969,661 |
| Events in quadrant D | 11,221,806 | 930,451 |
| Mode SS | |||
|---|---|---|---|
| Quadrant | BADHDUFLAG | Total packets | Discarded packets |
| A | 0 | 358 | 0 |
| B | 0 | 358 | 0 |
| C | 0 | 358 | 0 |
| D | 0 | 358 | 0 |
| Mode M0 | |||
|---|---|---|---|
| Quadrant | BADHDUFLAG | Total packets | Discarded packets |
| A | 0 | 49658 | 5 |
| B | 0 | 37332 | 4 |
| C | 0 | 35568 | 4 |
| D | 0 | 45343 | 4 |
| Mode M9 | |||
|---|---|---|---|
| Quadrant | BADHDUFLAG | Total packets | Discarded packets |
| A | 0 | 36 | 0 |
| B | 0 | 36 | 0 |
| C | 0 | 36 | 0 |
| D | 0 | 36 | 0 |
| Quadrant | Total seconds | Saturated seconds | Saturation percentage |
|---|---|---|---|
| A | 17353 | 2048 | 11.801994% |
| B | 17353 | 261 | 1.504063% |
| C | 17353 | 204 | 1.175589% |
| D | 17353 | 715 | 4.120325% |
Noise dominated data is calculated using 1-second bins in cleaned event files. If a bin has >2000 counts, and if more than 50% of those come from <1% of pixels, then it is considered to be noise-dominated and hence unusable.
| Quadrant | # 1 sec bins | Bins with >0 counts | Bins with >2000 counts | High rate bins dominated by noise | Noise dominated (total time) | Noise dominated (detector-on time) | Marked lightcurve |
|---|---|---|---|---|---|---|---|
| A | 21103 | 17353 | 1642 | 1642 | 7.78% | 9.46% | 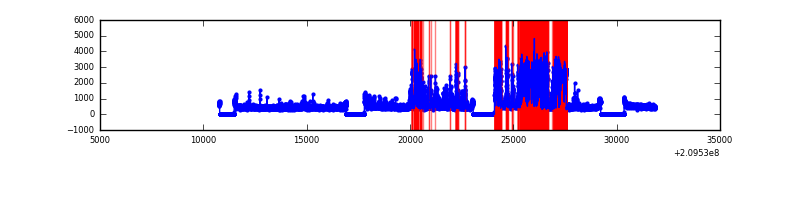 |
| B | 21103 | 17353 | 15 | 15 | 0.07% | 0.09% | 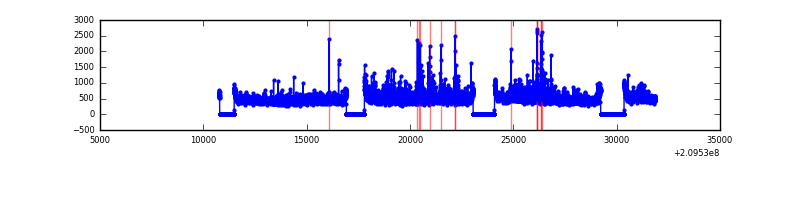 |
| C | 21103 | 17353 | 0 | 0 | 0.00% | 0.00% | 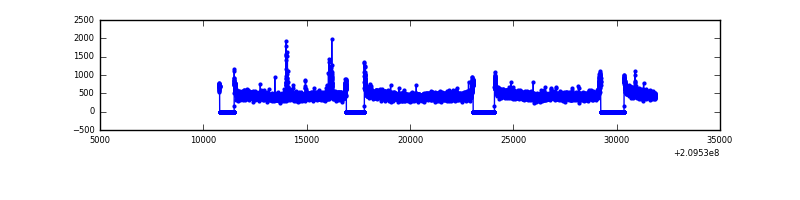 |
| D | 21103 | 17353 | 440 | 440 | 2.09% | 2.54% | 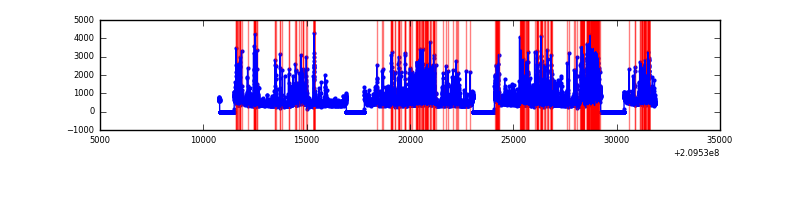 |
Top three noisy pixels from each quadrant. If the there are fewer than three noisy pixels in the level2.evt file, extra rows are filled as -1
| Pixel properties | Quadrant properties | ||||||
|---|---|---|---|---|---|---|---|
| Quadrant | DetID | PixID | Counts | Sigma | Mean | Median | Sigma |
| A | 13 | 251 | 5262435 | 13487.37 | 1918 | 1871 | 390.0 |
| A | 8 | 15 | 93419 | 234.72 | 1918 | 1871 | 390.0 |
| A | 0 | 50 | 43861 | 107.66 | 1918 | 1871 | 390.0 |
| B | 4 | 80 | 414082 | 1051.14 | 2052 | 2001 | 392.0 |
| B | 15 | 204 | 184004 | 464.25 | 2052 | 2001 | 392.0 |
| B | 15 | 54 | 79505 | 197.7 | 2052 | 2001 | 392.0 |
| C | 9 | 247 | 79575 | 170.46 | 1978 | 1980 | 455.2 |
| C | 13 | 61 | 16090 | 31.0 | 1978 | 1980 | 455.2 |
| C | 12 | 4 | 15128 | 28.88 | 1978 | 1980 | 455.2 |
| D | 2 | 136 | 948915 | 1968.43 | 1974 | 1913 | 481.1 |
| D | 12 | 233 | 740379 | 1534.97 | 1974 | 1913 | 481.1 |
| D | 1 | 31 | 664008 | 1376.22 | 1974 | 1913 | 481.1 |
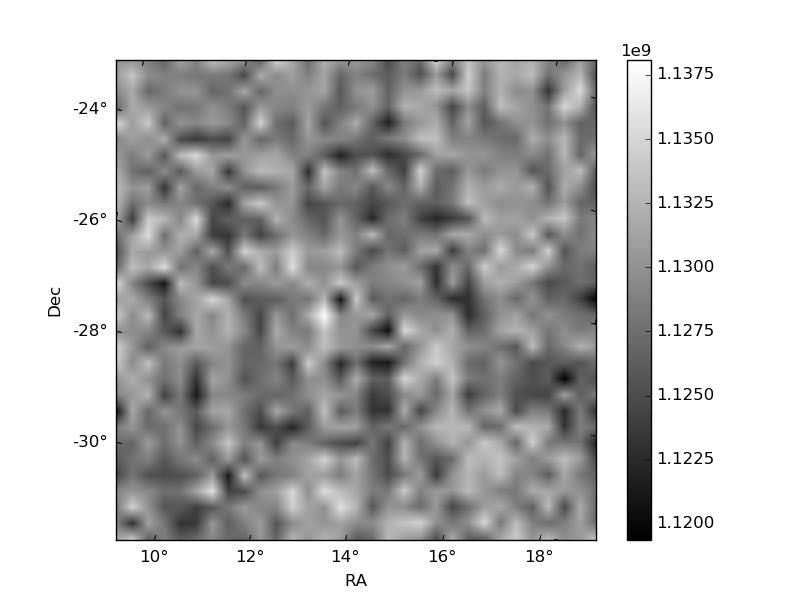
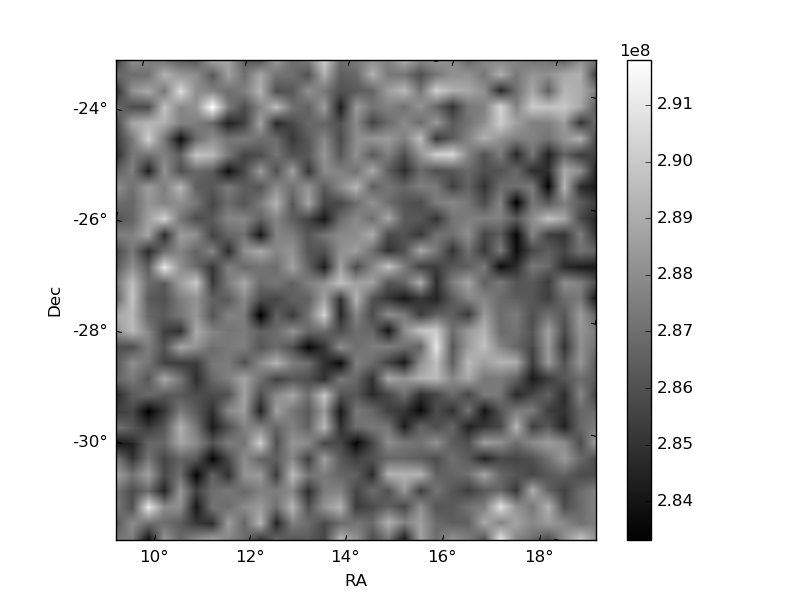
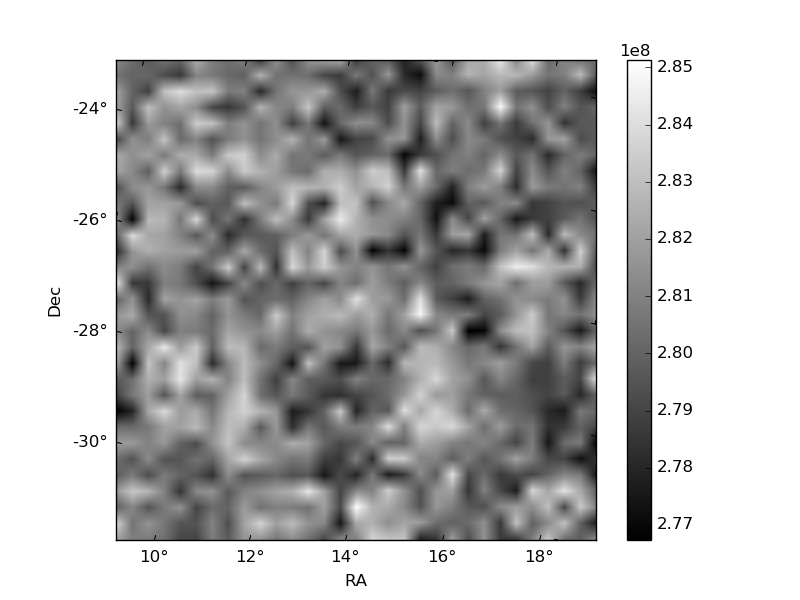
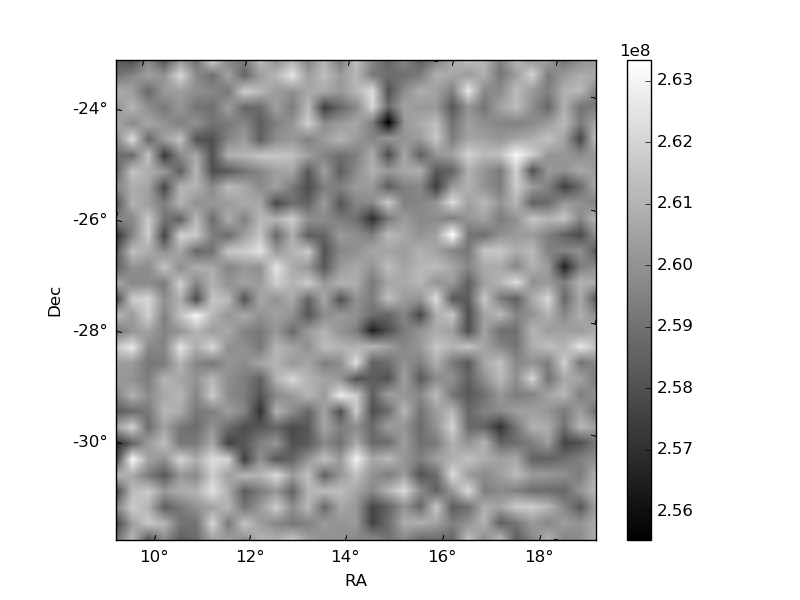
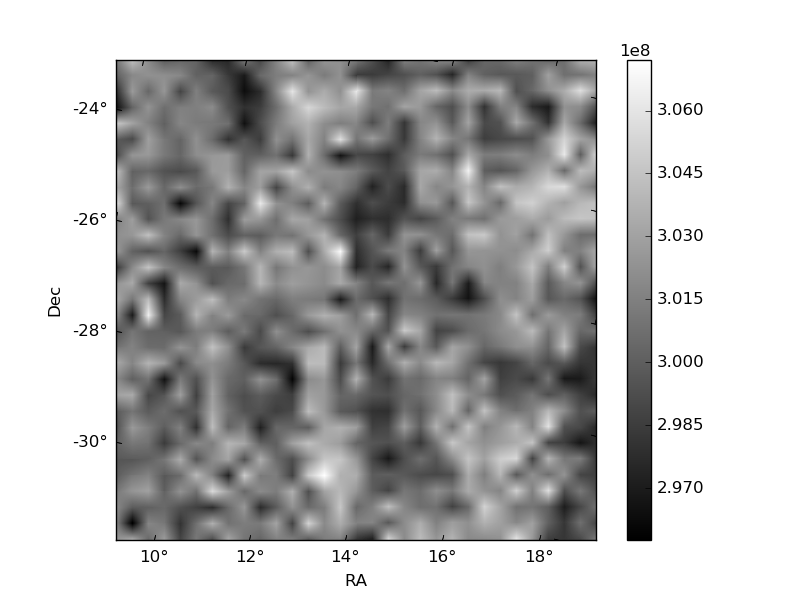
Histogram calculated using DETX and DETY for each event in the final _common_clean file
| Quadrant A | 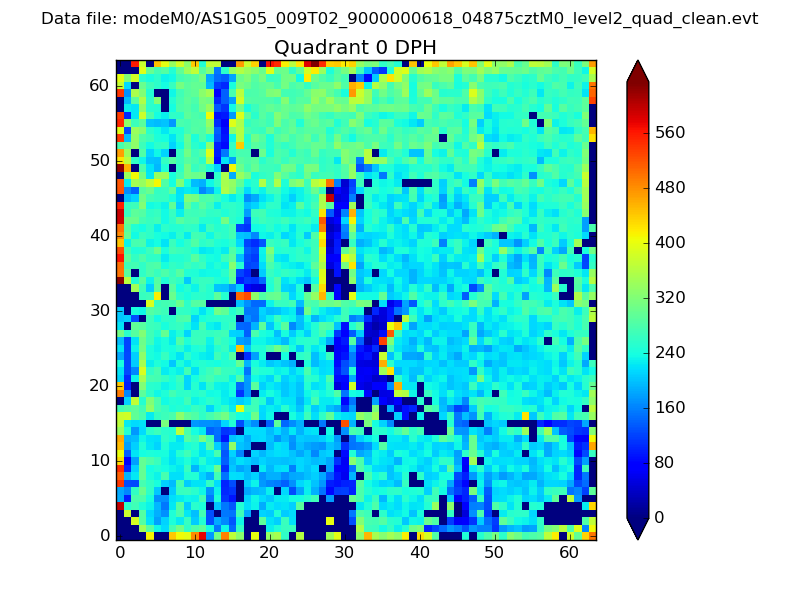 |
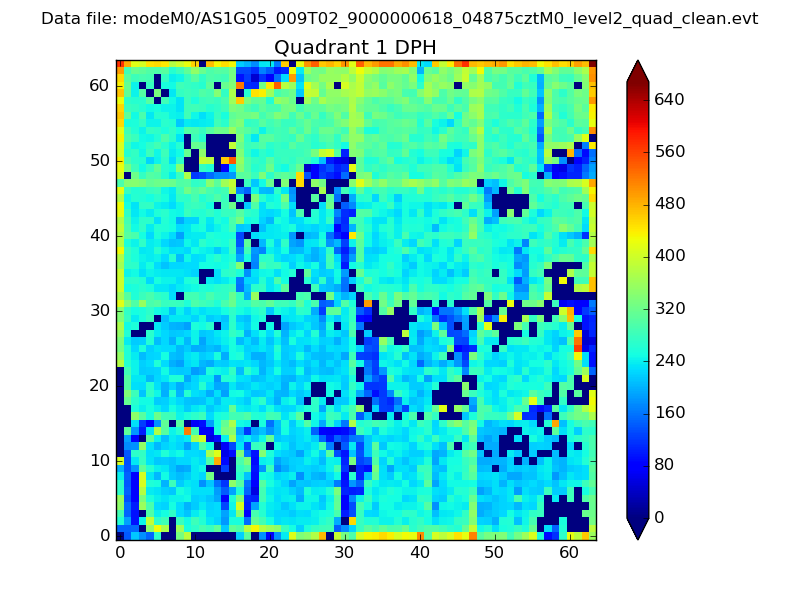 |
Quadrant B |
|---|---|---|---|
| Quadrant D | 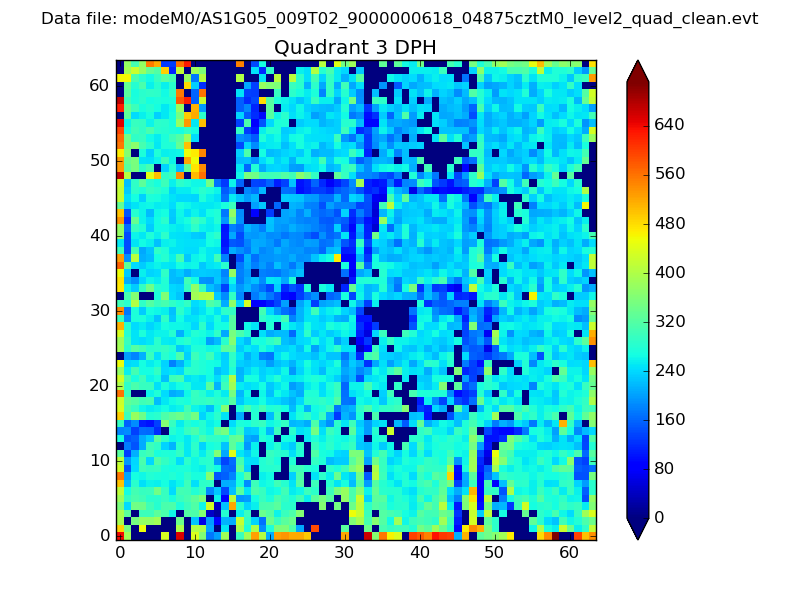 |
 |
Quadrant C |
| Plot type | Count rate plots | Images |
|---|---|---|
| Comparison with Poisson distribution Blue bars denote a histogram of data divided into 1 sec bins. Red curve is a Poisson curve with rate = median count rate of data. |
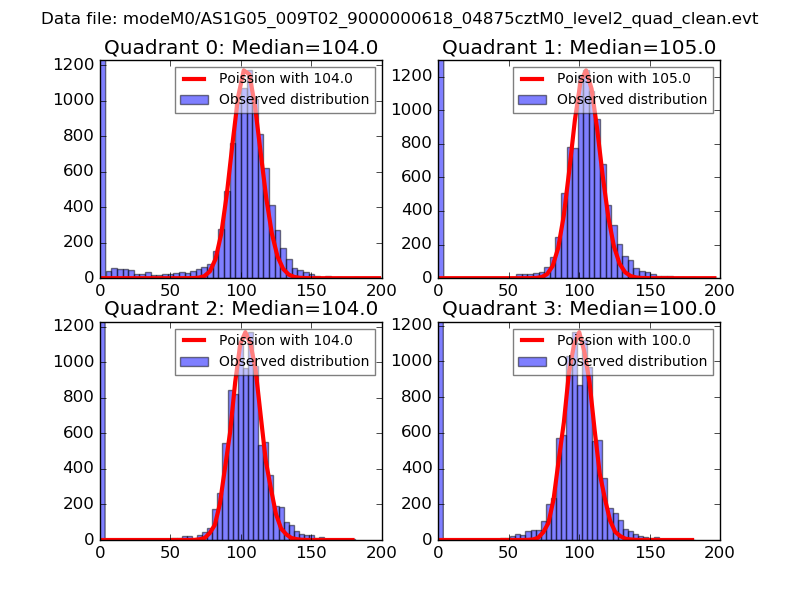 |
 |
| Quadrant-wise count rates Data is divided into 100 sec bins |
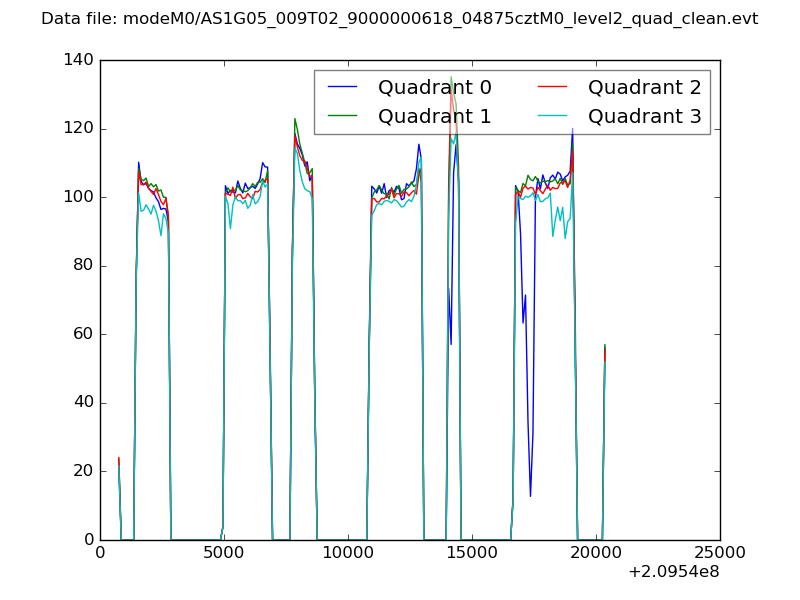 |
|
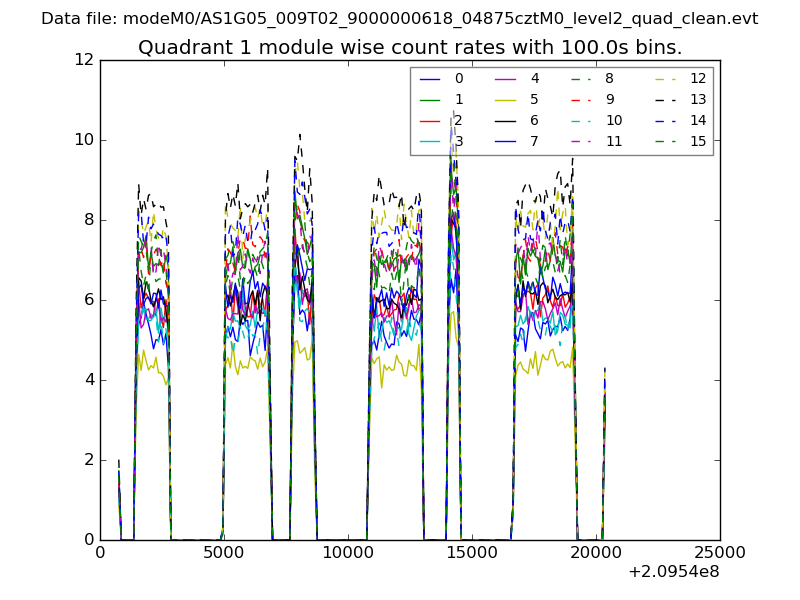
| Module-wise count rates for Quadrant A Data is divided into 100 sec bins |
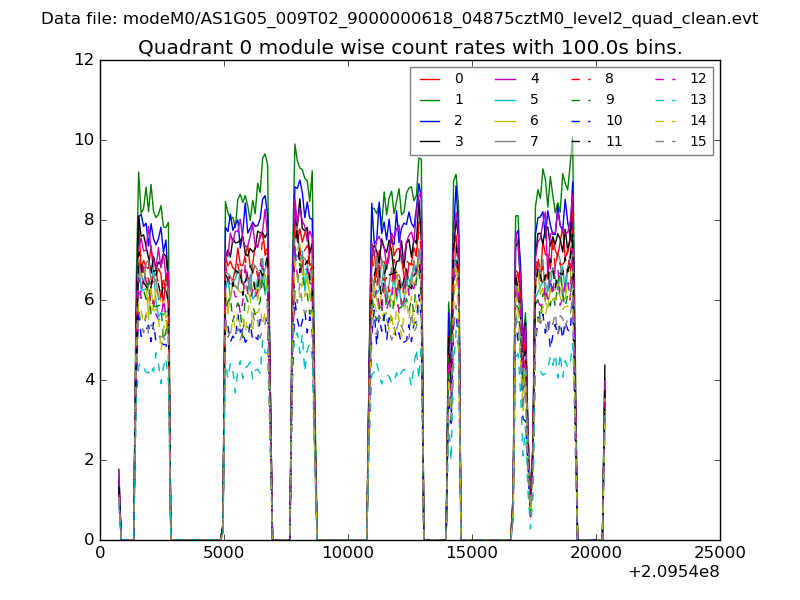 |
 |
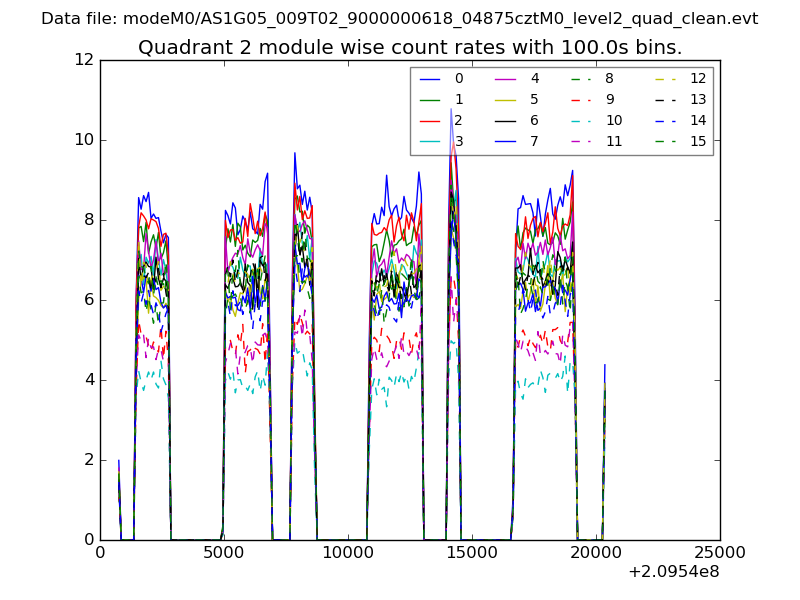
| Module-wise count rates for Quadrant B Data is divided into 100 sec bins |
 |
 |
| Module-wise count rates for Quadrant C Data is divided into 100 sec bins |
 |
 |
| Module-wise count rates for Quadrant D Data is divided into 100 sec bins |
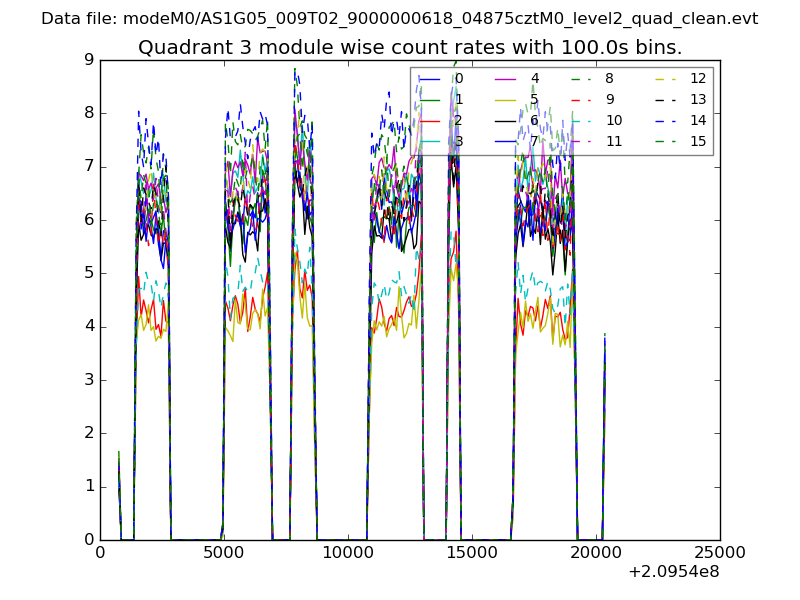 |
 |
| Parameter | Plot |
|---|---|
| CZT HV Monitor | 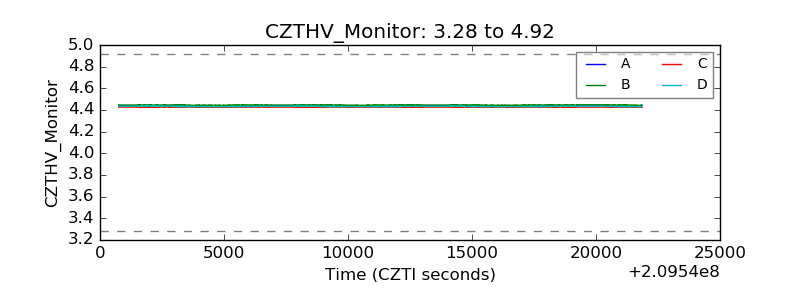 |
| D_VDD | 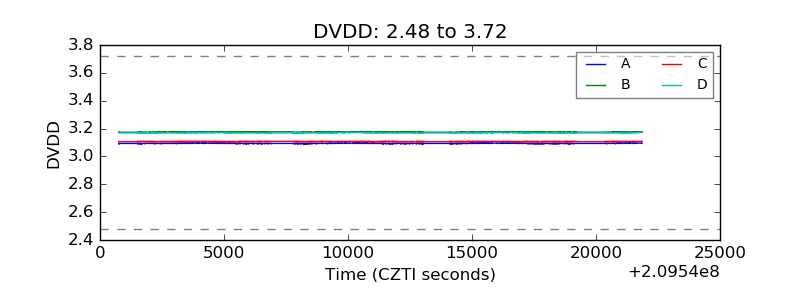 |
| Temperature 1 | 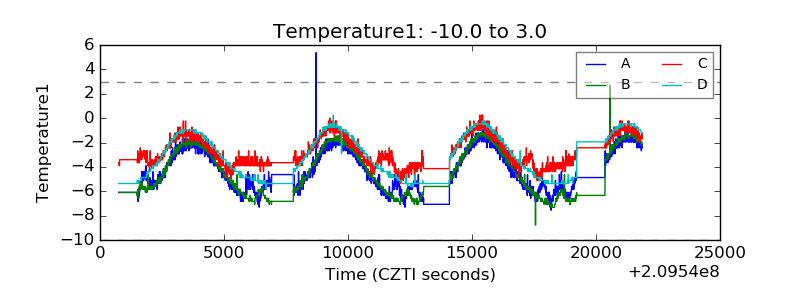 |
| Veto HV Monitor | 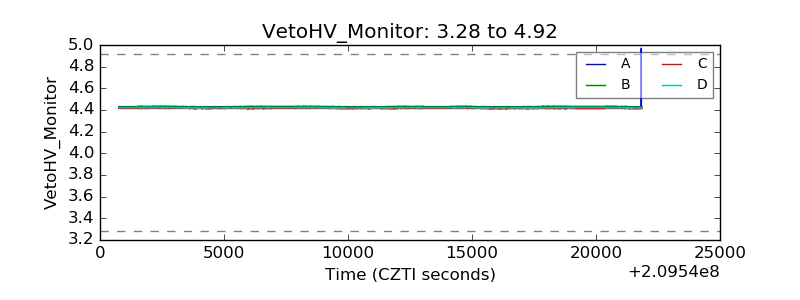 |
| Veto LLD | 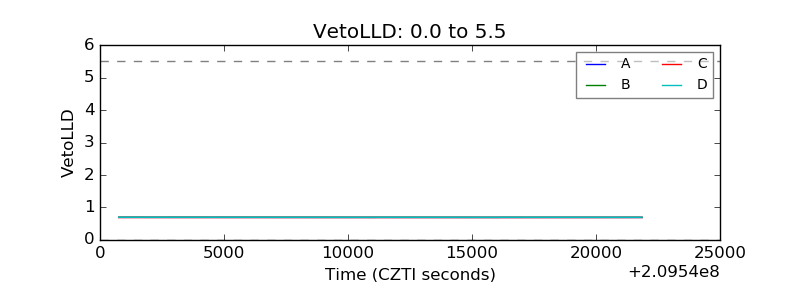 |
| Alpha Counter |  |
| _CPM_Rate | 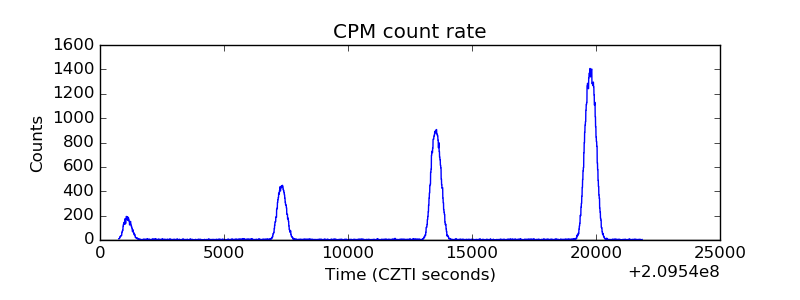 |
| CZT Counter | 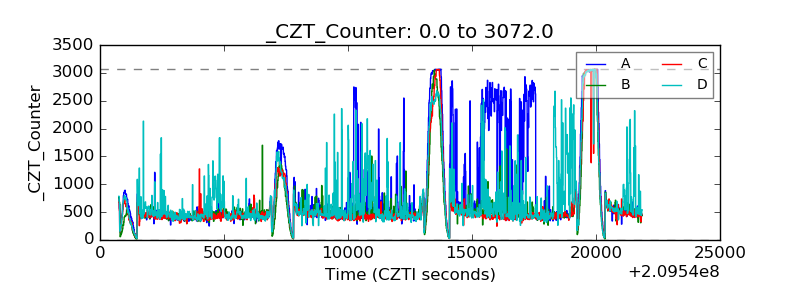 |
| +2.5 Volts monitor |  |
| +5 Volts monitor |  |
| _ROLL_ROT | 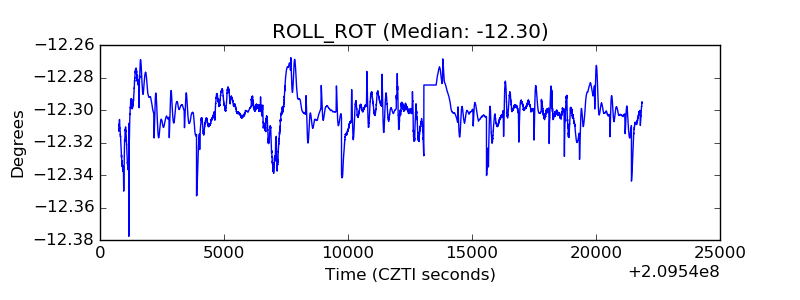 |
| _Roll_DEC | 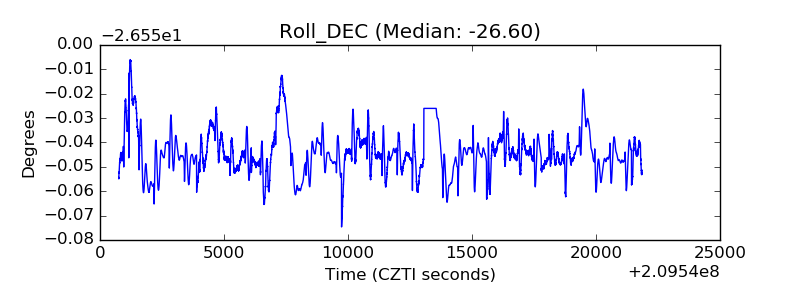 |
| _Roll_RA | 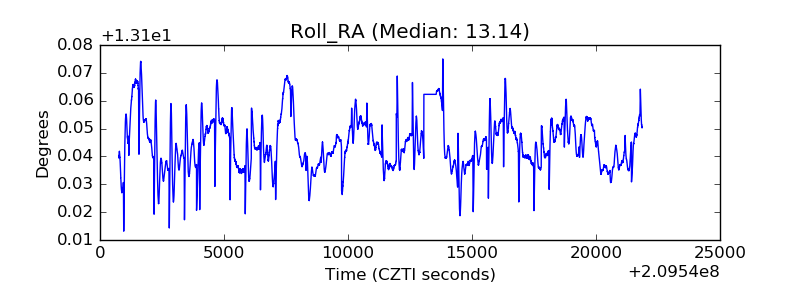 |
| Veto Counter | 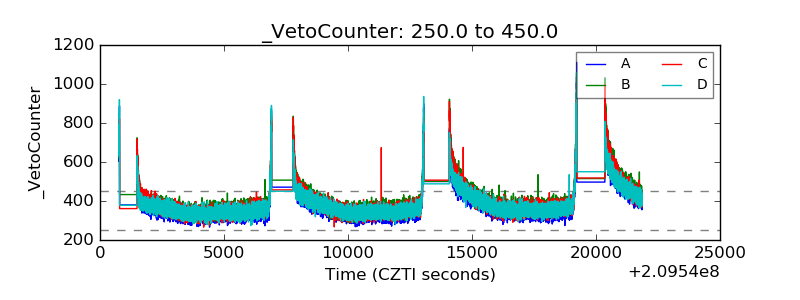 |