| Param | Original file | Final file |
|---|---|---|
| Filename | modeM0/AS1G05_009T02_9000000618_04876cztM0_level2.evt | modeM0/AS1G05_009T02_9000000618_04876cztM0_level2_quad_clean.evt |
| Size (bytes) | 529,629,120 | 54,492,480 |
| Size | 505.1 MB | 52.0 MB |
| Events in quadrant A | 3,598,131 | 308,835 |
| Events in quadrant B | 3,693,787 | 308,180 |
| Events in quadrant C | 3,136,621 | 302,534 |
| Events in quadrant D | 5,166,146 | 272,343 |
| Mode SS | |||
|---|---|---|---|
| Quadrant | BADHDUFLAG | Total packets | Discarded packets |
| A | 0 | 134 | 0 |
| B | 0 | 134 | 0 |
| C | 0 | 134 | 0 |
| D | 0 | 134 | 0 |
| Mode M0 | |||
|---|---|---|---|
| Quadrant | BADHDUFLAG | Total packets | Discarded packets |
| A | 0 | 15008 | 3 |
| B | 0 | 15303 | 2 |
| C | 0 | 13683 | 2 |
| D | 0 | 19748 | 2 |
| Mode M9 | |||
|---|---|---|---|
| Quadrant | BADHDUFLAG | Total packets | Discarded packets |
| A | 0 | 21 | 0 |
| B | 0 | 21 | 0 |
| C | 0 | 21 | 0 |
| D | 0 | 22 | 0 |
| Quadrant | Total seconds | Saturated seconds | Saturation percentage |
|---|---|---|---|
| A | 6557 | 195 | 2.973921% |
| B | 6557 | 139 | 2.119872% |
| C | 6557 | 75 | 1.143816% |
| D | 6557 | 662 | 10.096081% |
Noise dominated data is calculated using 1-second bins in cleaned event files. If a bin has >2000 counts, and if more than 50% of those come from <1% of pixels, then it is considered to be noise-dominated and hence unusable.
| Quadrant | # 1 sec bins | Bins with >0 counts | Bins with >2000 counts | High rate bins dominated by noise | Noise dominated (total time) | Noise dominated (detector-on time) | Marked lightcurve |
|---|---|---|---|---|---|---|---|
| A | 7757 | 6557 | 58 | 58 | 0.75% | 0.88% | 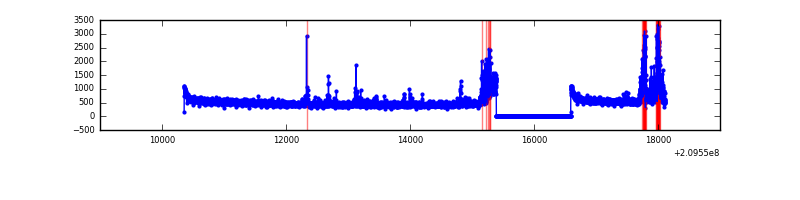 |
| B | 7757 | 6557 | 12 | 12 | 0.15% | 0.18% | 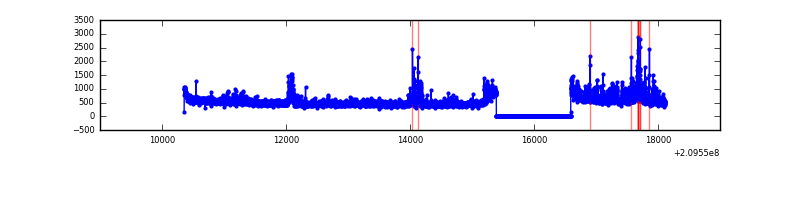 |
| C | 7757 | 6557 | 0 | 0 | 0.00% | 0.00% | 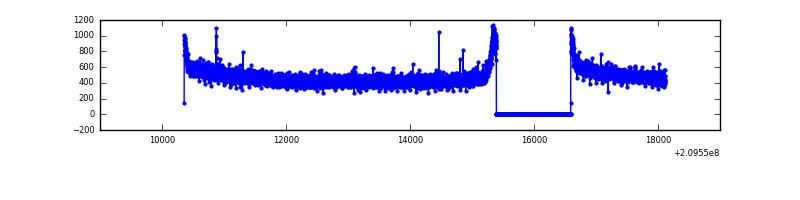 |
| D | 7757 | 6557 | 506 | 506 | 6.52% | 7.72% | 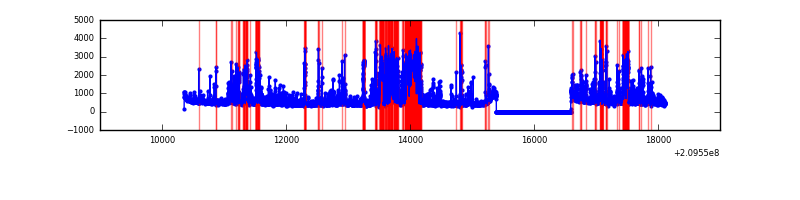 |
Top three noisy pixels from each quadrant. If the there are fewer than three noisy pixels in the level2.evt file, extra rows are filled as -1
| Pixel properties | Quadrant properties | ||||||
|---|---|---|---|---|---|---|---|
| Quadrant | DetID | PixID | Counts | Sigma | Mean | Median | Sigma |
| A | 13 | 251 | 388280 | 2310.65 | 827 | 809 | 167.7 |
| A | 8 | 15 | 15071 | 85.05 | 827 | 809 | 167.7 |
| A | 0 | 50 | 9363 | 51.01 | 827 | 809 | 167.7 |
| B | 4 | 80 | 127111 | 796.64 | 835 | 817 | 158.5 |
| B | 15 | 204 | 103138 | 645.42 | 835 | 817 | 158.5 |
| B | 10 | 16 | 86556 | 540.83 | 835 | 817 | 158.5 |
| C | 12 | 4 | 7357 | 35.72 | 801 | 805 | 183.4 |
| C | 13 | 61 | 6734 | 32.32 | 801 | 805 | 183.4 |
| C | 14 | 67 | 2549 | 9.51 | 801 | 805 | 183.4 |
| D | 13 | 235 | 1206554 | 6320.18 | 779 | 756 | 190.8 |
| D | 2 | 136 | 486189 | 2544.39 | 779 | 756 | 190.8 |
| D | 2 | 234 | 239180 | 1249.7 | 779 | 756 | 190.8 |
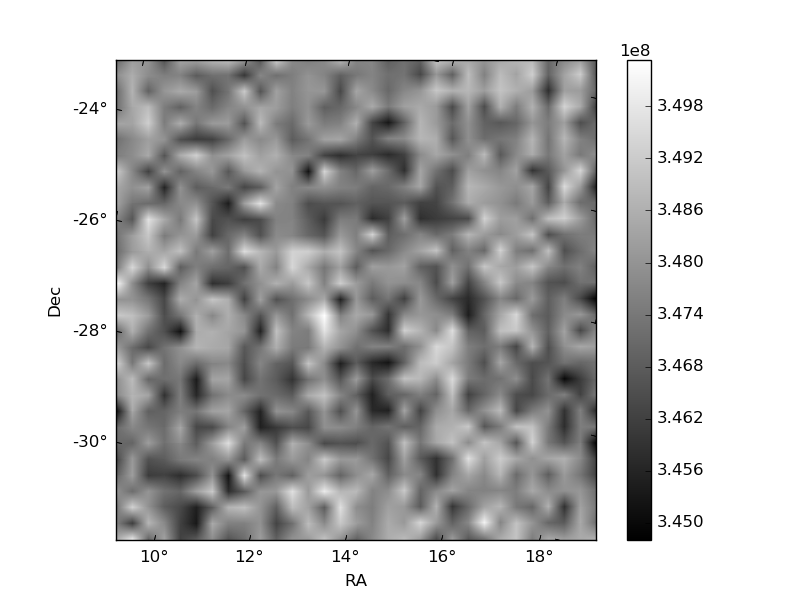
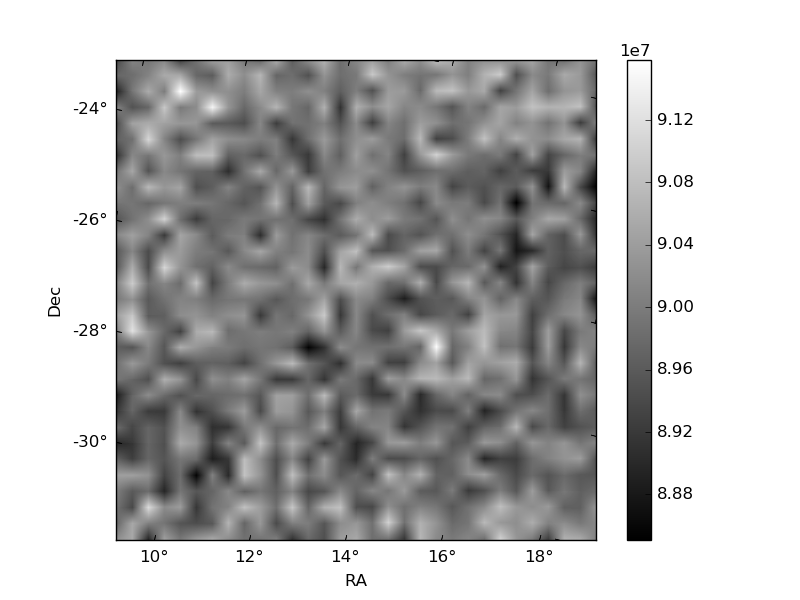
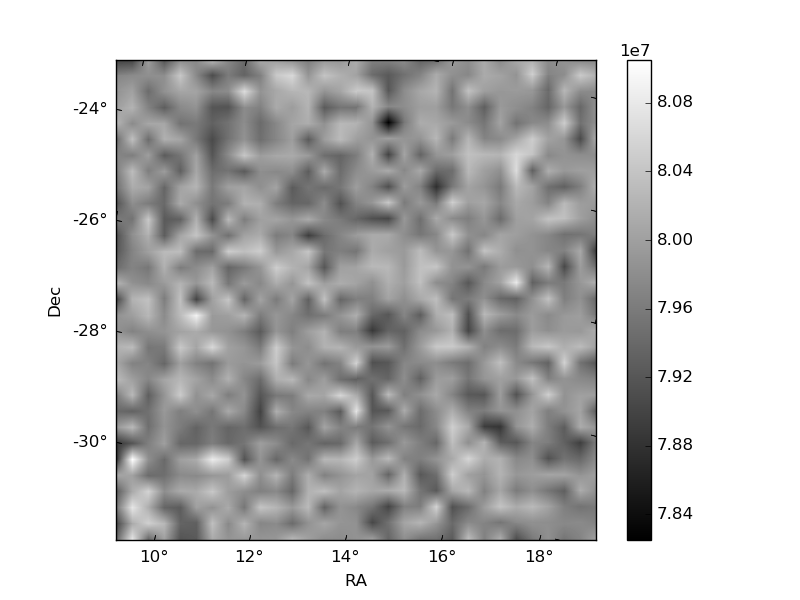
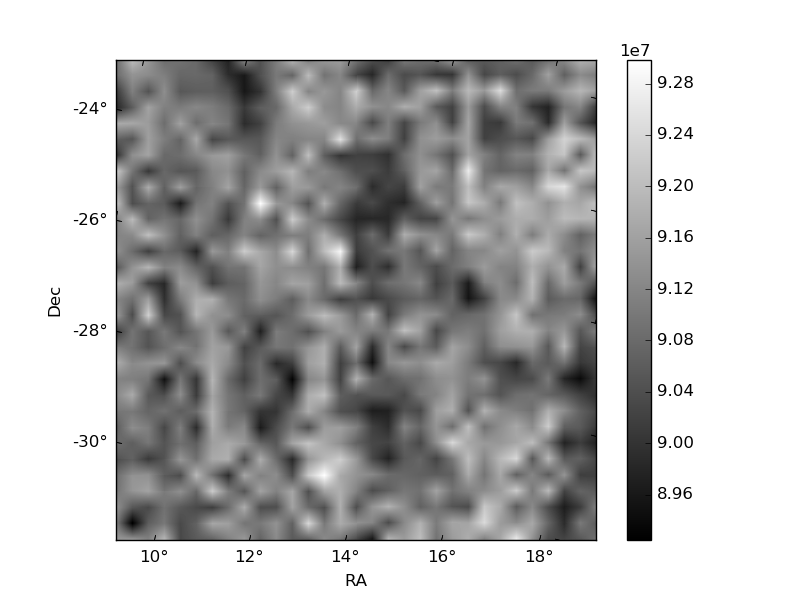
Histogram calculated using DETX and DETY for each event in the final _common_clean file
| Quadrant A | 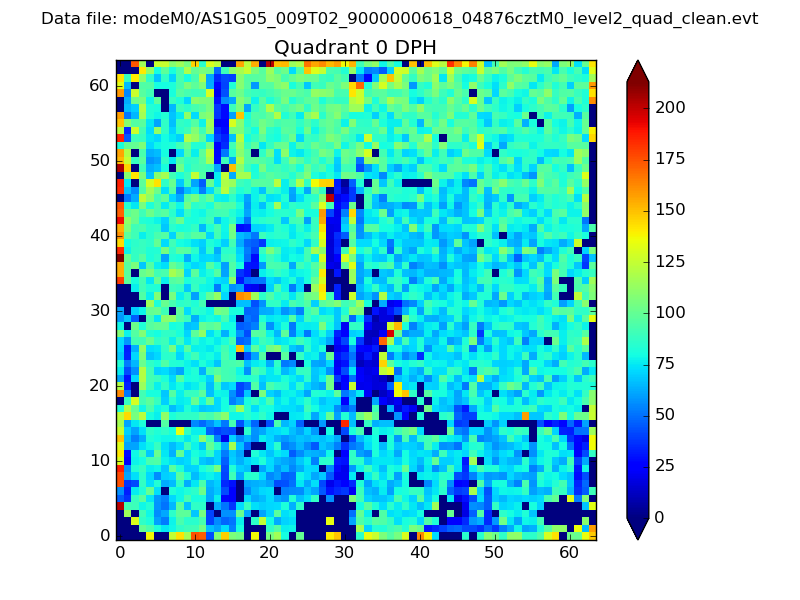 |
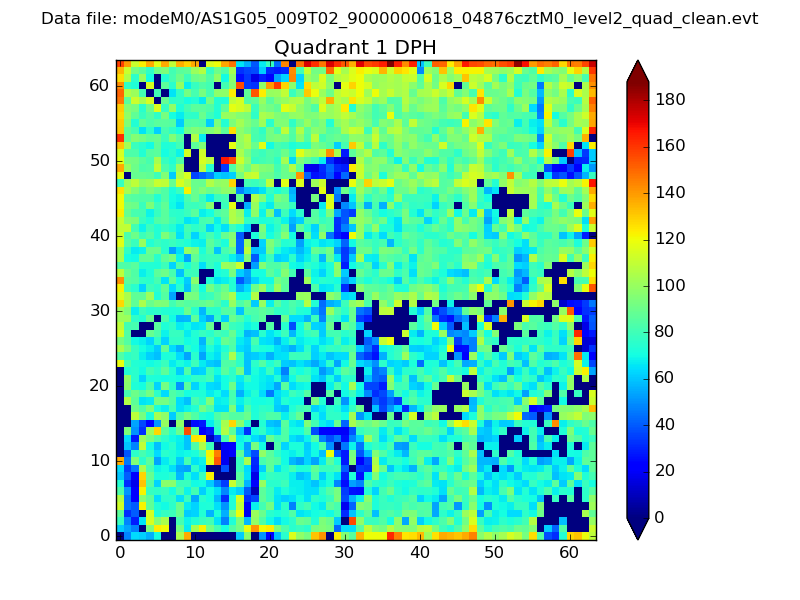 |
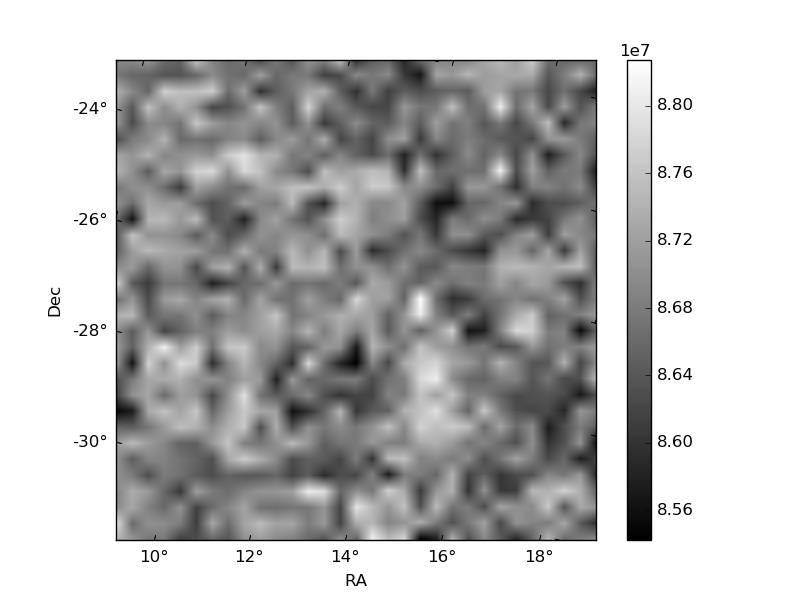
Quadrant B |
|---|---|---|---|
| Quadrant D | 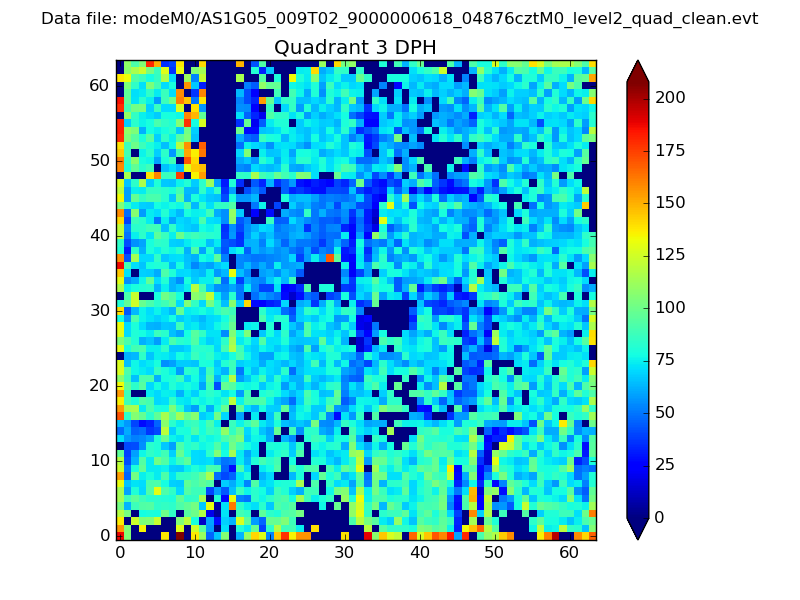 |
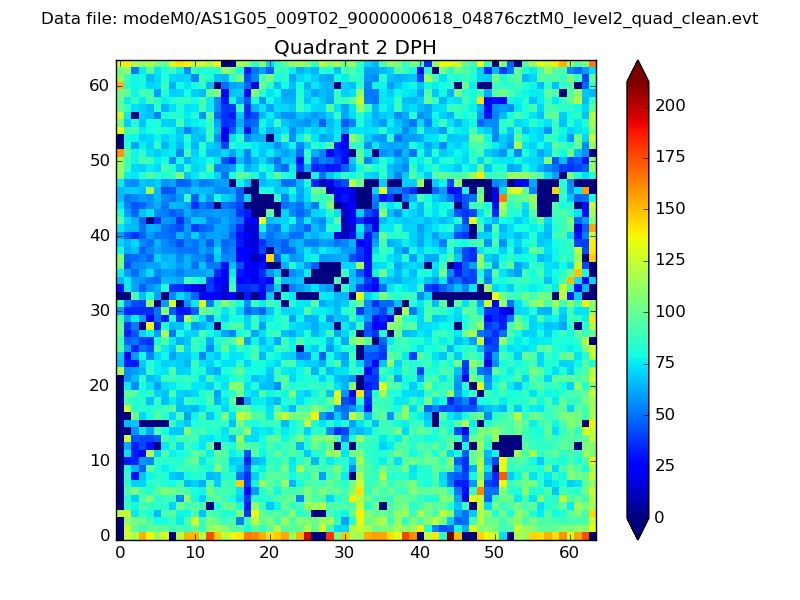 |
Quadrant C |
| Plot type | Count rate plots | Images |
|---|---|---|
| Comparison with Poisson distribution Blue bars denote a histogram of data divided into 1 sec bins. Red curve is a Poisson curve with rate = median count rate of data. |
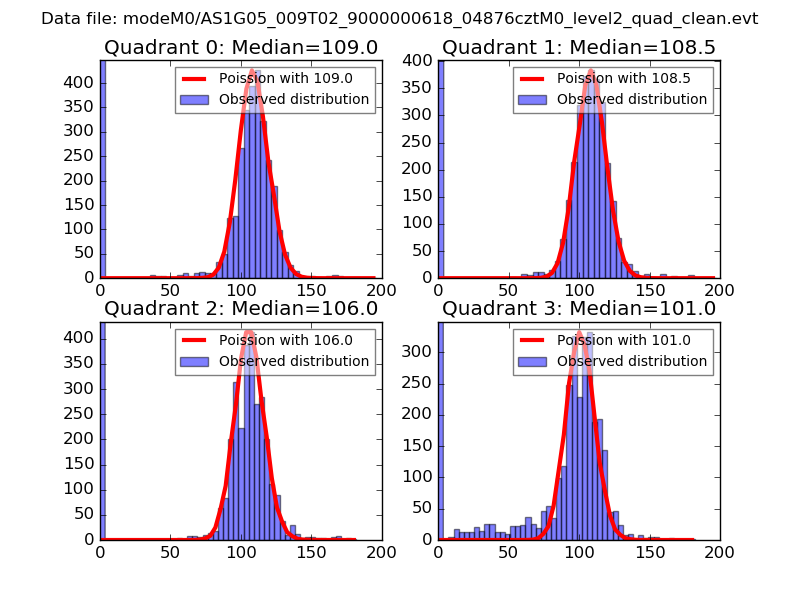 |
 |
| Quadrant-wise count rates Data is divided into 100 sec bins |
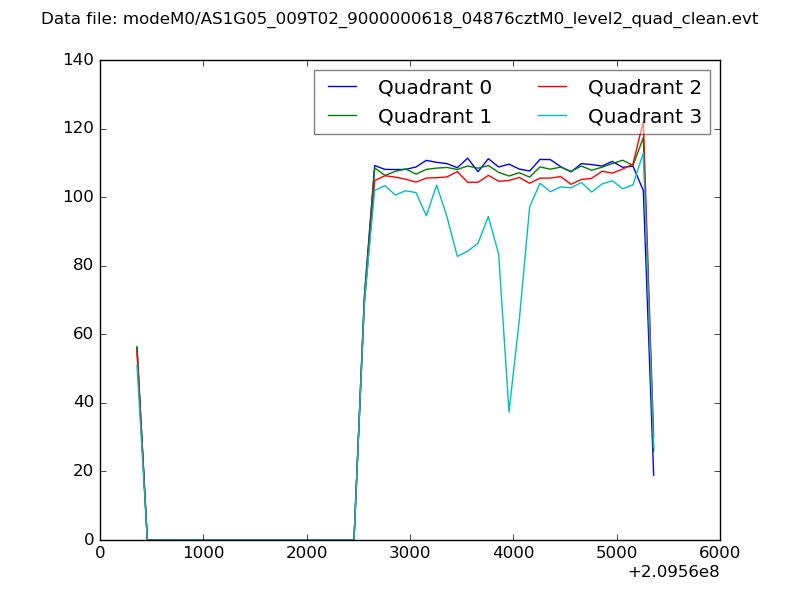 |
|
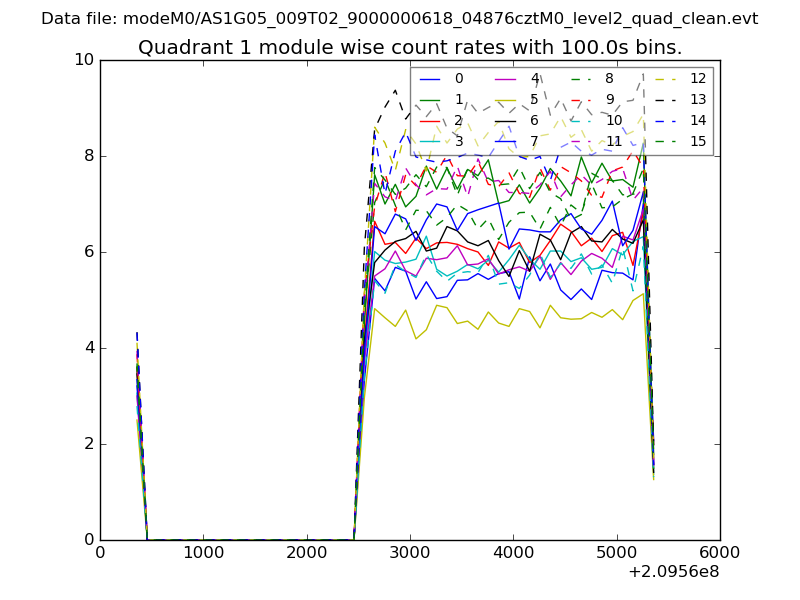
| Module-wise count rates for Quadrant A Data is divided into 100 sec bins |
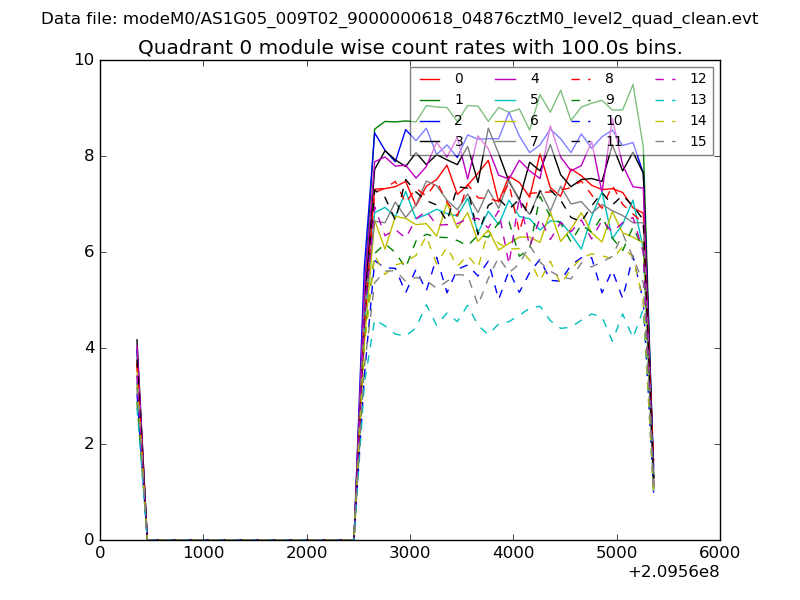 |
 |
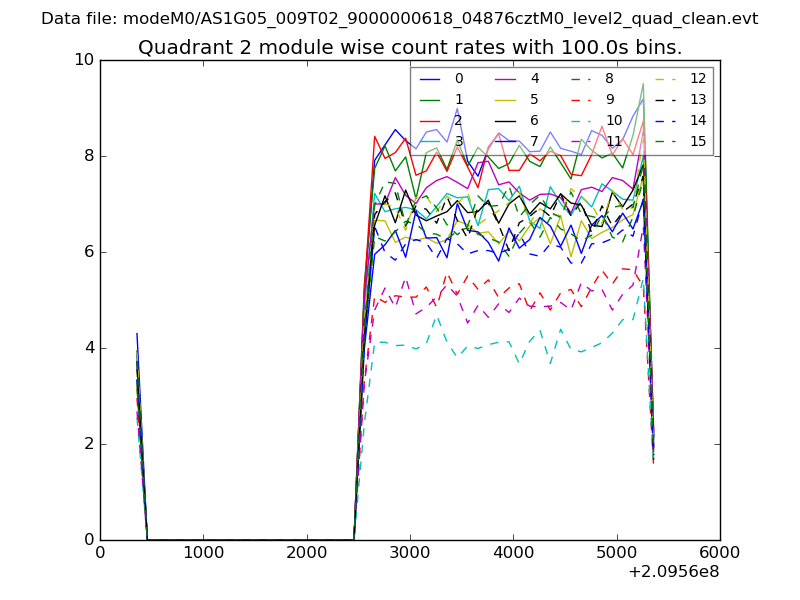
| Module-wise count rates for Quadrant B Data is divided into 100 sec bins |
 |
 |
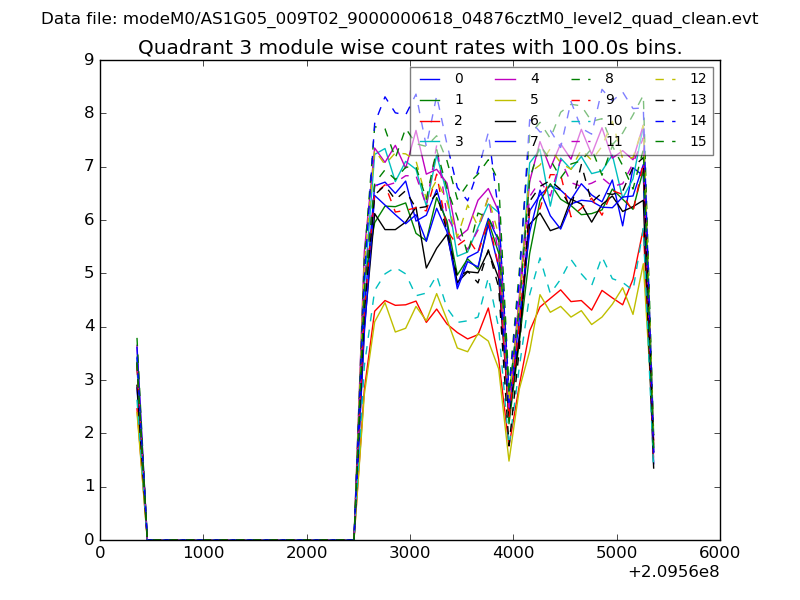
| Module-wise count rates for Quadrant C Data is divided into 100 sec bins |
 |
 |
| Module-wise count rates for Quadrant D Data is divided into 100 sec bins |
 |
 |
| Parameter | Plot |
|---|---|
| CZT HV Monitor | 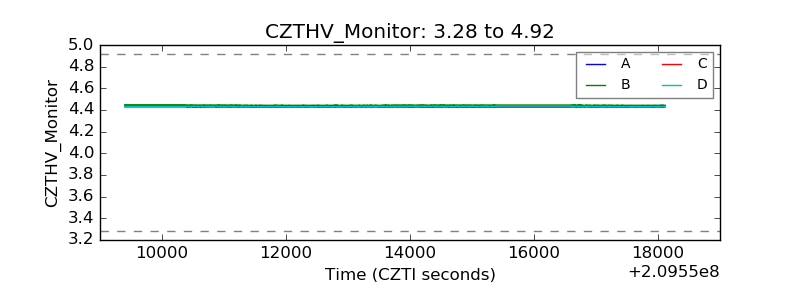 |
| D_VDD | 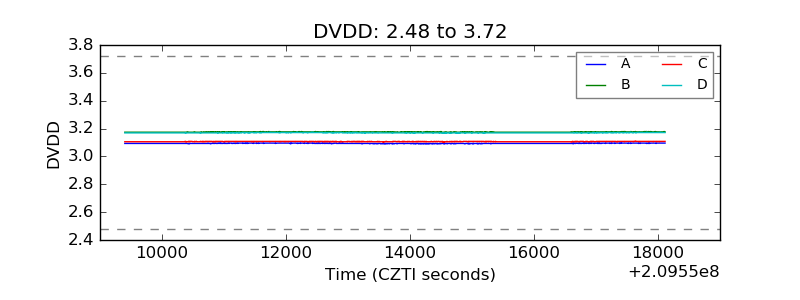 |
| Temperature 1 | 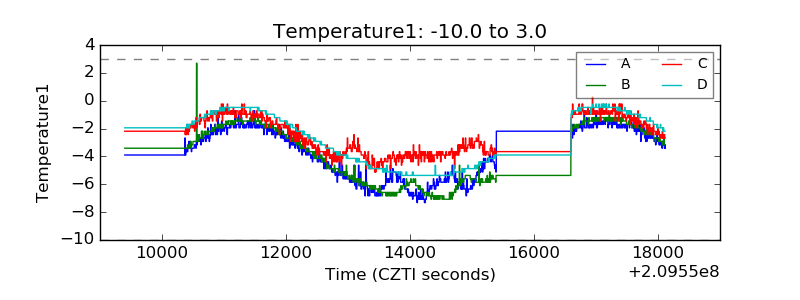 |
| Veto HV Monitor | 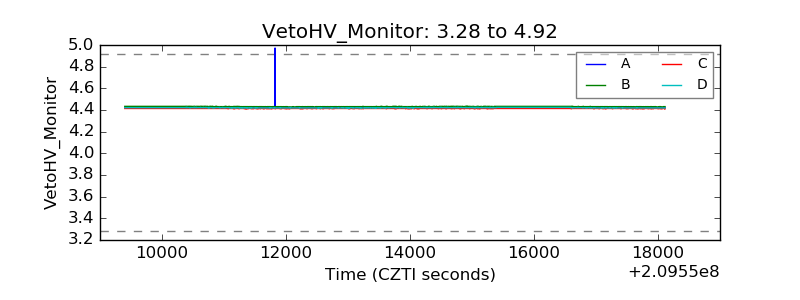 |
| Veto LLD | 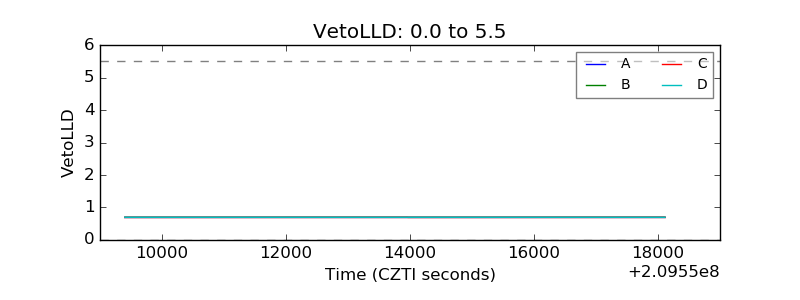 |
| Alpha Counter | 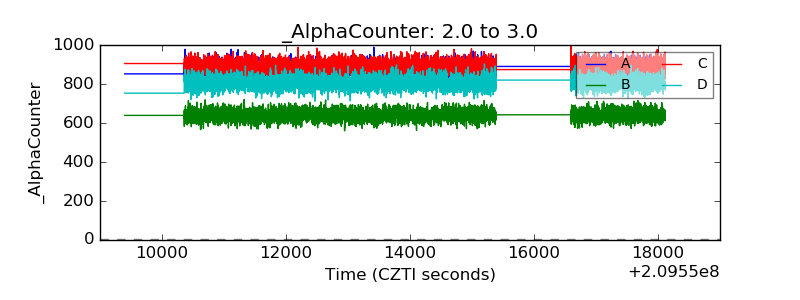 |
| _CPM_Rate | 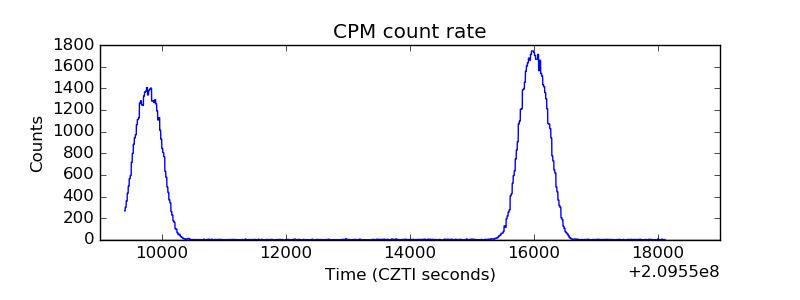 |
| CZT Counter | 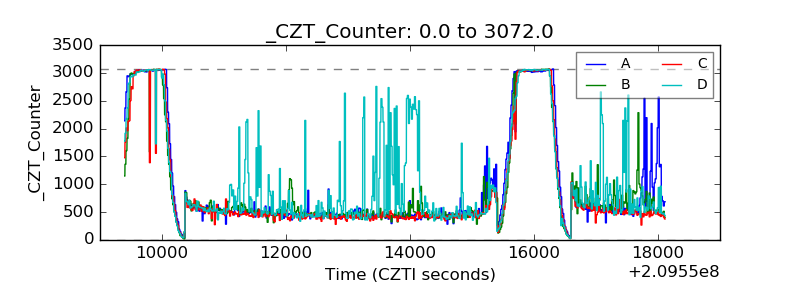 |
| +2.5 Volts monitor | 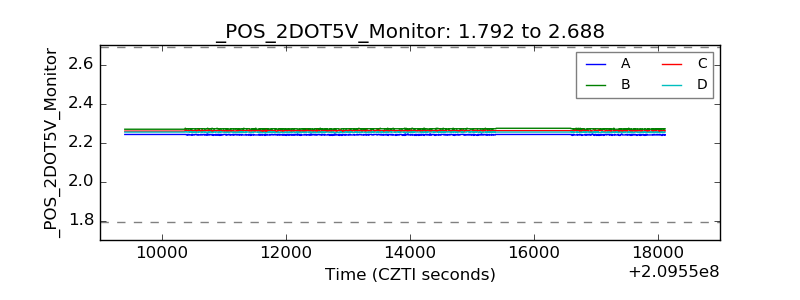 |
| +5 Volts monitor | 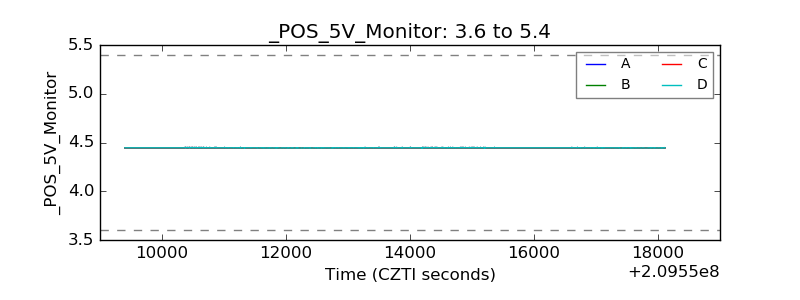 |
| _ROLL_ROT | 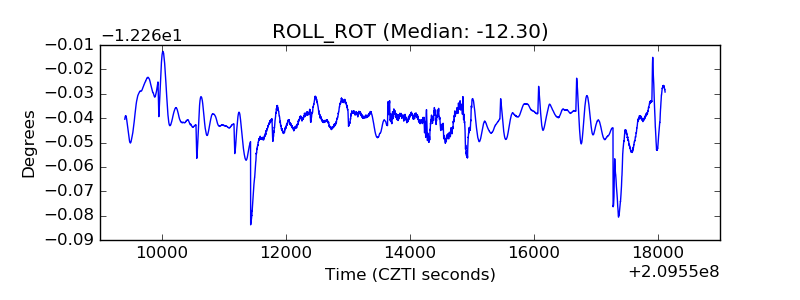 |
| _Roll_DEC | 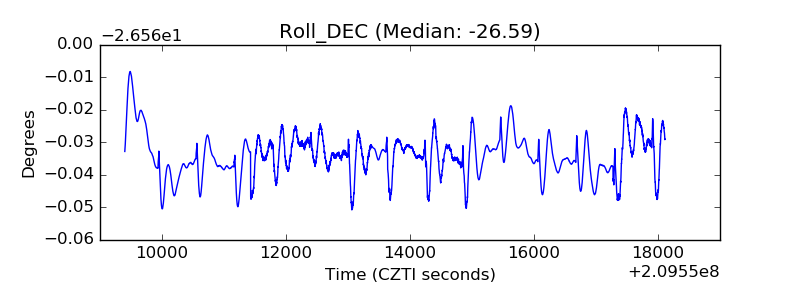 |
| _Roll_RA | 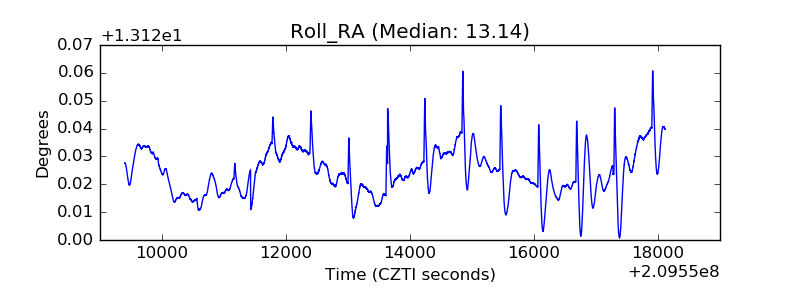 |
| Veto Counter | 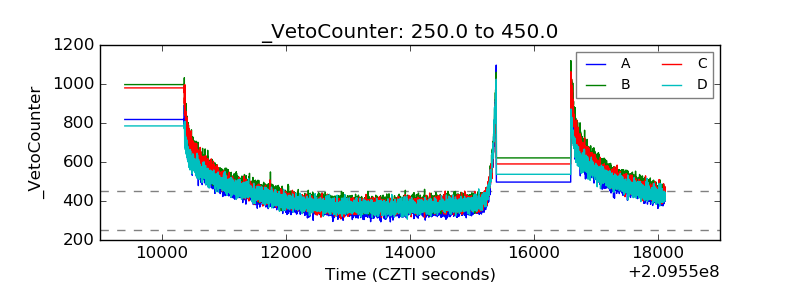 |