| Param | Original file | Final file |
|---|---|---|
| Filename | modeM0/AS1G05_009T02_9000000618_04877cztM0_level2.evt | modeM0/AS1G05_009T02_9000000618_04877cztM0_level2_quad_clean.evt |
| Size (bytes) | 249,730,560 | 24,474,240 |
| Size | 238.2 MB | 23.3 MB |
| Events in quadrant A | 1,873,541 | 133,946 |
| Events in quadrant B | 1,855,602 | 133,211 |
| Events in quadrant C | 1,444,550 | 129,992 |
| Events in quadrant D | 2,180,579 | 125,950 |
| Mode SS | |||
|---|---|---|---|
| Quadrant | BADHDUFLAG | Total packets | Discarded packets |
| A | 0 | 62 | 0 |
| B | 0 | 62 | 0 |
| C | 0 | 62 | 0 |
| D | 0 | 62 | 0 |
| Mode M0 | |||
|---|---|---|---|
| Quadrant | BADHDUFLAG | Total packets | Discarded packets |
| A | 0 | 7578 | 1 |
| B | 0 | 7561 | 1 |
| C | 0 | 6312 | 1 |
| D | 0 | 8548 | 1 |
| Mode M9 | |||
|---|---|---|---|
| Quadrant | BADHDUFLAG | Total packets | Discarded packets |
| A | 0 | 5 | 0 |
| B | 0 | 5 | 0 |
| C | 0 | 5 | 0 |
| D | 0 | 6 | 0 |
| Quadrant | Total seconds | Saturated seconds | Saturation percentage |
|---|---|---|---|
| A | 3047 | 81 | 2.658352% |
| B | 3047 | 44 | 1.444043% |
| C | 3047 | 9 | 0.295372% |
| D | 3047 | 161 | 5.283886% |
Noise dominated data is calculated using 1-second bins in cleaned event files. If a bin has >2000 counts, and if more than 50% of those come from <1% of pixels, then it is considered to be noise-dominated and hence unusable.
| Quadrant | # 1 sec bins | Bins with >0 counts | Bins with >2000 counts | High rate bins dominated by noise | Noise dominated (total time) | Noise dominated (detector-on time) | Marked lightcurve |
|---|---|---|---|---|---|---|---|
| A | 3047 | 3047 | 53 | 53 | 1.74% | 1.74% | 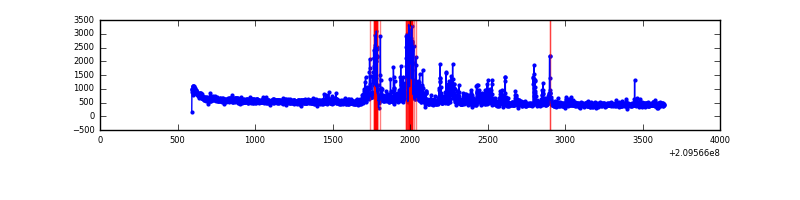 |
| B | 3047 | 3047 | 10 | 10 | 0.33% | 0.33% | 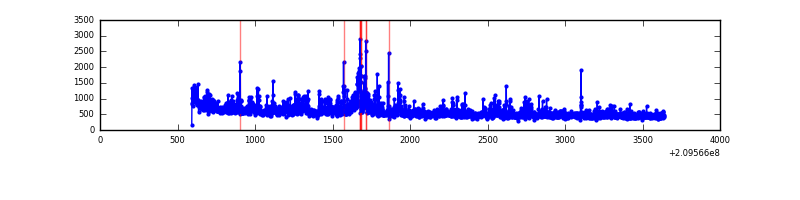 |
| C | 3047 | 3047 | 0 | 0 | 0.00% | 0.00% | 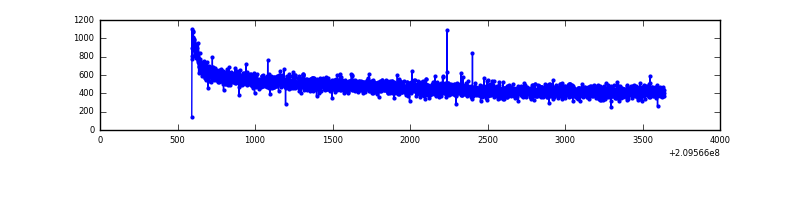 |
| D | 3047 | 3047 | 121 | 121 | 3.97% | 3.97% | 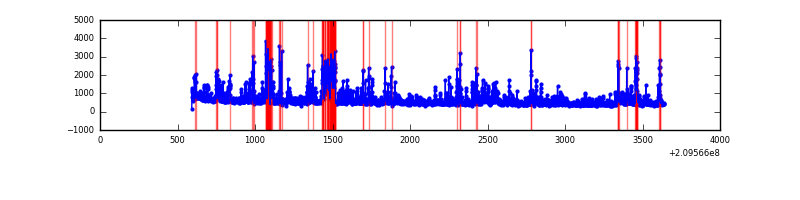 |
Top three noisy pixels from each quadrant. If the there are fewer than three noisy pixels in the level2.evt file, extra rows are filled as -1
| Pixel properties | Quadrant properties | ||||||
|---|---|---|---|---|---|---|---|
| Quadrant | DetID | PixID | Counts | Sigma | Mean | Median | Sigma |
| A | 13 | 251 | 378786 | 4811.21 | 384 | 377 | 78.7 |
| A | 8 | 15 | 6672 | 80.04 | 384 | 377 | 78.7 |
| A | 12 | 133 | 4335 | 50.32 | 384 | 377 | 78.7 |
| B | 4 | 80 | 182584 | 2467.01 | 389 | 382 | 73.9 |
| B | 4 | 239 | 69901 | 941.29 | 389 | 382 | 73.9 |
| B | 15 | 204 | 53951 | 725.32 | 389 | 382 | 73.9 |
| C | 13 | 61 | 3173 | 32.77 | 369 | 372 | 85.5 |
| C | 14 | 67 | 1695 | 15.48 | 369 | 372 | 85.5 |
| C | 8 | 222 | 1181 | 9.46 | 369 | 372 | 85.5 |
| D | 2 | 136 | 397329 | 4353.99 | 365 | 354 | 91.2 |
| D | 13 | 235 | 152189 | 1665.32 | 365 | 354 | 91.2 |
| D | 10 | 246 | 101274 | 1106.88 | 365 | 354 | 91.2 |
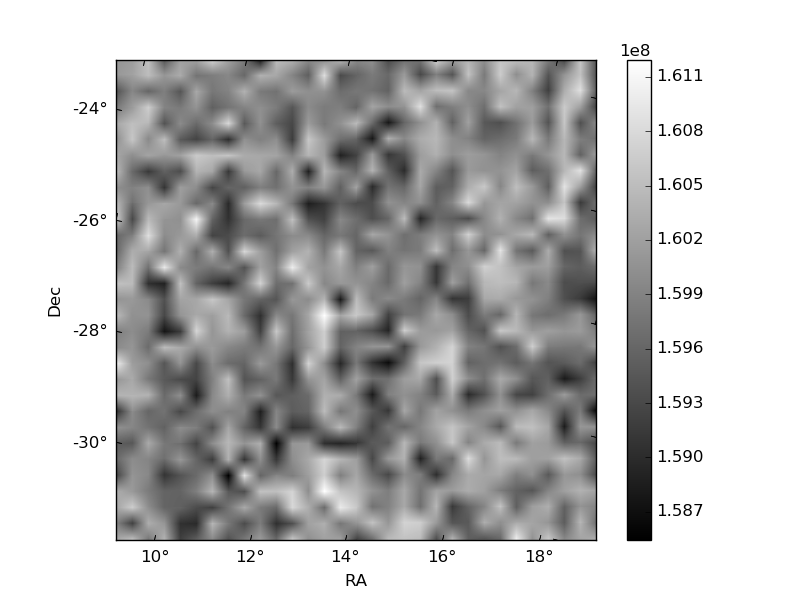
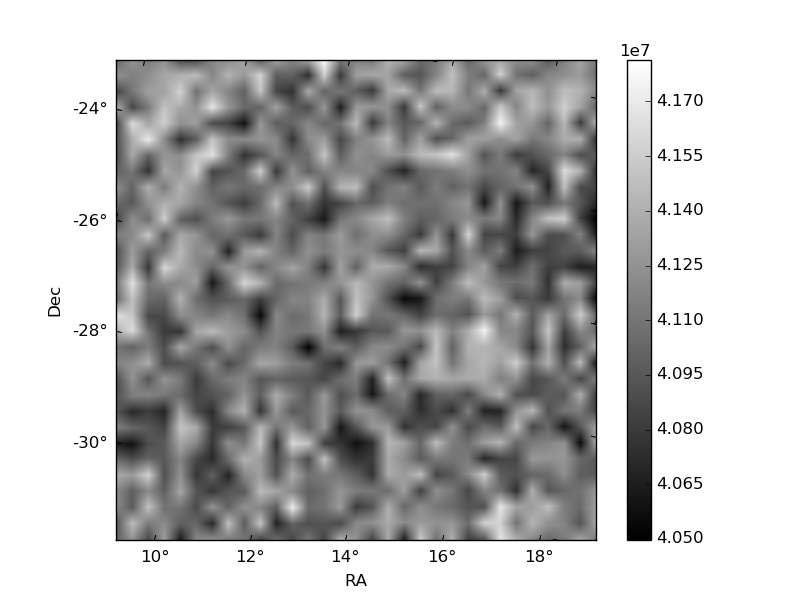
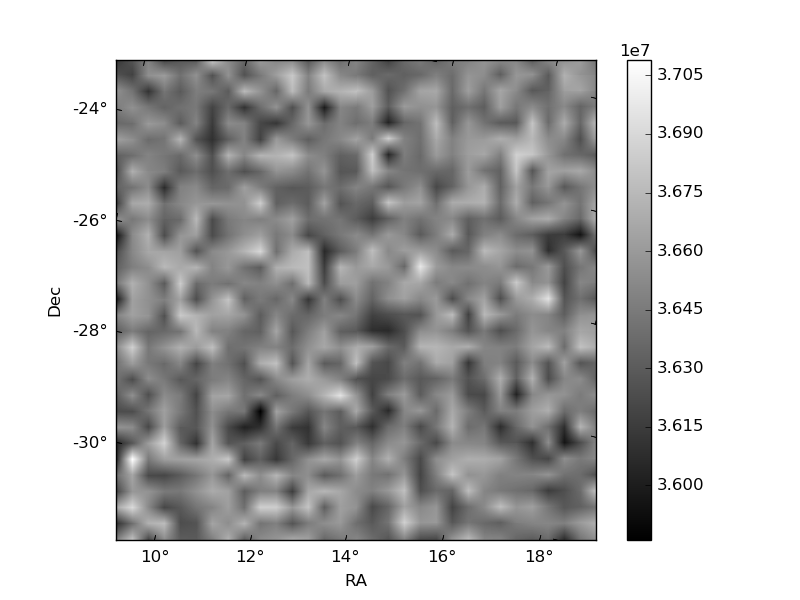
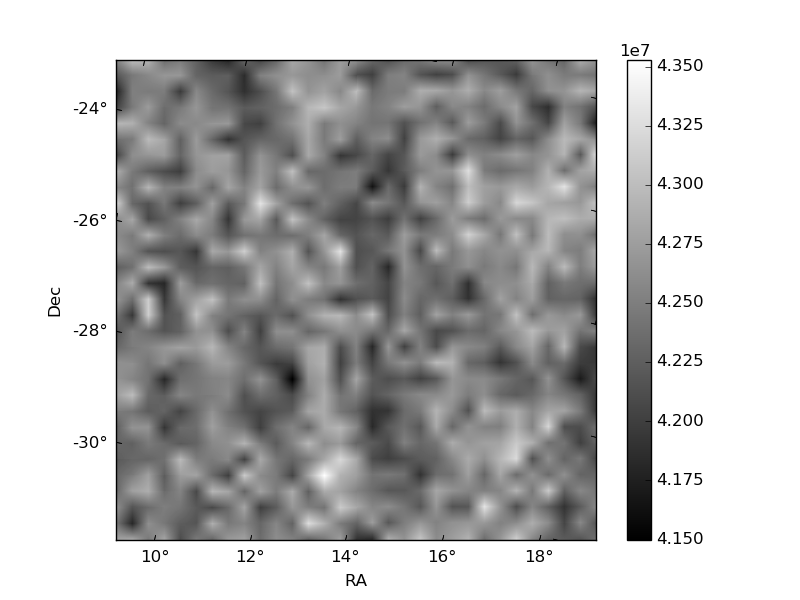
Histogram calculated using DETX and DETY for each event in the final _common_clean file
| Quadrant A | 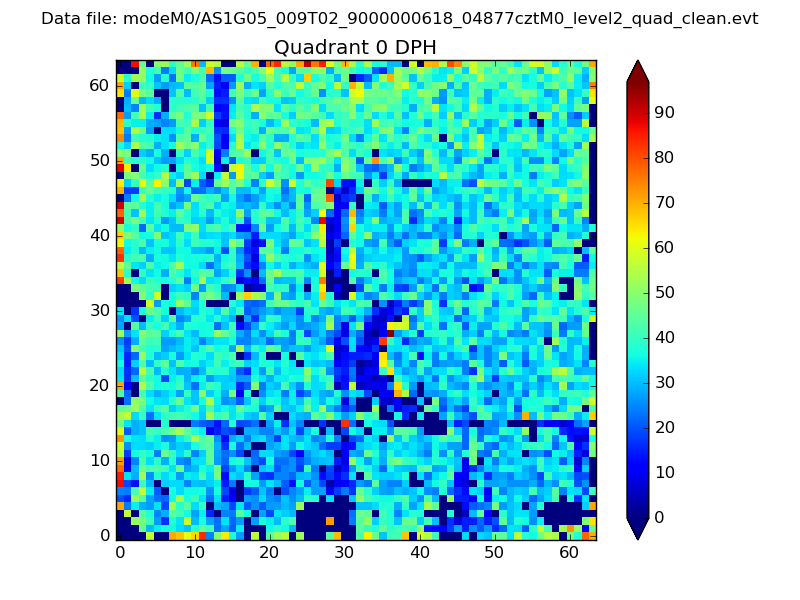 |
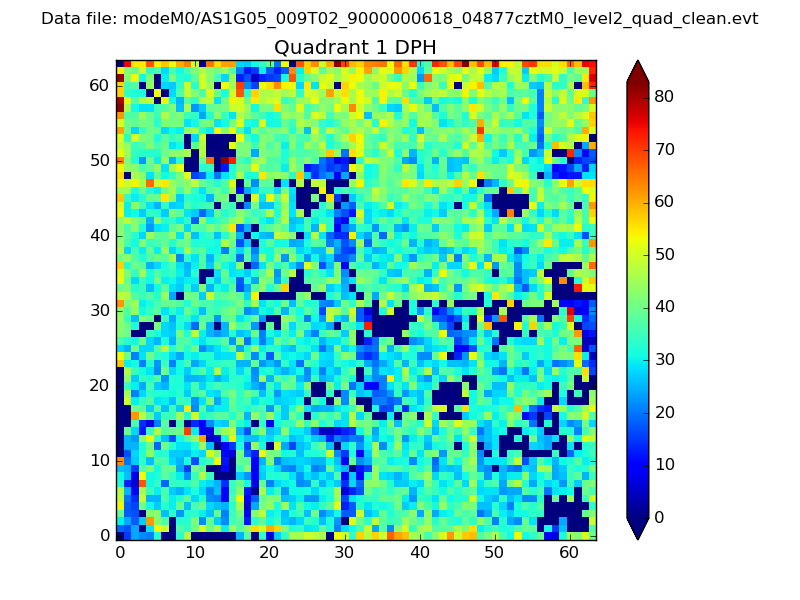 |
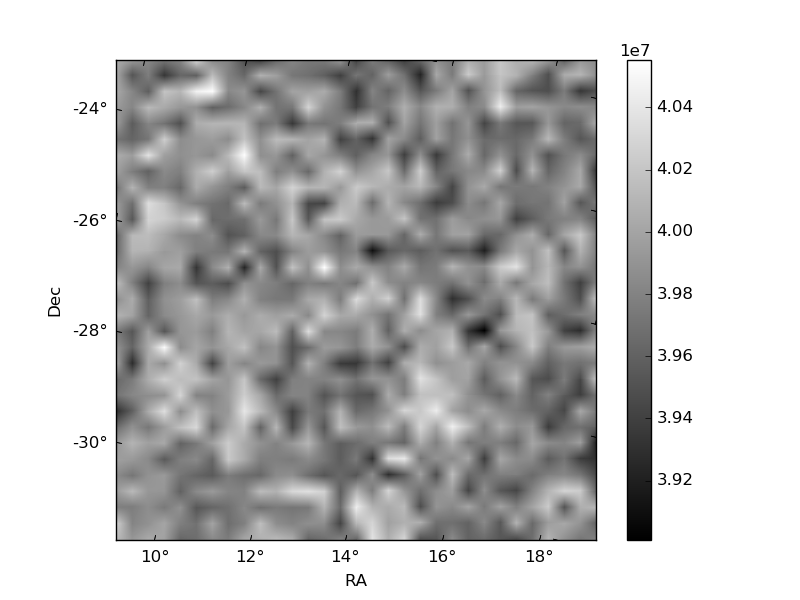
Quadrant B |
|---|---|---|---|
| Quadrant D | 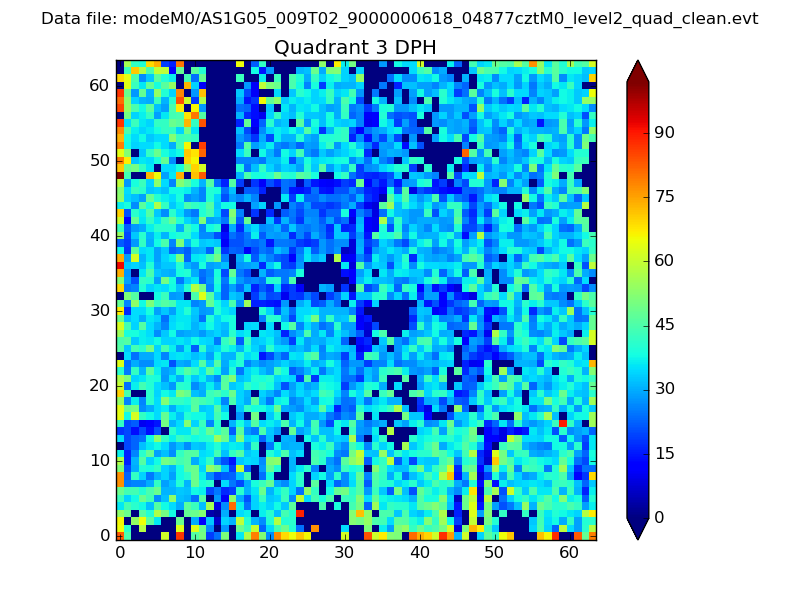 |
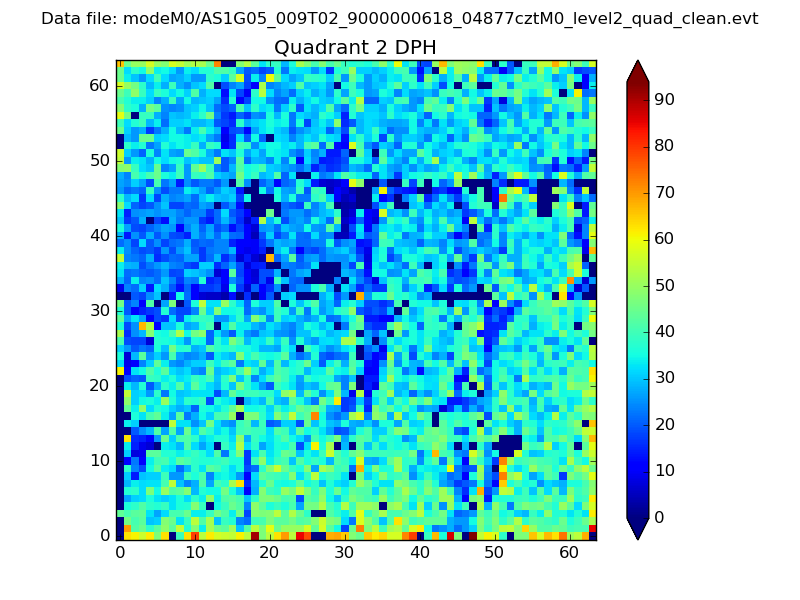 |
Quadrant C |
| Plot type | Count rate plots | Images |
|---|---|---|
| Comparison with Poisson distribution Blue bars denote a histogram of data divided into 1 sec bins. Red curve is a Poisson curve with rate = median count rate of data. |
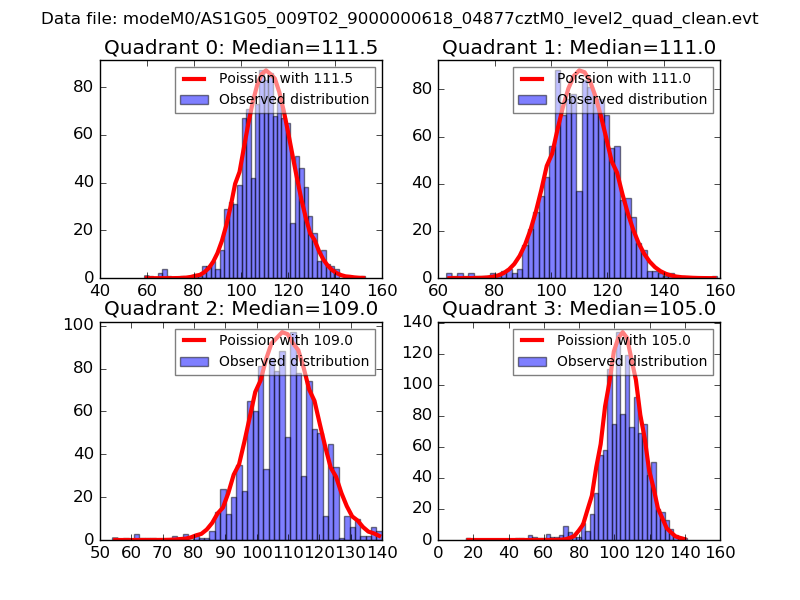 |
 |
| Quadrant-wise count rates Data is divided into 100 sec bins |
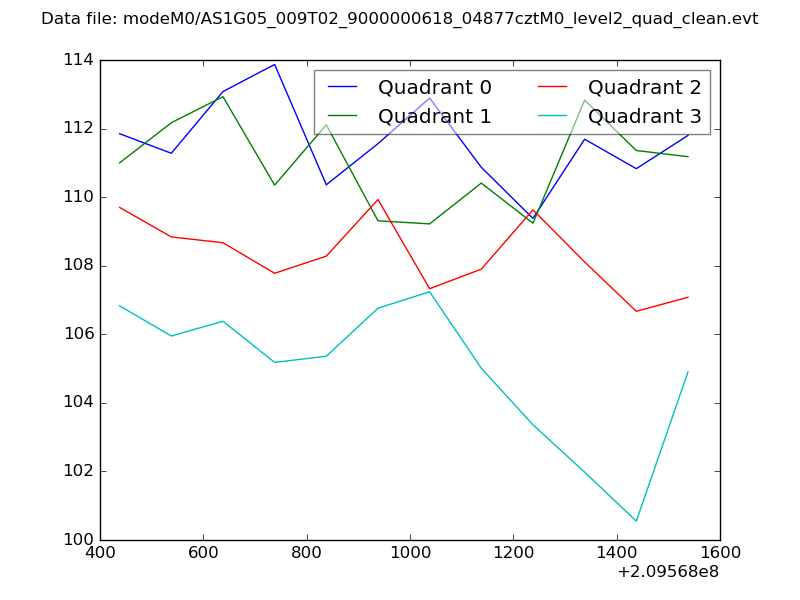 |
|
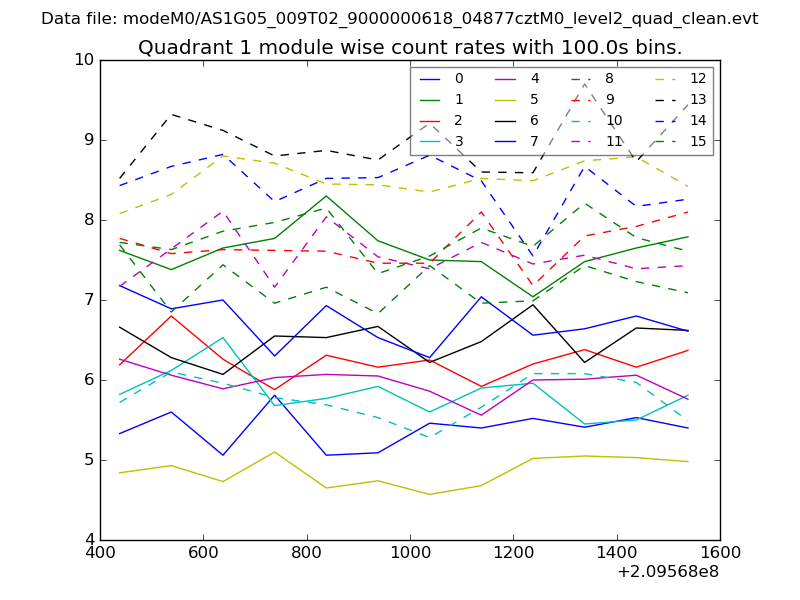
| Module-wise count rates for Quadrant A Data is divided into 100 sec bins |
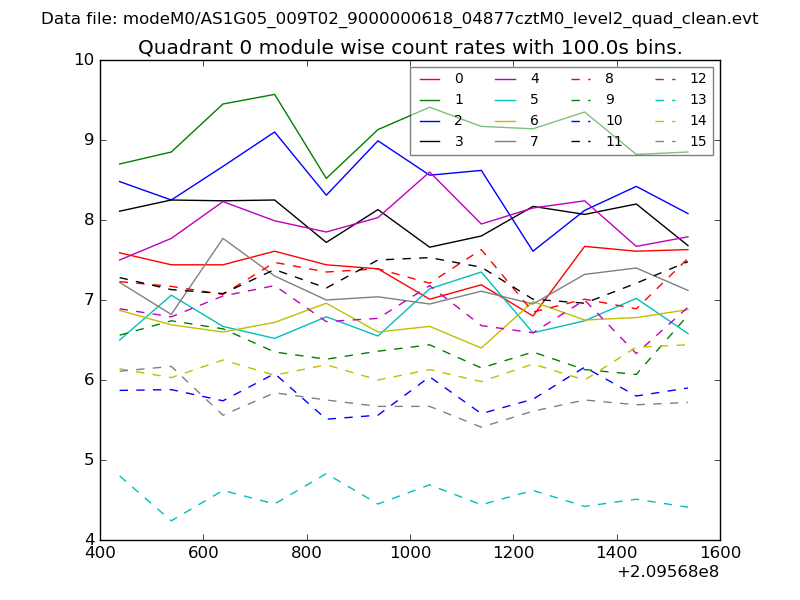 |
 |
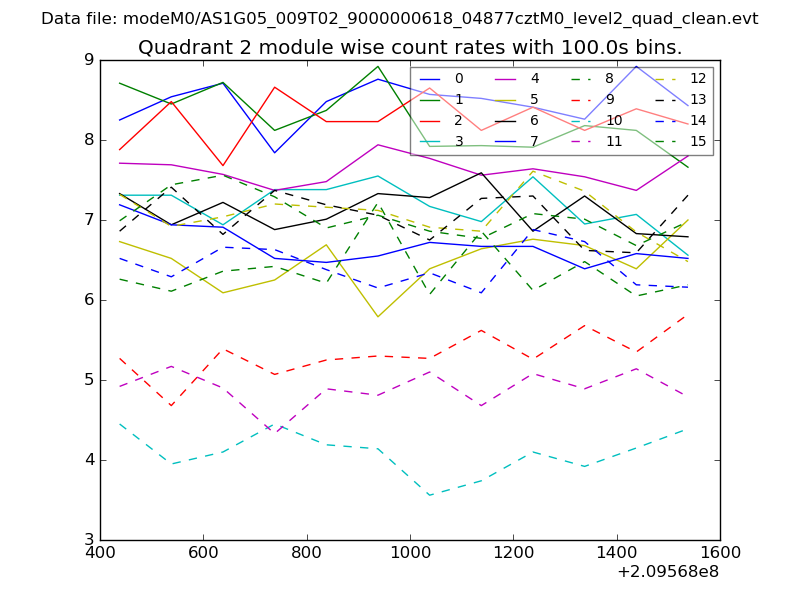
| Module-wise count rates for Quadrant B Data is divided into 100 sec bins |
 |
 |
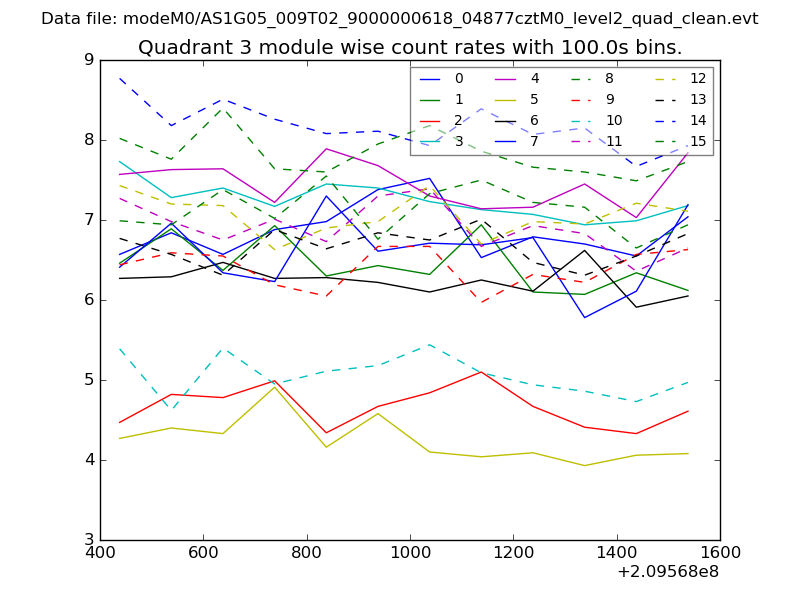
| Module-wise count rates for Quadrant C Data is divided into 100 sec bins |
 |
 |
| Module-wise count rates for Quadrant D Data is divided into 100 sec bins |
 |
 |
| Parameter | Plot |
|---|---|
| CZT HV Monitor | 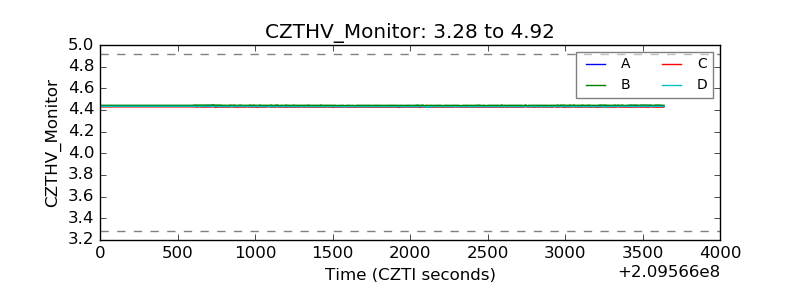 |
| D_VDD | 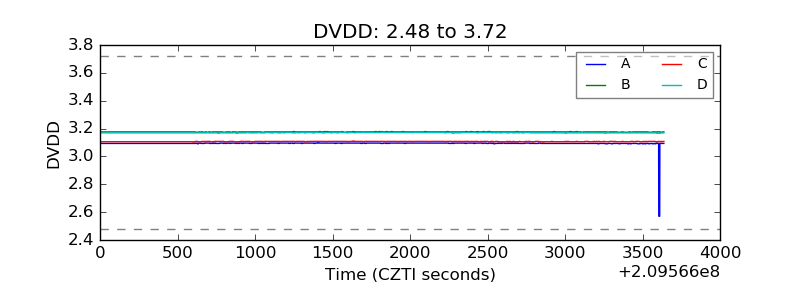 |
| Temperature 1 | 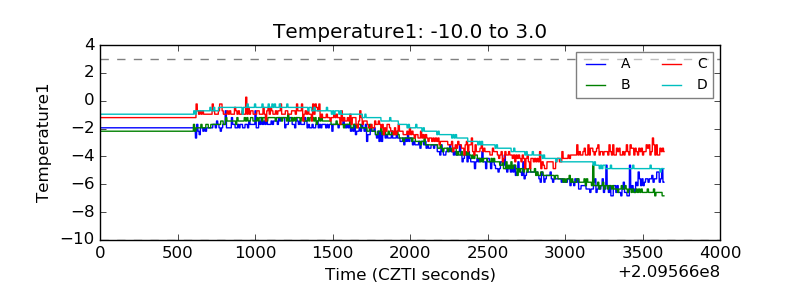 |
| Veto HV Monitor | 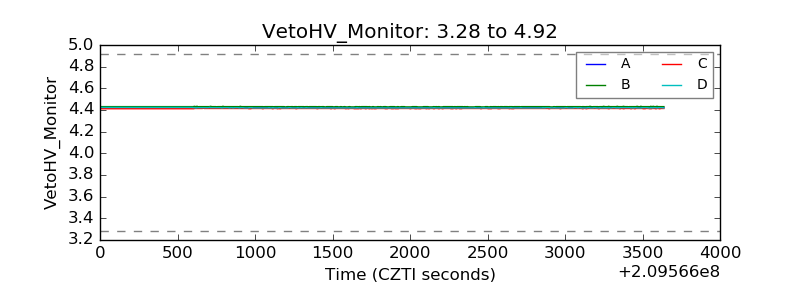 |
| Veto LLD | 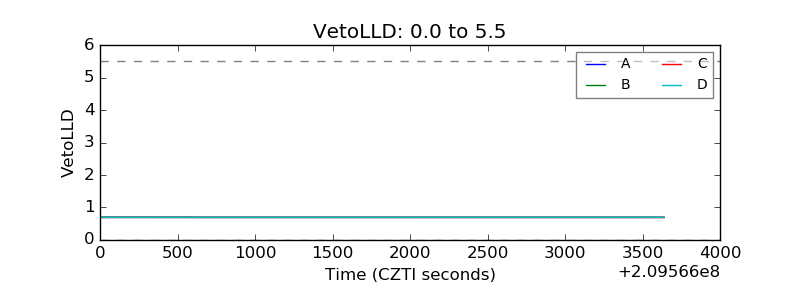 |
| Alpha Counter | 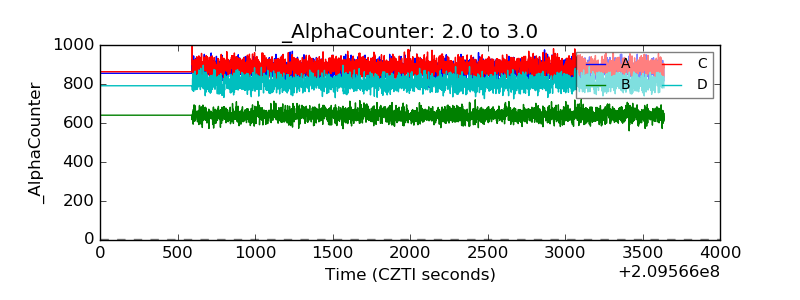 |
| _CPM_Rate | 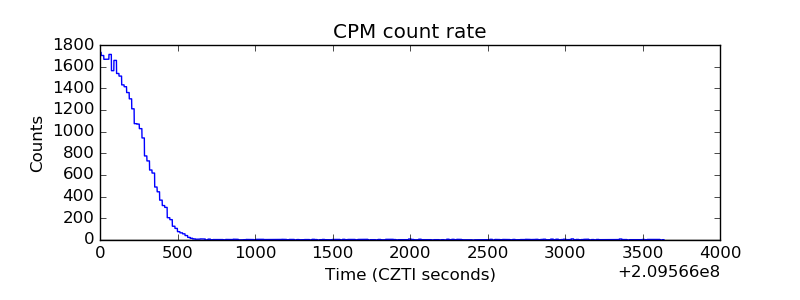 |
| CZT Counter | 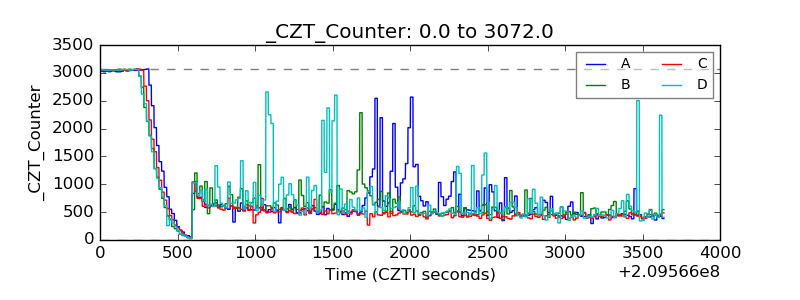 |
| +2.5 Volts monitor | 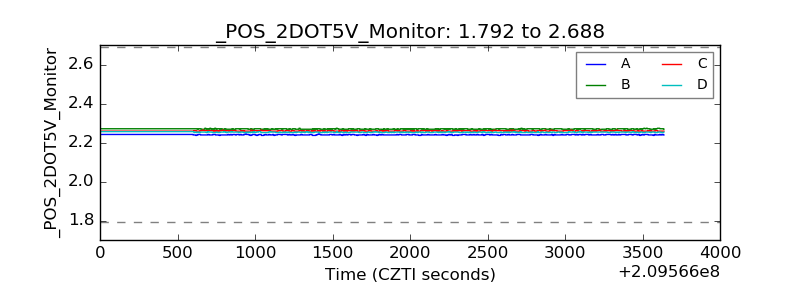 |
| +5 Volts monitor | 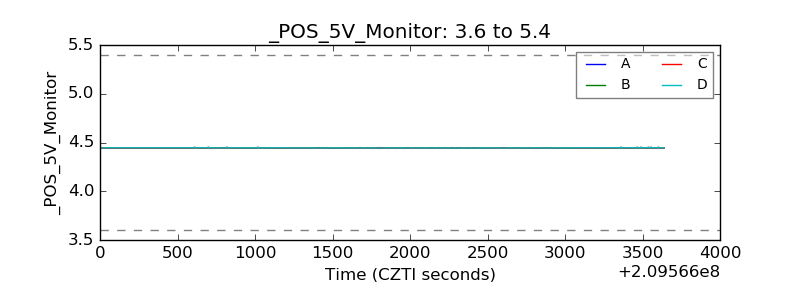 |
| _ROLL_ROT | 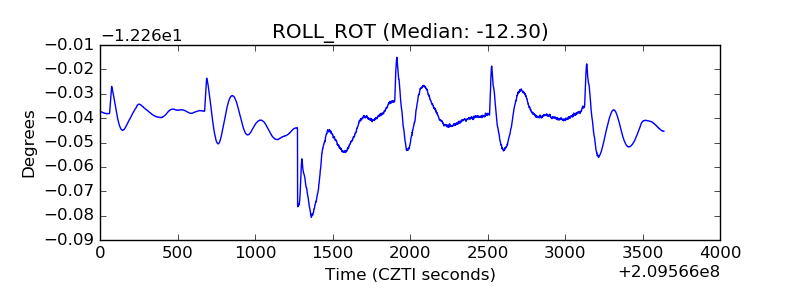 |
| _Roll_DEC | 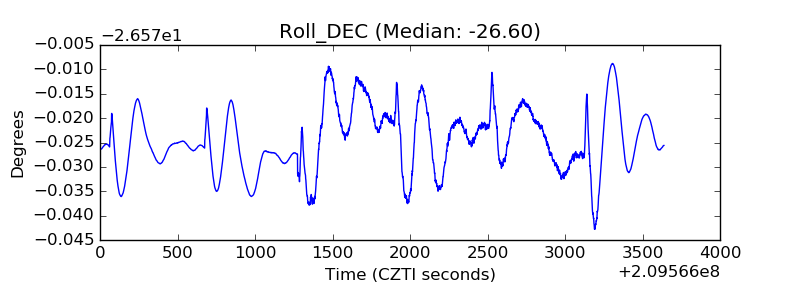 |
| _Roll_RA | 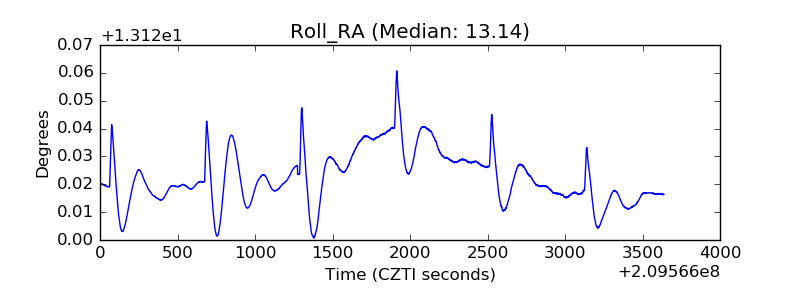 |
| Veto Counter | 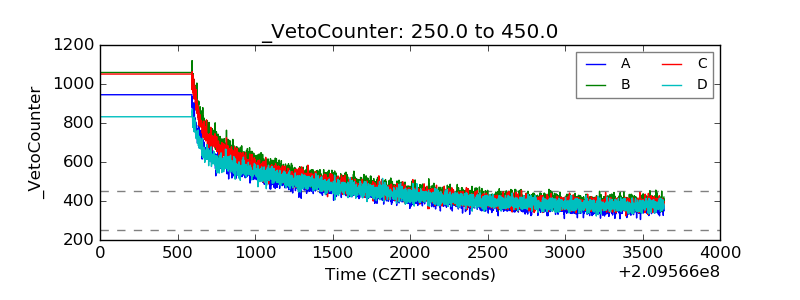 |