| Param | Original file | Final file |
|---|---|---|
| Filename | modeM0/AS1G05_237T01_9000000620cztM0_level2.fits | modeM0/AS1G05_237T01_9000000620cztM0_level2_quad_clean.evt |
| Size (bytes) | 1,359,671,040 | 1,383,278,400 |
| Size | 1.3 GB | 1.3 GB |
| Events in quadrant A | 8,477,366 | 8,742,358 |
| Events in quadrant B | 8,174,588 | 8,720,994 |
| Events in quadrant C | 8,389,538 | 8,384,252 |
| Events in quadrant D | 5,843,222 | 5,777,742 |
| Mode M9 | |||
|---|---|---|---|
| Quadrant | BADHDUFLAG | Total packets | Discarded packets |
| A | 0 | 230 | 0 |
| B | 0 | 229 | 0 |
| C | 0 | 229 | 0 |
| D | 0 | 229 | 0 |
| Mode SS | |||
|---|---|---|---|
| Quadrant | BADHDUFLAG | Total packets | Discarded packets |
| A | 0 | 3060 | 0 |
| B | 0 | 3052 | 0 |
| C | 0 | 3052 | 0 |
| D | 0 | 3050 | 0 |
| Mode M0 | |||
|---|---|---|---|
| Quadrant | BADHDUFLAG | Total packets | Discarded packets |
| A | 0 | 325017 | 0 |
| B | 0 | 332059 | 0 |
| C | 0 | 308578 | 0 |
| D | 0 | 623206 | 0 |
| Quadrant | Total seconds | Saturated seconds | Saturation percentage |
|---|---|---|---|
| A | 150001 | 2530 | 1.686655% |
| B | 149996 | 2224 | 1.482706% |
| C | 149980 | 1190 | 0.793439% |
| D | 149543 | 48508 | 32.437493% |
Noise dominated data is calculated using 1-second bins in cleaned event files. If a bin has >2000 counts, and if more than 50% of those come from <1% of pixels, then it is considered to be noise-dominated and hence unusable.
| Quadrant | # 1 sec bins | Bins with >0 counts | Bins with >2000 counts | High rate bins dominated by noise | Noise dominated (total time) | Noise dominated (detector-on time) | Marked lightcurve |
|---|---|---|---|---|---|---|---|
| A | 182879 | 150197 | 0 | 0 | 0.00% | 0.00% |  |
| B | 182879 | 150199 | 0 | 0 | 0.00% | 0.00% |  |
| C | 182879 | 150196 | 0 | 0 | 0.00% | 0.00% |  |
| D | 182879 | 149258 | 0 | 0 | 0.00% | 0.00% |  |
Top three noisy pixels from each quadrant. If the there are fewer than three noisy pixels in the level2.evt file, extra rows are filled as -1
| Pixel properties | Quadrant properties | ||||||
|---|---|---|---|---|---|---|---|
| Quadrant | DetID | PixID | Counts | Sigma | Mean | Median | Sigma |
| A | 0 | 29 | 8499 | 11.39 | 2202 | 2051 | 566.3 |
| A | 14 | 188 | 8446 | 11.29 | 2202 | 2051 | 566.3 |
| A | 7 | 110 | 7441 | 9.52 | 2202 | 2051 | 566.3 |
| B | 2 | 9 | 6999 | 11.41 | 2157 | 2050 | 433.8 |
| B | 12 | 226 | 6238 | 9.65 | 2157 | 2050 | 433.8 |
| B | 14 | 254 | 5601 | 8.19 | 2157 | 2050 | 433.8 |
| C | 1 | 81 | 6320 | 7.26 | 2214 | 2043 | 589.1 |
| C | 1 | 80 | 6245 | 7.13 | 2214 | 2043 | 589.1 |
| C | 9 | 188 | 5663 | 6.15 | 2214 | 2043 | 589.1 |
| D | 11 | 82 | 4934 | 7.62 | 1667 | 1513 | 448.9 |
| D | 1 | 19 | 4397 | 6.42 | 1667 | 1513 | 448.9 |
| D | 6 | 231 | 4333 | 6.28 | 1667 | 1513 | 448.9 |
Histogram calculated using DETX and DETY for each event in the final _common_clean file
| Quadrant A | 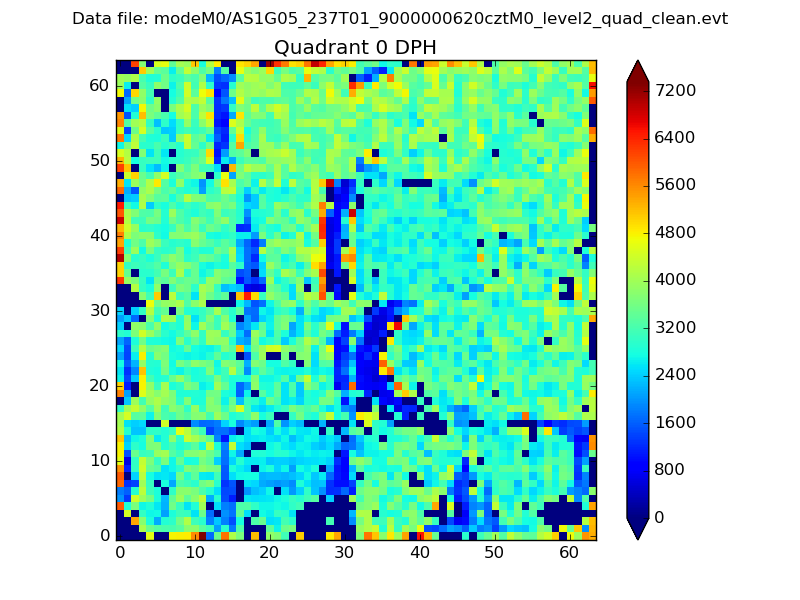 |
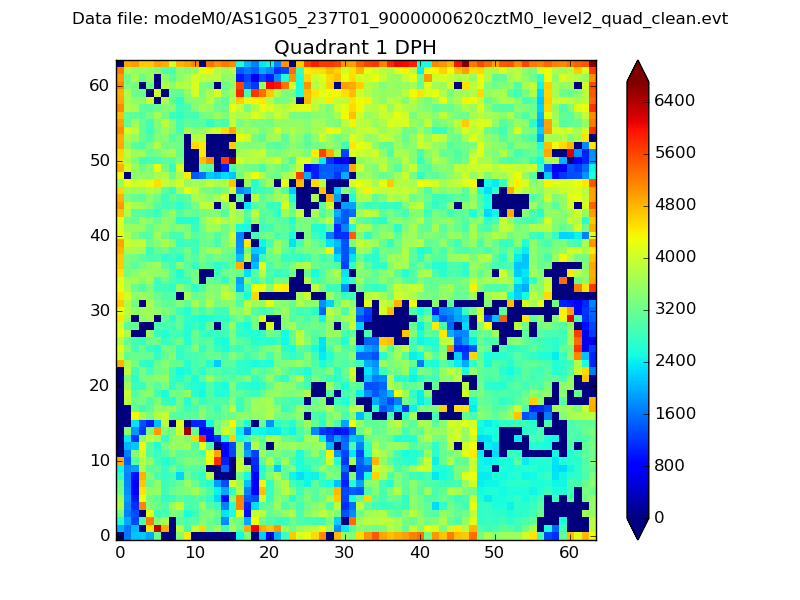 |
Quadrant B |
|---|---|---|---|
| Quadrant D |  |
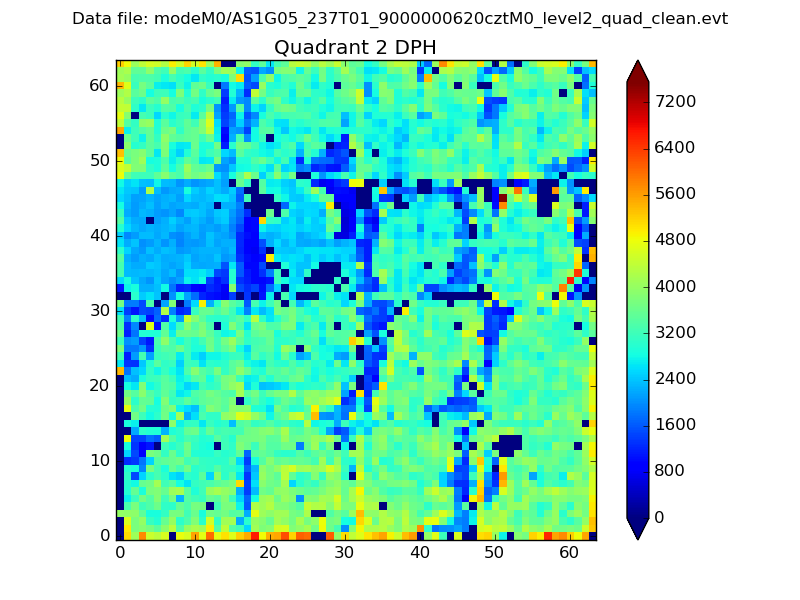 |
Quadrant C |
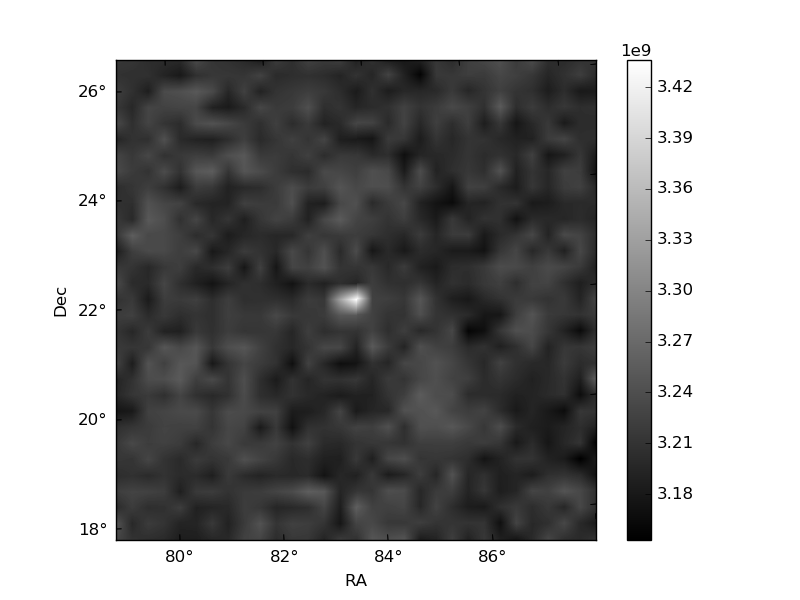
| Plot type | Count rate plots | Images |
|---|---|---|
| Comparison with Poisson distribution Blue bars denote a histogram of data divided into 1 sec bins. Red curve is a Poisson curve with rate = median count rate of data. |
 |
 |
| Quadrant-wise count rates Data is divided into 100 sec bins |
 |
|
| Module-wise count rates for Quadrant A Data is divided into 100 sec bins |
 |
 |
| Module-wise count rates for Quadrant B Data is divided into 100 sec bins |
 |
 |
| Module-wise count rates for Quadrant C Data is divided into 100 sec bins |
 |
 |
| Module-wise count rates for Quadrant D Data is divided into 100 sec bins |
 |
 |
| Parameter | Plot |
|---|---|
| CZT HV Monitor | 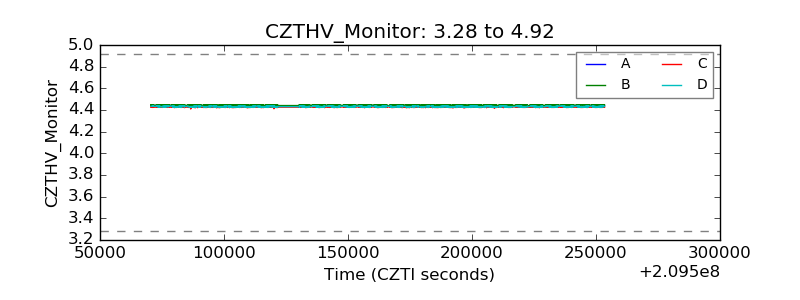 |
| D_VDD | 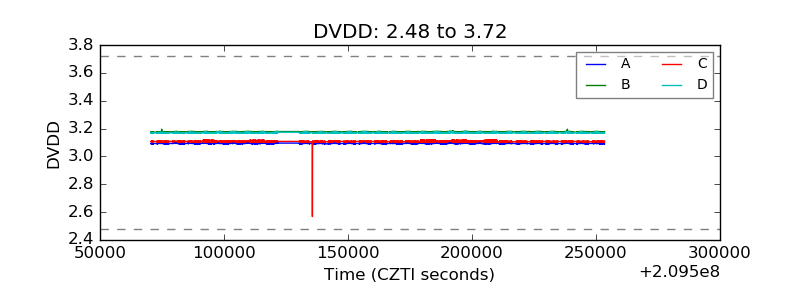 |
| Temperature 1 |  |
| Veto HV Monitor |  |
| Veto LLD |  |
| Alpha Counter |  |
| _CPM_Rate | 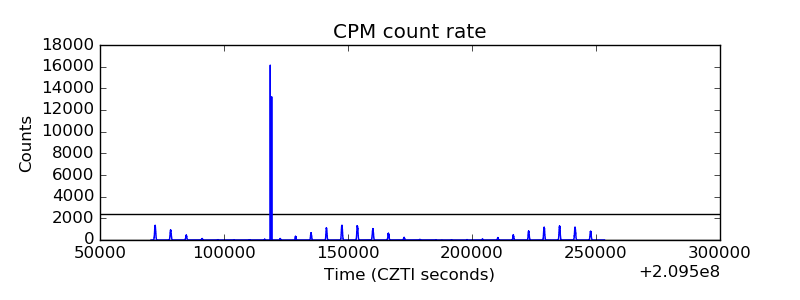 |
| CZT Counter |  |
| +2.5 Volts monitor | 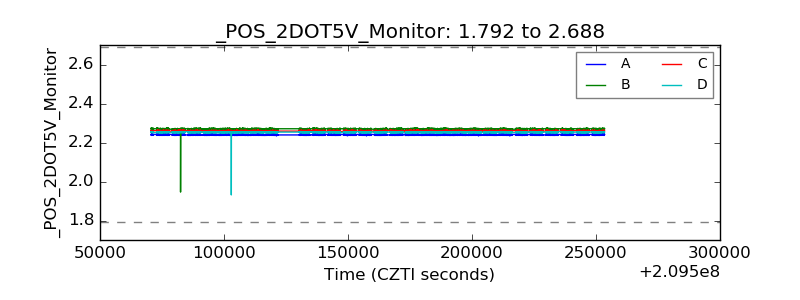 |
| +5 Volts monitor |  |
| _ROLL_ROT |  |
| _Roll_DEC |  |
| _Roll_RA |  |
| Veto Counter | 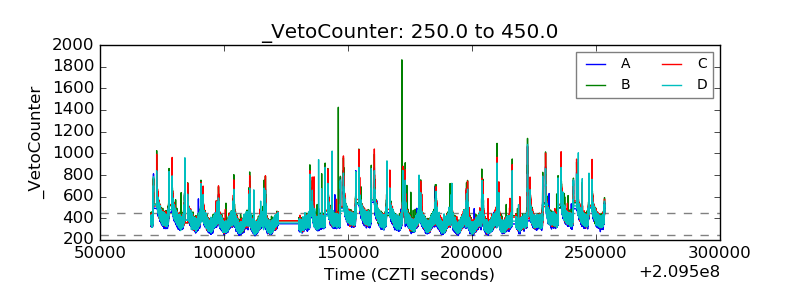 |