| Param | Original file | Final file |
|---|---|---|
| Filename | modeM0/AS1G05_237T01_9000000620_04877cztM0_level2.evt | modeM0/AS1G05_237T01_9000000620_04877cztM0_level2_quad_clean.evt |
| Size (bytes) | 205,747,200 | 26,879,040 |
| Size | 196.2 MB | 25.6 MB |
| Events in quadrant A | 1,376,717 | 159,099 |
| Events in quadrant B | 1,509,098 | 160,268 |
| Events in quadrant C | 1,304,337 | 159,944 |
| Events in quadrant D | 1,866,525 | 151,837 |
| Mode M9 | |||
|---|---|---|---|
| Quadrant | BADHDUFLAG | Total packets | Discarded packets |
| A | 0 | 13 | 0 |
| B | 0 | 13 | 0 |
| C | 0 | 13 | 0 |
| D | 0 | 13 | 0 |
| Mode SS | |||
|---|---|---|---|
| Quadrant | BADHDUFLAG | Total packets | Discarded packets |
| A | 0 | 52 | 0 |
| B | 0 | 52 | 0 |
| C | 0 | 52 | 0 |
| D | 0 | 52 | 0 |
| Mode M0 | |||
|---|---|---|---|
| Quadrant | BADHDUFLAG | Total packets | Discarded packets |
| A | 0 | 5582 | 2 |
| B | 0 | 6048 | 1 |
| C | 0 | 5392 | 1 |
| D | 0 | 7208 | 1 |
| Quadrant | Total seconds | Saturated seconds | Saturation percentage |
|---|---|---|---|
| A | 2540 | 82 | 3.228346% |
| B | 2540 | 91 | 3.582677% |
| C | 2540 | 55 | 2.165354% |
| D | 2540 | 227 | 8.937008% |
Noise dominated data is calculated using 1-second bins in cleaned event files. If a bin has >2000 counts, and if more than 50% of those come from <1% of pixels, then it is considered to be noise-dominated and hence unusable.
| Quadrant | # 1 sec bins | Bins with >0 counts | Bins with >2000 counts | High rate bins dominated by noise | Noise dominated (total time) | Noise dominated (detector-on time) | Marked lightcurve |
|---|---|---|---|---|---|---|---|
| A | 3815 | 2540 | 2 | 2 | 0.05% | 0.08% | 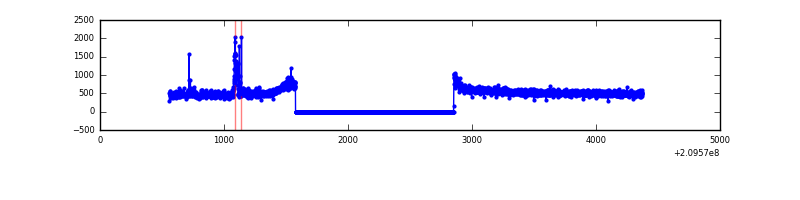 |
| B | 3815 | 2540 | 8 | 8 | 0.21% | 0.31% | 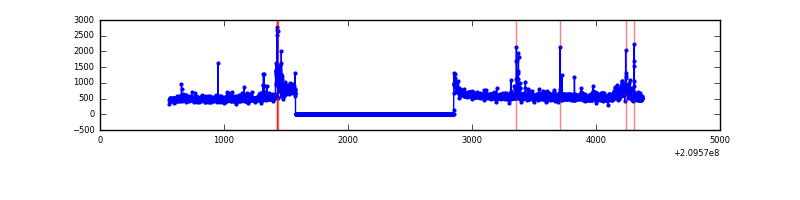 |
| C | 3815 | 2540 | 0 | 0 | 0.00% | 0.00% | 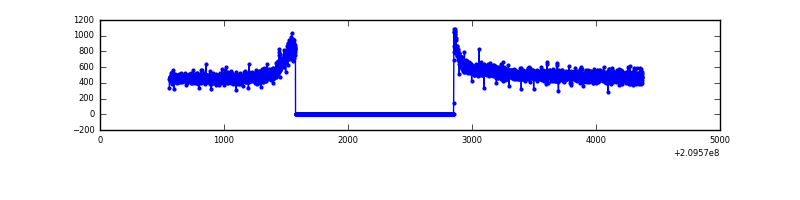 |
| D | 3815 | 2540 | 139 | 139 | 3.64% | 5.47% | 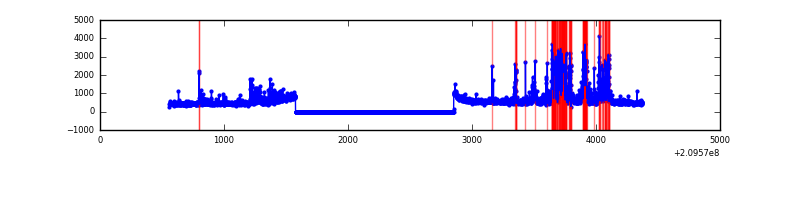 |
Top three noisy pixels from each quadrant. If the there are fewer than three noisy pixels in the level2.evt file, extra rows are filled as -1
| Pixel properties | Quadrant properties | ||||||
|---|---|---|---|---|---|---|---|
| Quadrant | DetID | PixID | Counts | Sigma | Mean | Median | Sigma |
| A | 13 | 251 | 47593 | 666.54 | 345 | 338 | 70.9 |
| A | 0 | 226 | 3492 | 44.49 | 345 | 338 | 70.9 |
| A | 12 | 194 | 3426 | 43.56 | 345 | 338 | 70.9 |
| B | 10 | 16 | 47196 | 696.79 | 347 | 340 | 67.2 |
| B | 15 | 204 | 42741 | 630.54 | 347 | 340 | 67.2 |
| B | 4 | 80 | 36914 | 543.89 | 347 | 340 | 67.2 |
| C | 13 | 61 | 2836 | 32.12 | 333 | 335 | 77.9 |
| C | 12 | 4 | 2215 | 24.15 | 333 | 335 | 77.9 |
| C | 5 | 207 | 1487 | 14.8 | 333 | 335 | 77.9 |
| D | 12 | 233 | 349336 | 4291.18 | 326 | 316 | 81.3 |
| D | 2 | 234 | 115887 | 1420.94 | 326 | 316 | 81.3 |
| D | 13 | 235 | 48977 | 598.28 | 326 | 316 | 81.3 |
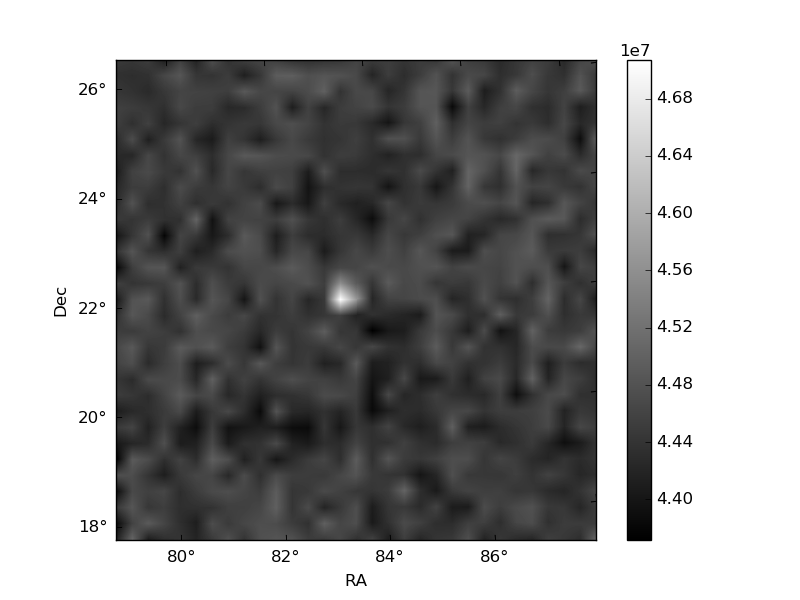
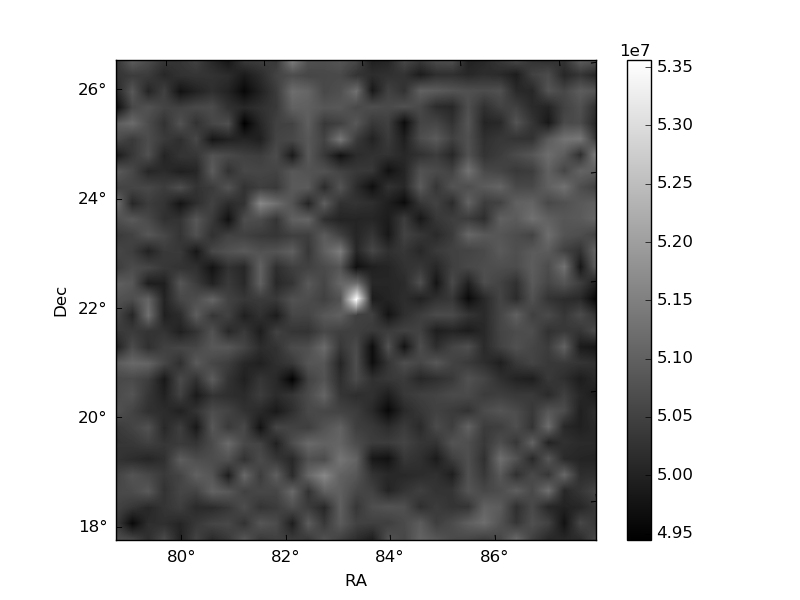
Histogram calculated using DETX and DETY for each event in the final _common_clean file
| Quadrant A | 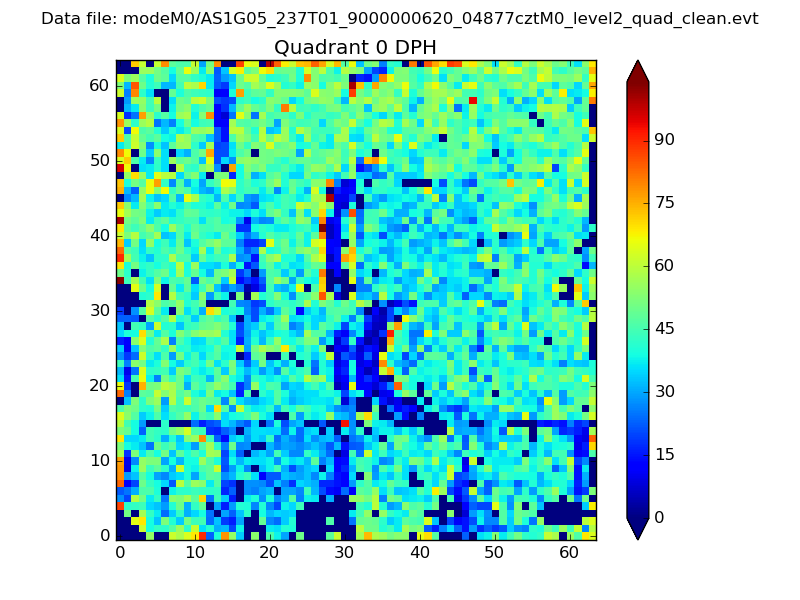 |
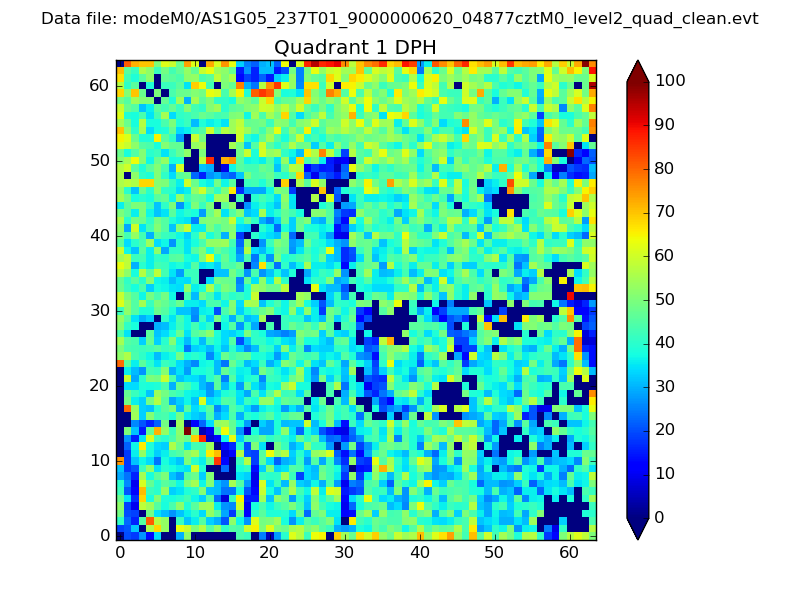 |
Quadrant B |
|---|---|---|---|
| Quadrant D | 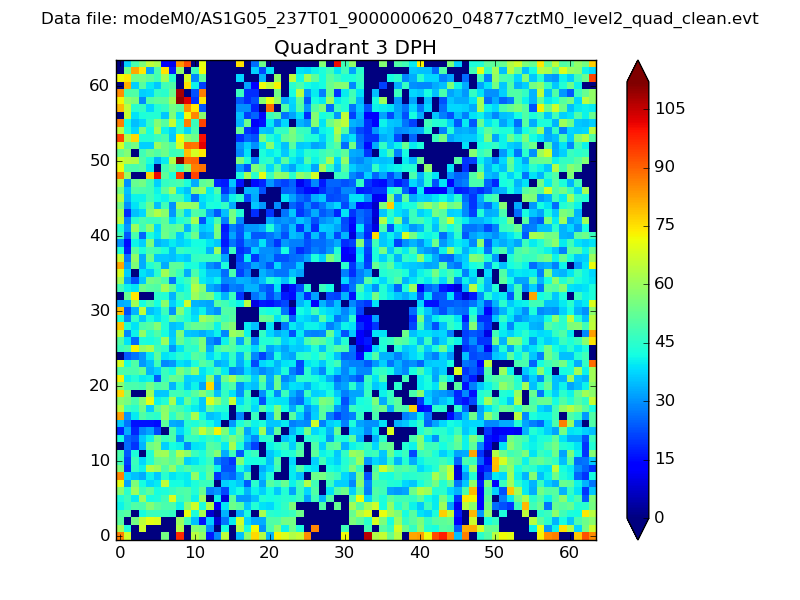 |
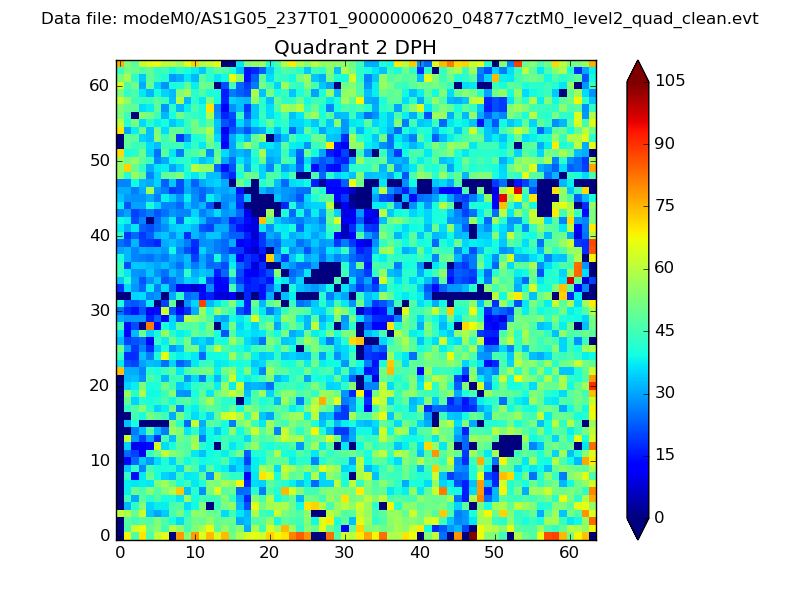 |
Quadrant C |
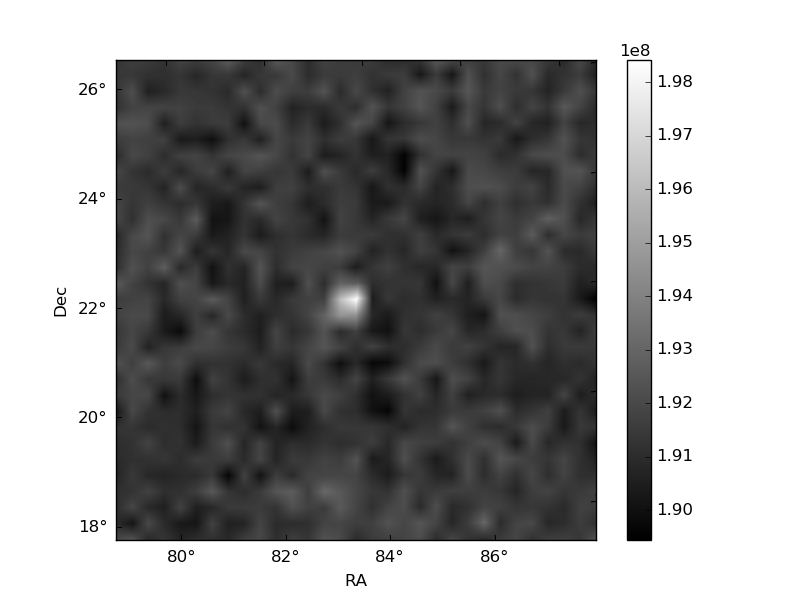
| Plot type | Count rate plots | Images |
|---|---|---|
| Comparison with Poisson distribution Blue bars denote a histogram of data divided into 1 sec bins. Red curve is a Poisson curve with rate = median count rate of data. |
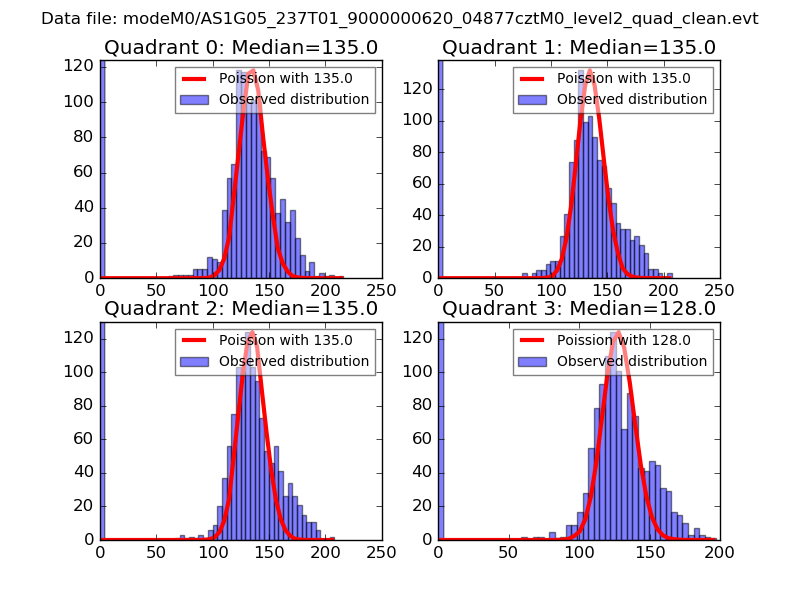 |
 |
| Quadrant-wise count rates Data is divided into 100 sec bins |
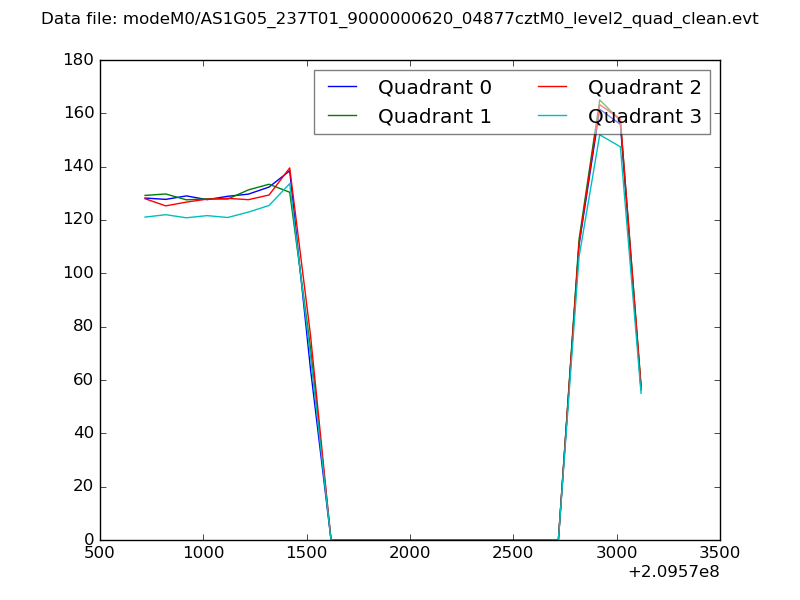 |
|
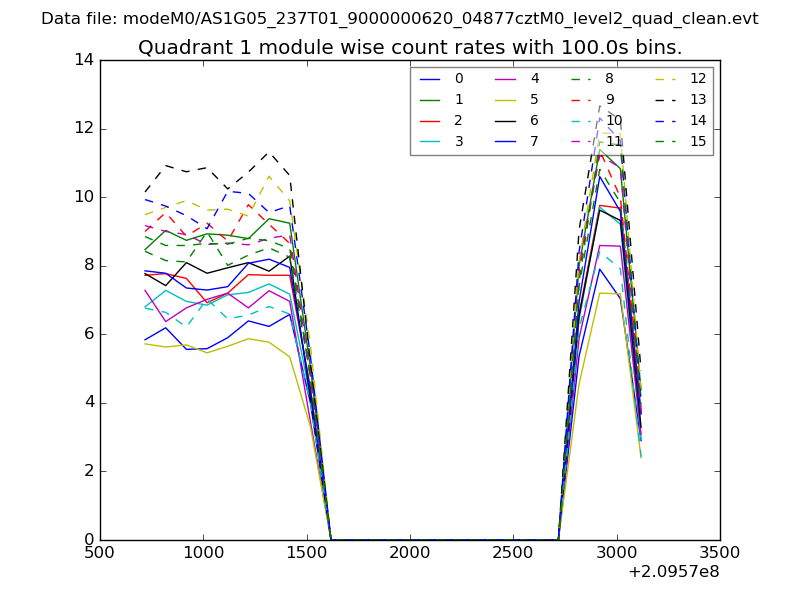
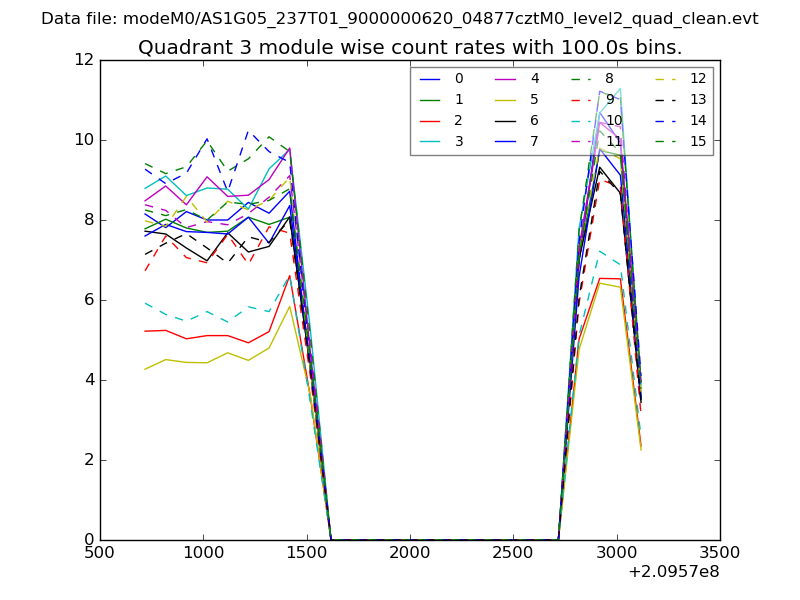
| Module-wise count rates for Quadrant A Data is divided into 100 sec bins |
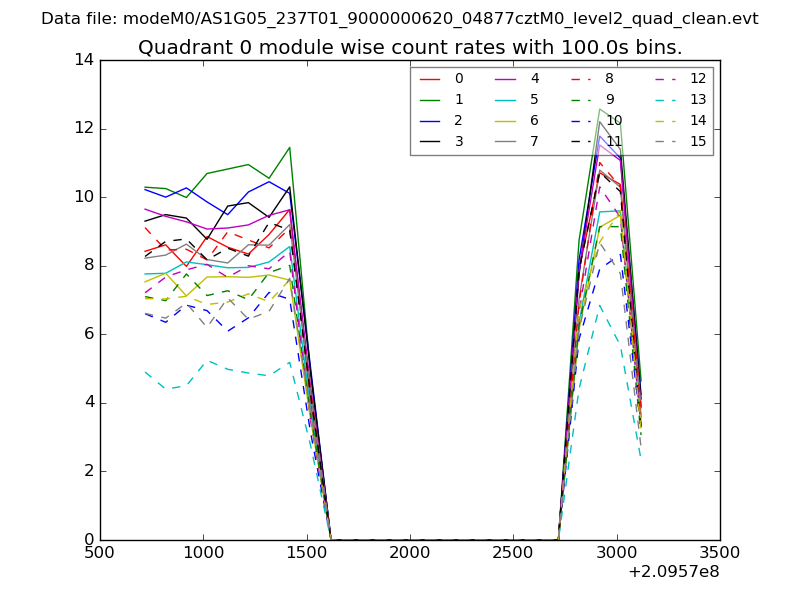 |
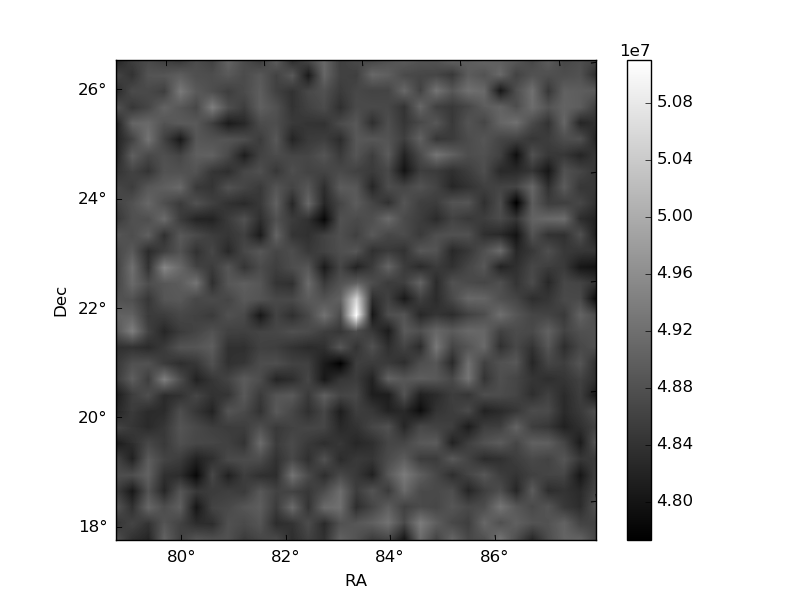 |
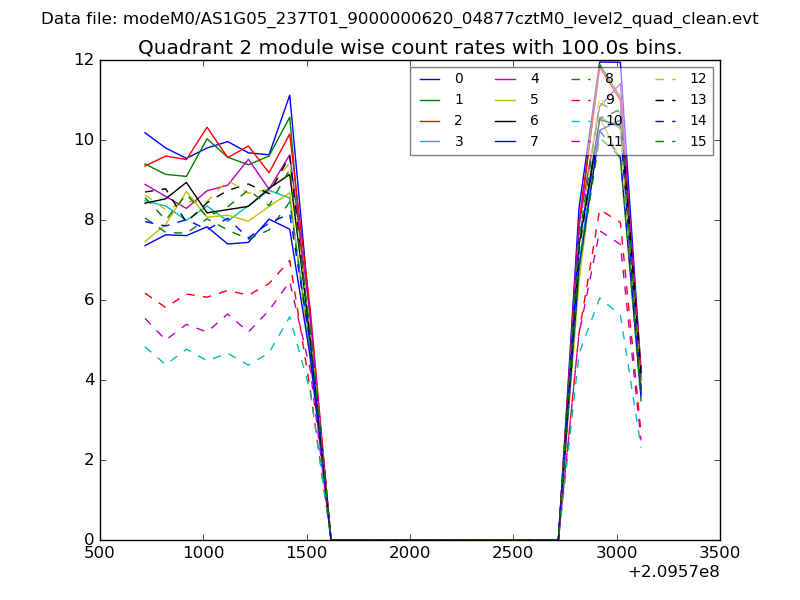
| Module-wise count rates for Quadrant B Data is divided into 100 sec bins |
 |
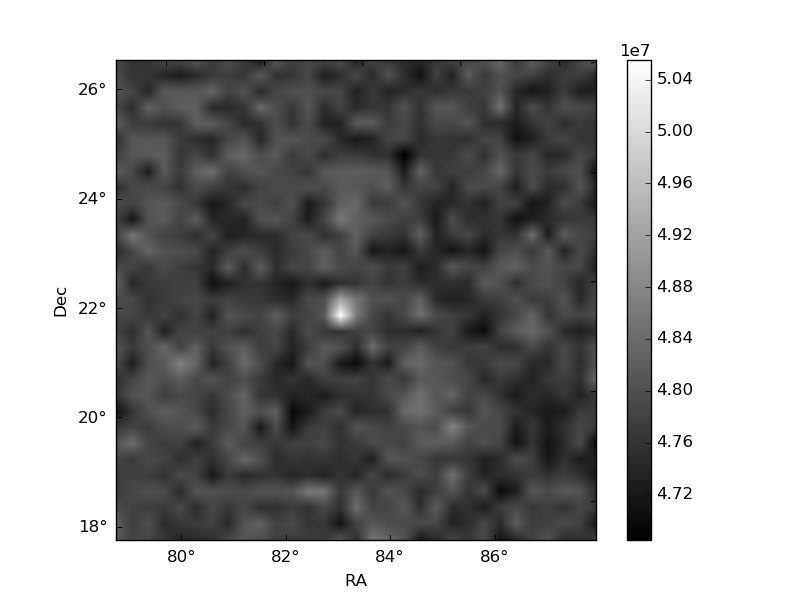 |
| Module-wise count rates for Quadrant C Data is divided into 100 sec bins |
 |
 |
| Module-wise count rates for Quadrant D Data is divided into 100 sec bins |
 |
 |
| Parameter | Plot |
|---|---|
| CZT HV Monitor | 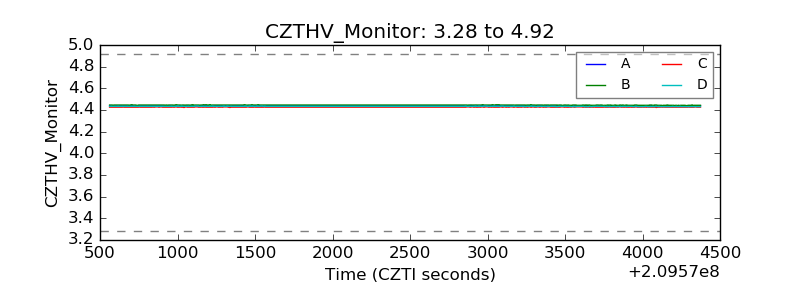 |
| D_VDD | 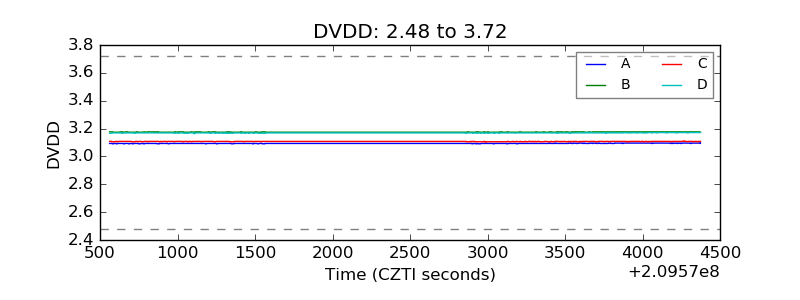 |
| Temperature 1 | 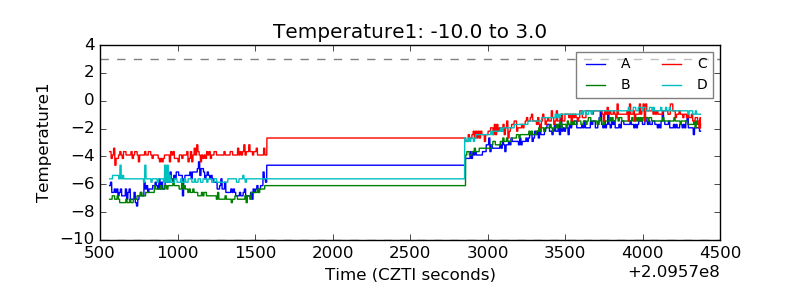 |
| Veto HV Monitor | 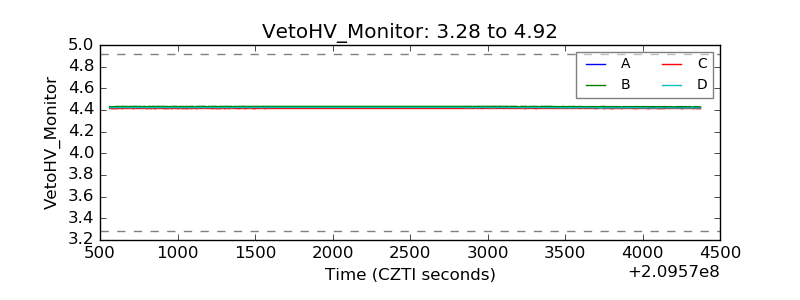 |
| Veto LLD | 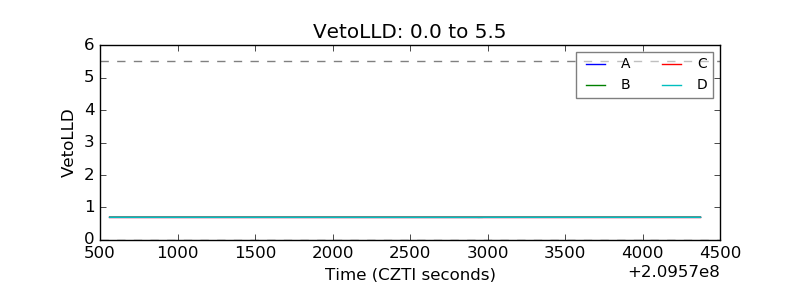 |
| Alpha Counter | 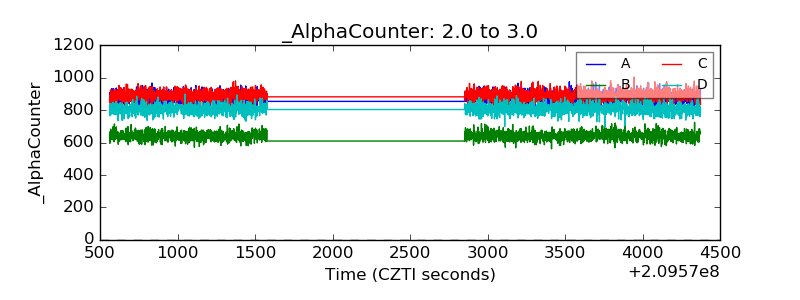 |
| _CPM_Rate |  |
| CZT Counter | 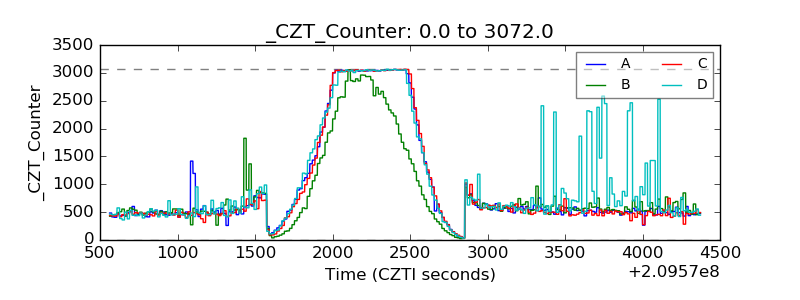 |
| +2.5 Volts monitor |  |
| +5 Volts monitor |  |
| _ROLL_ROT | 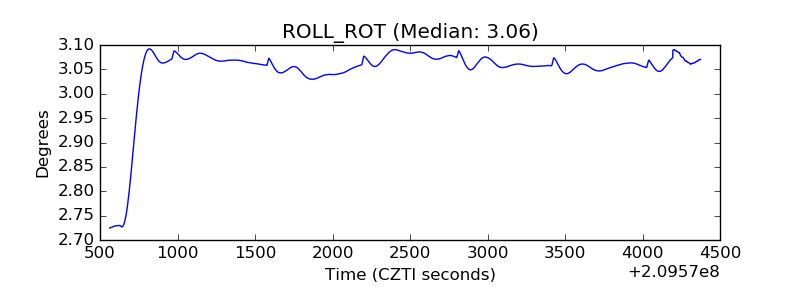 |
| _Roll_DEC | 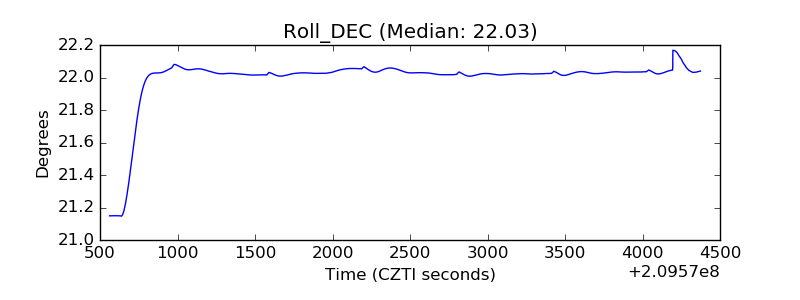 |
| _Roll_RA | 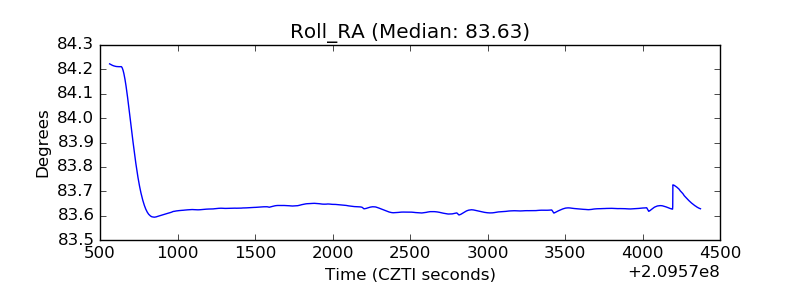 |
| Veto Counter | 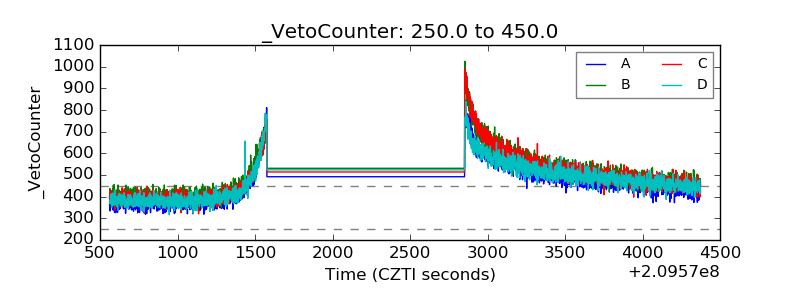 |