| Param | Original file | Final file |
|---|---|---|
| Filename | modeM0/AS1G05_237T01_9000000620_04878cztM0_level2.evt | modeM0/AS1G05_237T01_9000000620_04878cztM0_level2_quad_clean.evt |
| Size (bytes) | 485,893,440 | 62,521,920 |
| Size | 463.4 MB | 59.6 MB |
| Events in quadrant A | 3,286,535 | 364,717 |
| Events in quadrant B | 3,663,929 | 366,572 |
| Events in quadrant C | 3,201,989 | 363,149 |
| Events in quadrant D | 4,120,644 | 344,068 |
| Mode M9 | |||
|---|---|---|---|
| Quadrant | BADHDUFLAG | Total packets | Discarded packets |
| A | 0 | 12 | 0 |
| B | 0 | 12 | 0 |
| C | 0 | 12 | 0 |
| D | 0 | 12 | 0 |
| Mode SS | |||
|---|---|---|---|
| Quadrant | BADHDUFLAG | Total packets | Discarded packets |
| A | 0 | 134 | 0 |
| B | 0 | 134 | 0 |
| C | 0 | 134 | 0 |
| D | 0 | 134 | 0 |
| Mode M0 | |||
|---|---|---|---|
| Quadrant | BADHDUFLAG | Total packets | Discarded packets |
| A | 0 | 13687 | 3 |
| B | 0 | 14914 | 2 |
| C | 0 | 13523 | 2 |
| D | 0 | 16382 | 2 |
| Quadrant | Total seconds | Saturated seconds | Saturation percentage |
|---|---|---|---|
| A | 6506 | 105 | 1.613895% |
| B | 6506 | 156 | 2.397787% |
| C | 6506 | 73 | 1.122041% |
| D | 6506 | 284 | 4.365201% |
Noise dominated data is calculated using 1-second bins in cleaned event files. If a bin has >2000 counts, and if more than 50% of those come from <1% of pixels, then it is considered to be noise-dominated and hence unusable.
| Quadrant | # 1 sec bins | Bins with >0 counts | Bins with >2000 counts | High rate bins dominated by noise | Noise dominated (total time) | Noise dominated (detector-on time) | Marked lightcurve |
|---|---|---|---|---|---|---|---|
| A | 7756 | 6506 | 0 | 0 | 0.00% | 0.00% | 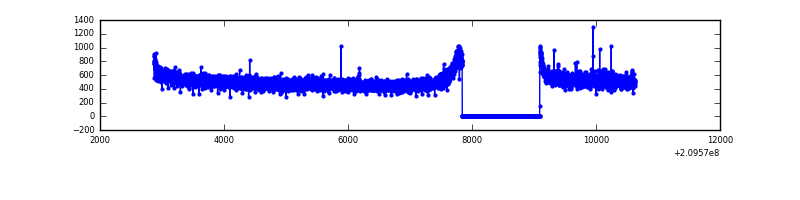 |
| B | 7756 | 6506 | 40 | 40 | 0.52% | 0.61% | 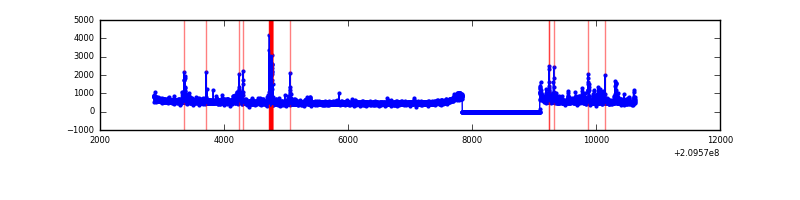 |
| C | 7756 | 6506 | 0 | 0 | 0.00% | 0.00% | 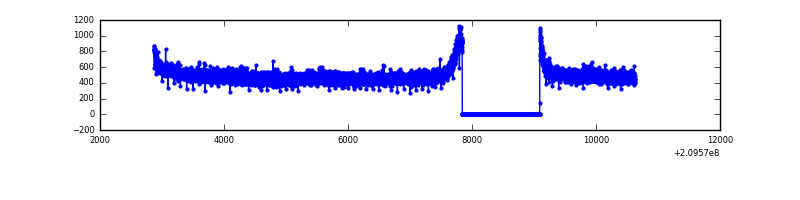 |
| D | 7756 | 6506 | 159 | 159 | 2.05% | 2.44% | 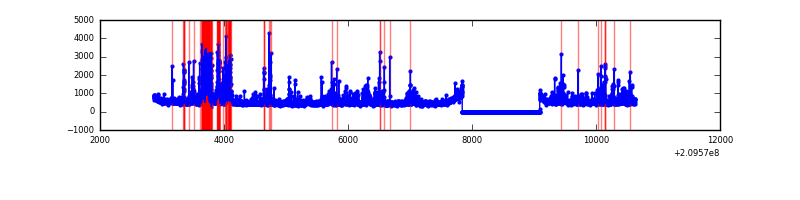 |
Top three noisy pixels from each quadrant. If the there are fewer than three noisy pixels in the level2.evt file, extra rows are filled as -1
| Pixel properties | Quadrant properties | ||||||
|---|---|---|---|---|---|---|---|
| Quadrant | DetID | PixID | Counts | Sigma | Mean | Median | Sigma |
| A | 8 | 15 | 20497 | 114.7 | 847 | 832 | 171.5 |
| A | 12 | 194 | 8633 | 45.5 | 847 | 832 | 171.5 |
| A | 0 | 226 | 8615 | 45.39 | 847 | 832 | 171.5 |
| B | 4 | 80 | 132137 | 821.45 | 846 | 831 | 159.8 |
| B | 15 | 204 | 102068 | 633.34 | 846 | 831 | 159.8 |
| B | 7 | 252 | 83675 | 518.27 | 846 | 831 | 159.8 |
| C | 13 | 61 | 6805 | 31.72 | 819 | 825 | 188.5 |
| C | 12 | 4 | 2444 | 8.59 | 819 | 825 | 188.5 |
| C | 5 | 174 | 2288 | 7.76 | 819 | 825 | 188.5 |
| D | 12 | 233 | 387986 | 1941.46 | 811 | 788 | 199.4 |
| D | 13 | 235 | 202388 | 1010.85 | 811 | 788 | 199.4 |
| D | 2 | 136 | 115072 | 573.03 | 811 | 788 | 199.4 |
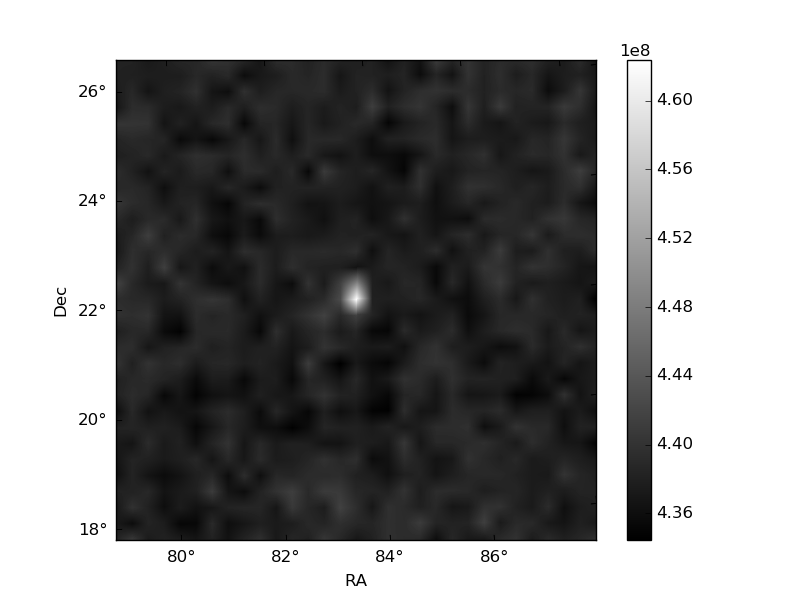
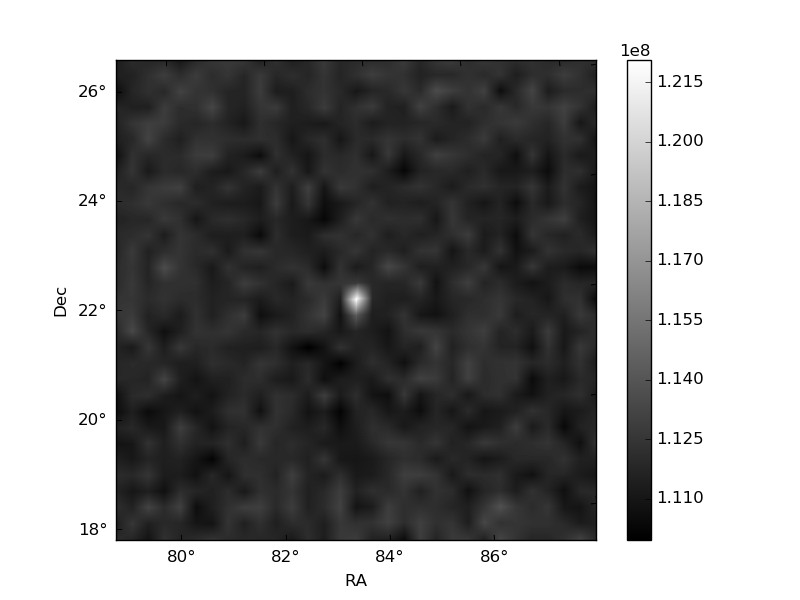
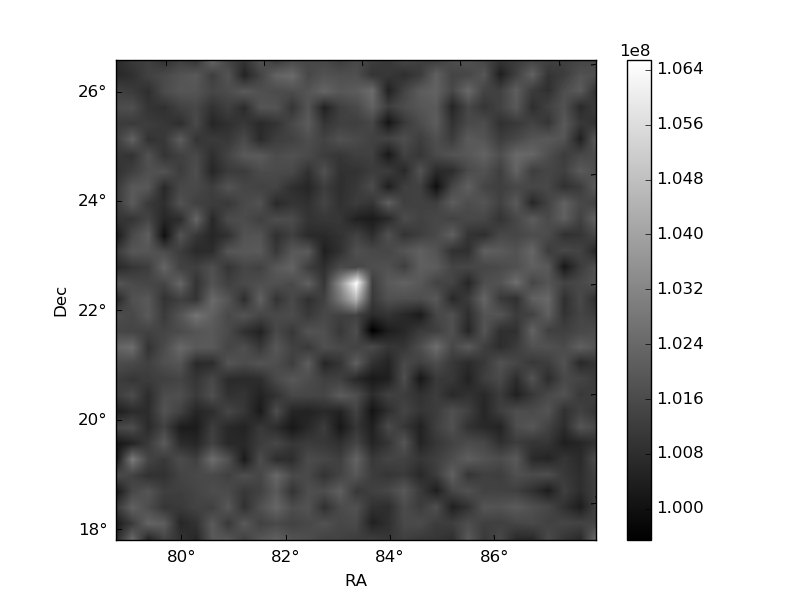
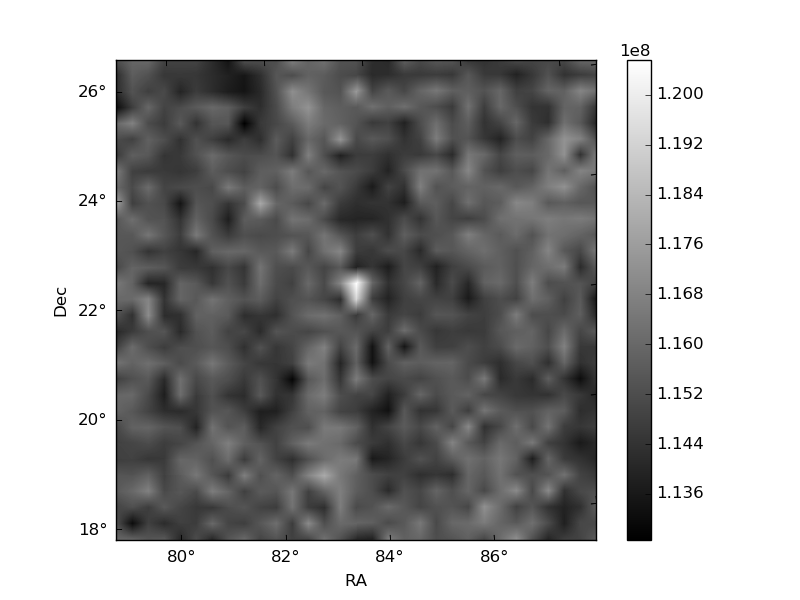
Histogram calculated using DETX and DETY for each event in the final _common_clean file
| Quadrant A | 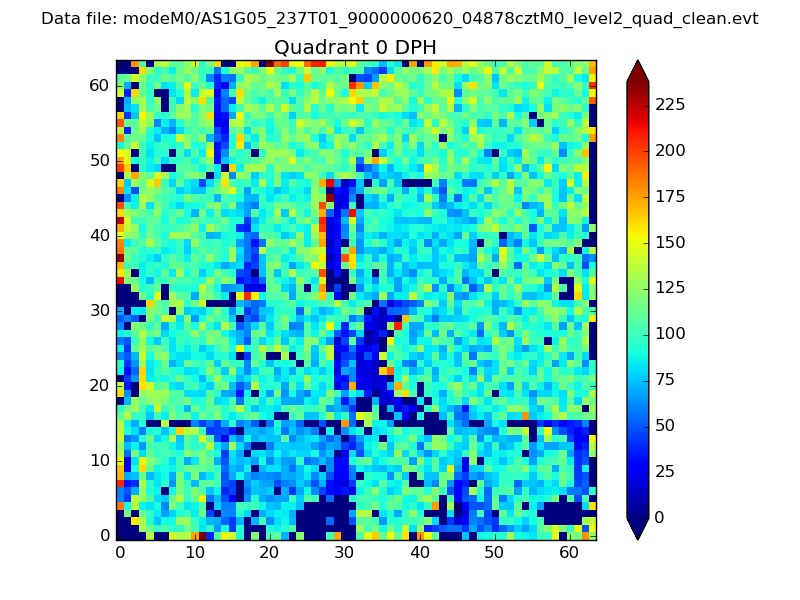 |
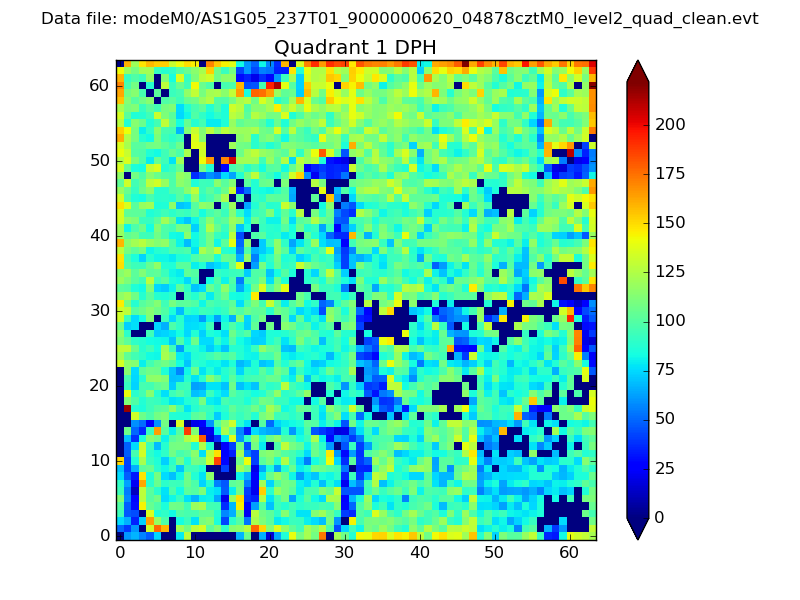 |
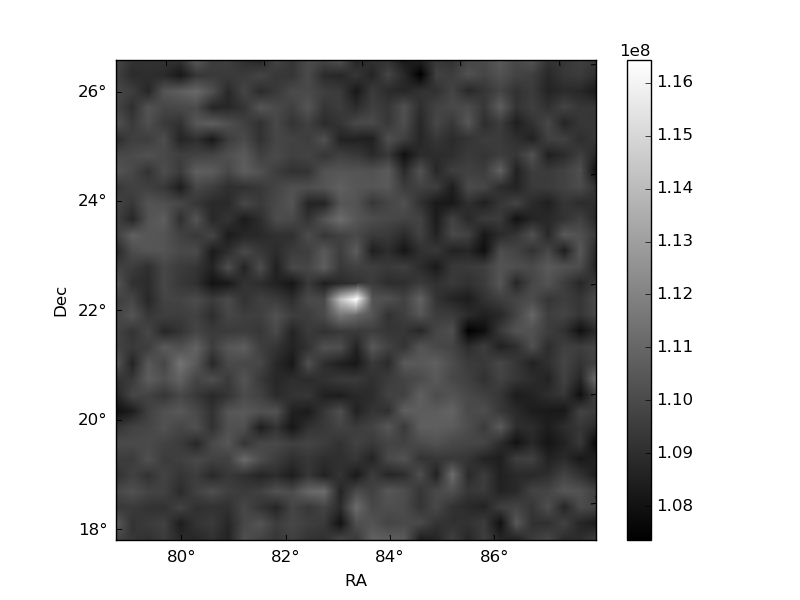
Quadrant B |
|---|---|---|---|
| Quadrant D | 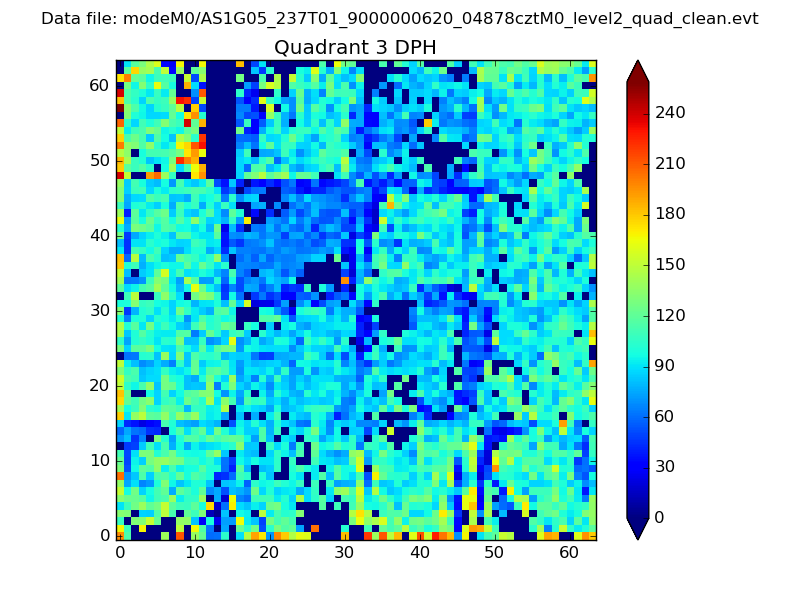 |
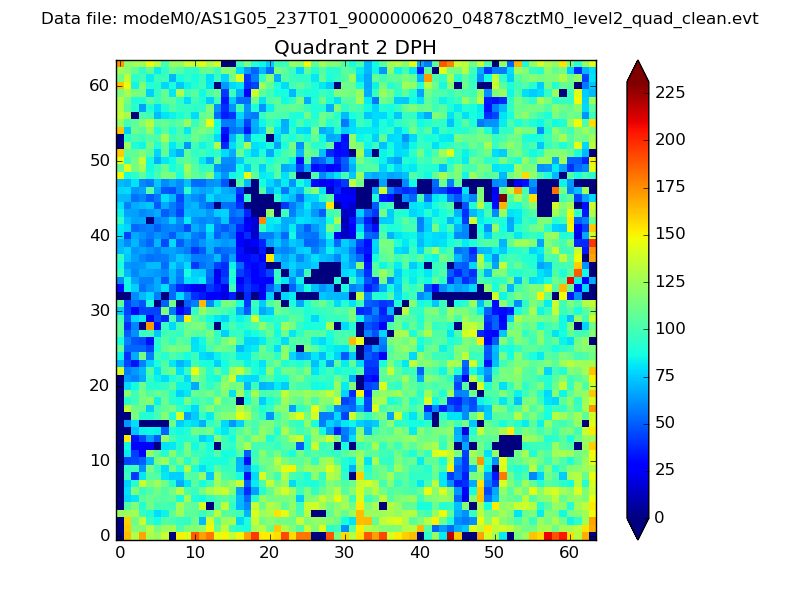 |
Quadrant C |
| Plot type | Count rate plots | Images |
|---|---|---|
| Comparison with Poisson distribution Blue bars denote a histogram of data divided into 1 sec bins. Red curve is a Poisson curve with rate = median count rate of data. |
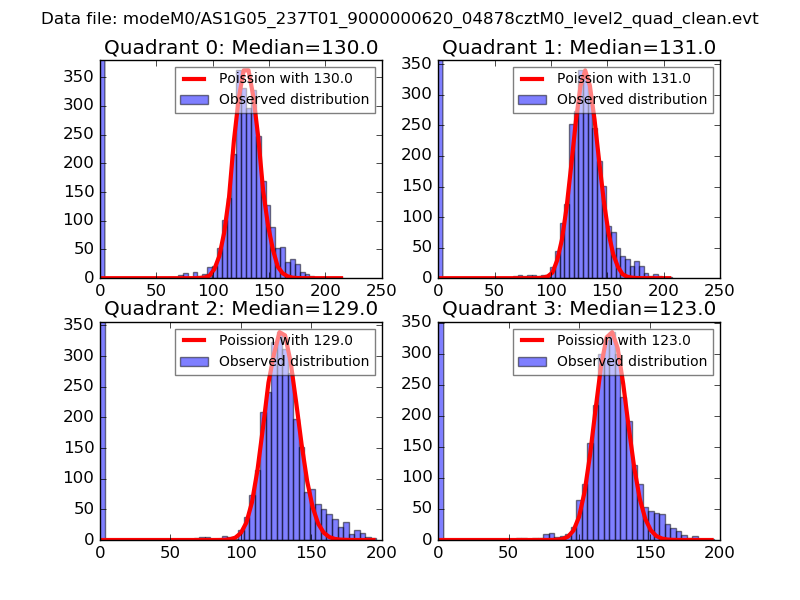 |
 |
| Quadrant-wise count rates Data is divided into 100 sec bins |
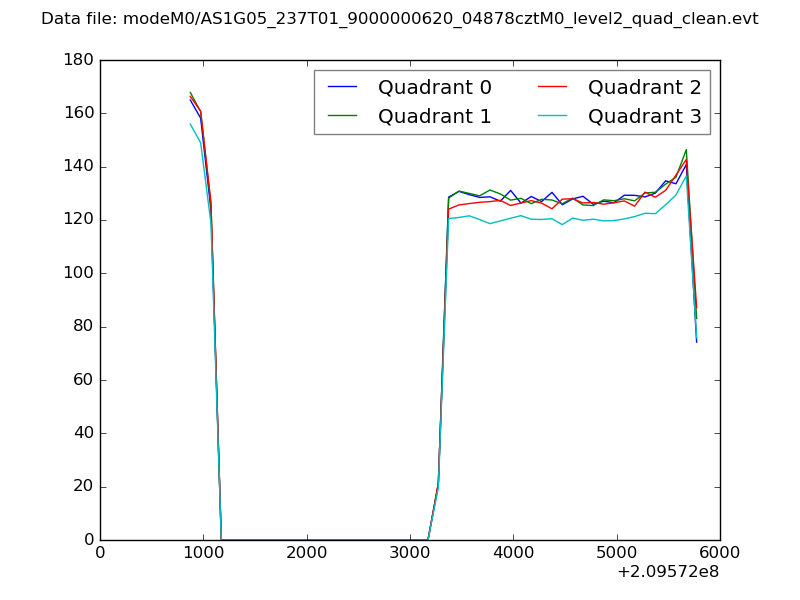 |
|
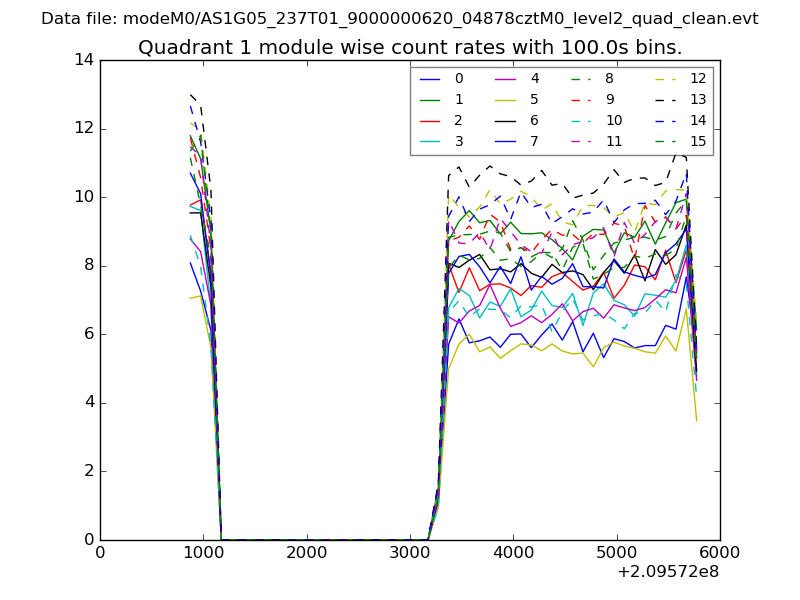
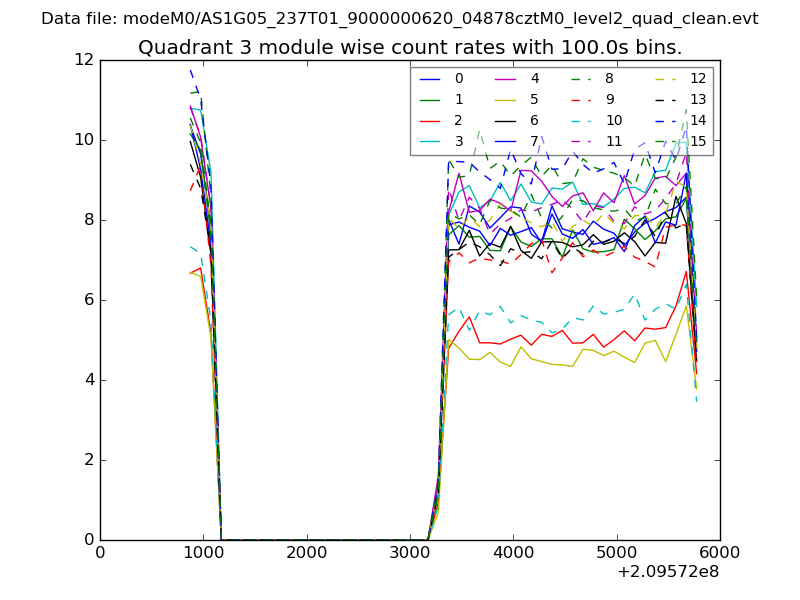
| Module-wise count rates for Quadrant A Data is divided into 100 sec bins |
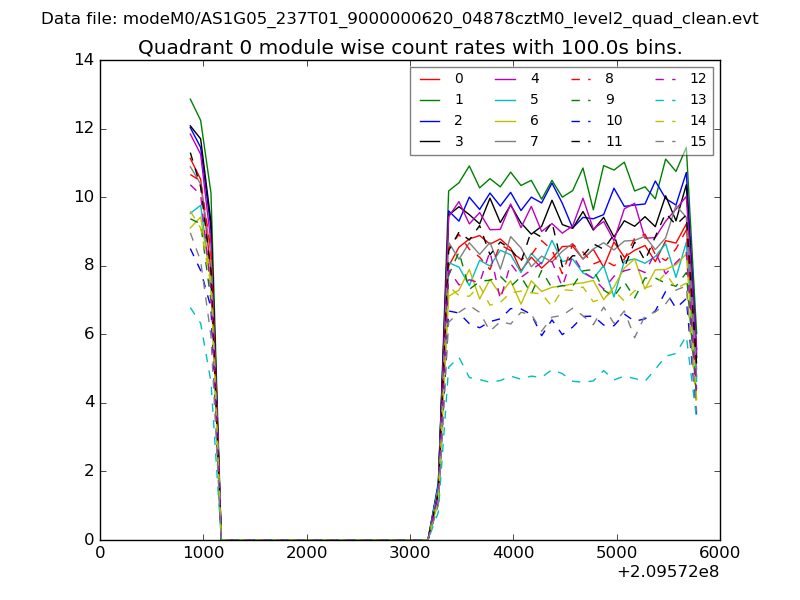 |
 |
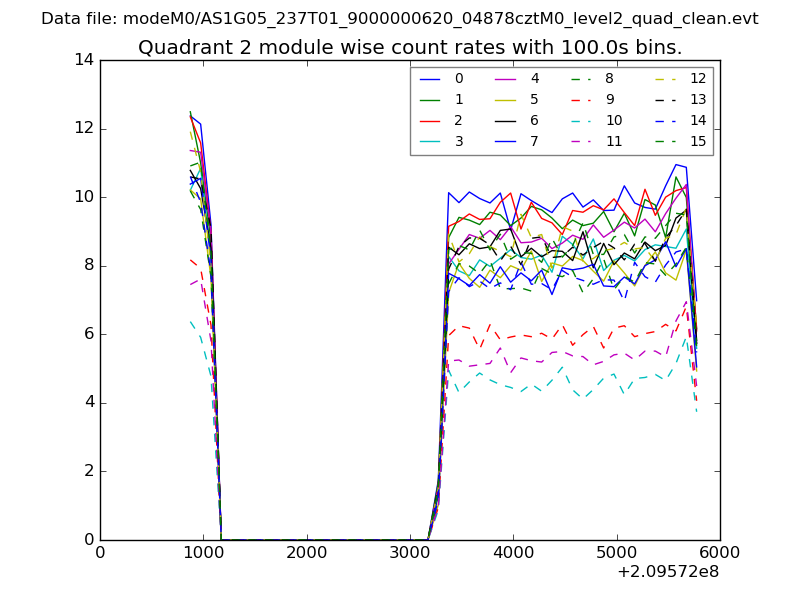
| Module-wise count rates for Quadrant B Data is divided into 100 sec bins |
 |
 |
| Module-wise count rates for Quadrant C Data is divided into 100 sec bins |
 |
 |
| Module-wise count rates for Quadrant D Data is divided into 100 sec bins |
 |
 |
| Parameter | Plot |
|---|---|
| CZT HV Monitor | 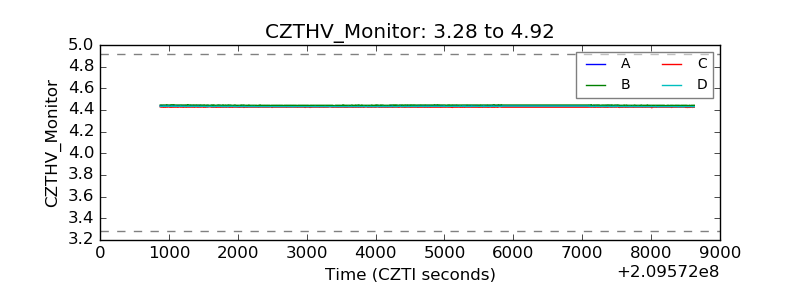 |
| D_VDD | 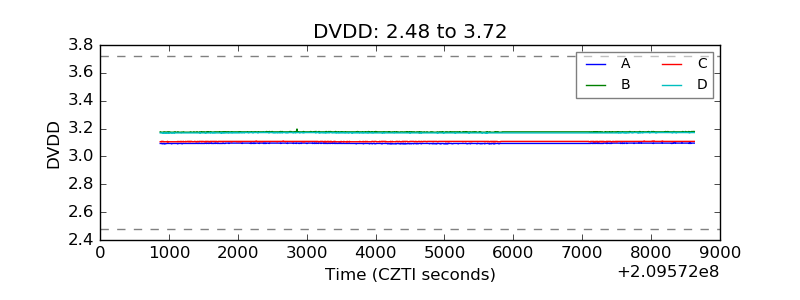 |
| Temperature 1 | 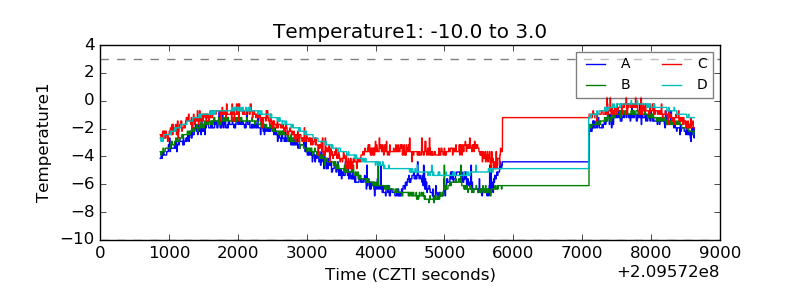 |
| Veto HV Monitor | 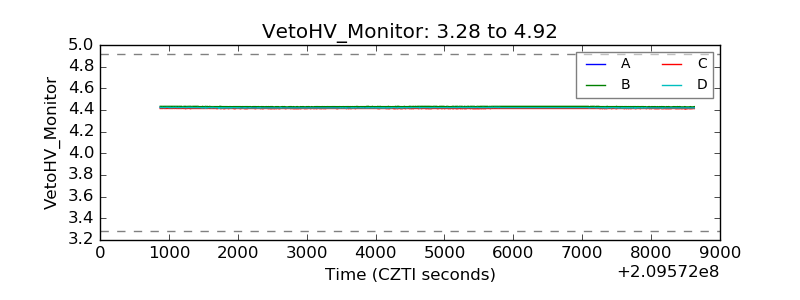 |
| Veto LLD | 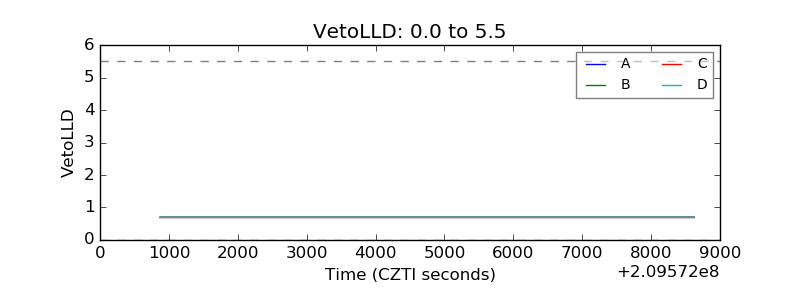 |
| Alpha Counter | 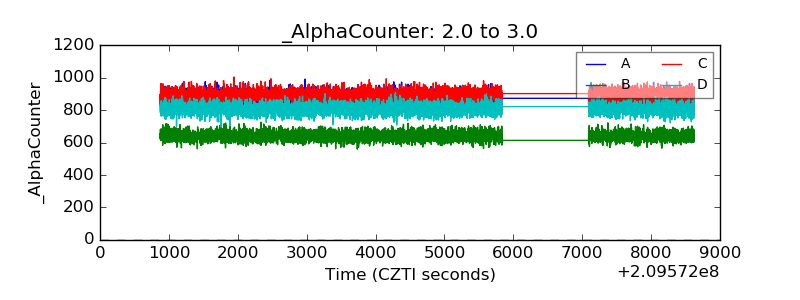 |
| _CPM_Rate | 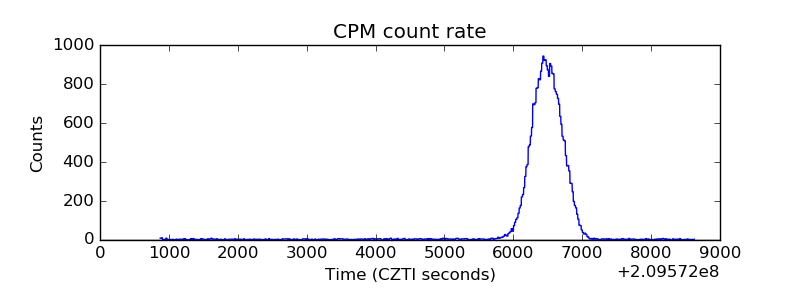 |
| CZT Counter | 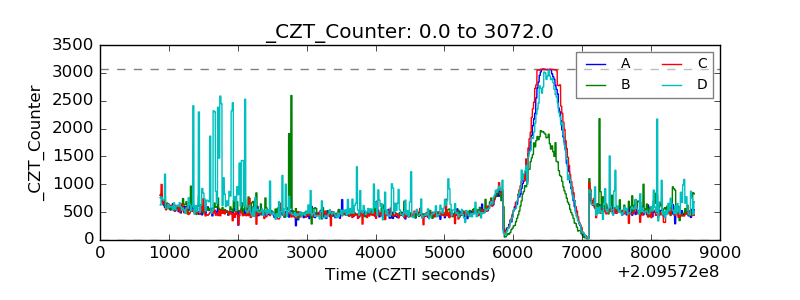 |
| +2.5 Volts monitor |  |
| +5 Volts monitor |  |
| _ROLL_ROT | 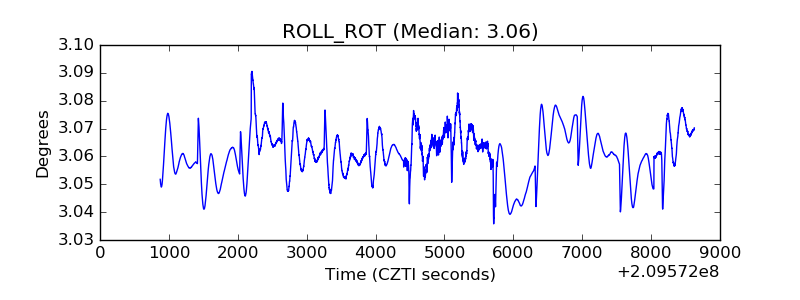 |
| _Roll_DEC | 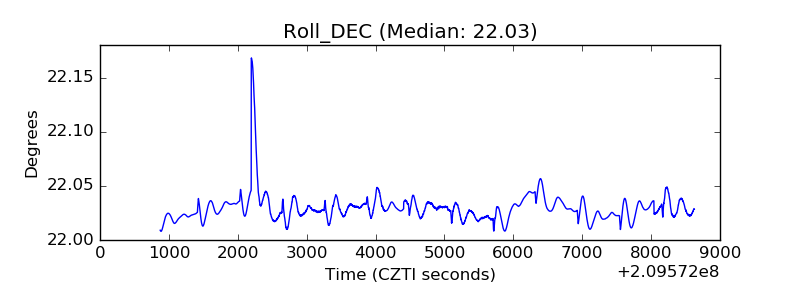 |
| _Roll_RA | 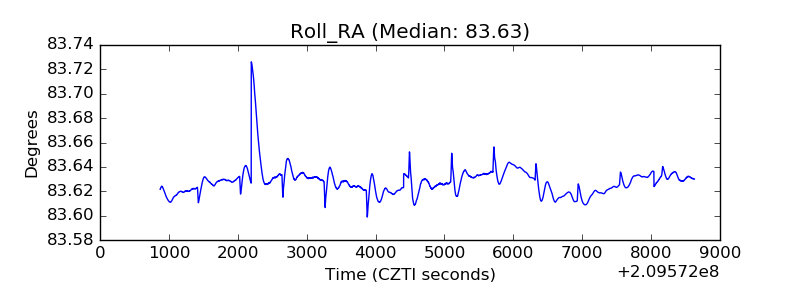 |
| Veto Counter | 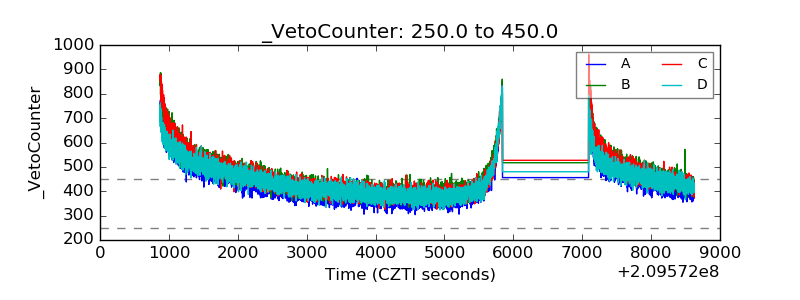 |