| Param | Original file | Final file |
|---|---|---|
| Filename | modeM0/AS1G05_237T01_9000000620_04879cztM0_level2.evt | modeM0/AS1G05_237T01_9000000620_04879cztM0_level2_quad_clean.evt |
| Size (bytes) | 496,494,720 | 64,681,920 |
| Size | 473.5 MB | 61.7 MB |
| Events in quadrant A | 3,299,321 | 381,455 |
| Events in quadrant B | 3,760,144 | 379,932 |
| Events in quadrant C | 3,314,905 | 377,097 |
| Events in quadrant D | 4,212,238 | 357,873 |
| Mode M9 | |||
|---|---|---|---|
| Quadrant | BADHDUFLAG | Total packets | Discarded packets |
| A | 0 | 14 | 0 |
| B | 0 | 14 | 0 |
| C | 0 | 14 | 0 |
| D | 0 | 15 | 0 |
| Mode SS | |||
|---|---|---|---|
| Quadrant | BADHDUFLAG | Total packets | Discarded packets |
| A | 0 | 136 | 0 |
| B | 0 | 136 | 0 |
| C | 0 | 136 | 0 |
| D | 0 | 136 | 0 |
| Mode M0 | |||
|---|---|---|---|
| Quadrant | BADHDUFLAG | Total packets | Discarded packets |
| A | 0 | 13954 | 3 |
| B | 0 | 15296 | 2 |
| C | 0 | 14114 | 2 |
| D | 0 | 16883 | 2 |
| Quadrant | Total seconds | Saturated seconds | Saturation percentage |
|---|---|---|---|
| A | 6619 | 128 | 1.933827% |
| B | 6619 | 154 | 2.326635% |
| C | 6619 | 111 | 1.676990% |
| D | 6619 | 263 | 3.973410% |
Noise dominated data is calculated using 1-second bins in cleaned event files. If a bin has >2000 counts, and if more than 50% of those come from <1% of pixels, then it is considered to be noise-dominated and hence unusable.
| Quadrant | # 1 sec bins | Bins with >0 counts | Bins with >2000 counts | High rate bins dominated by noise | Noise dominated (total time) | Noise dominated (detector-on time) | Marked lightcurve |
|---|---|---|---|---|---|---|---|
| A | 7744 | 6619 | 0 | 0 | 0.00% | 0.00% | 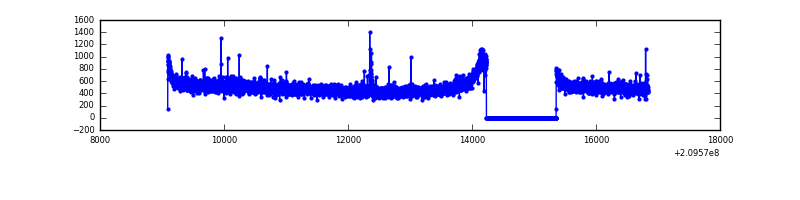 |
| B | 7744 | 6619 | 14 | 14 | 0.18% | 0.21% |  |
| C | 7744 | 6619 | 8 | 8 | 0.10% | 0.12% | 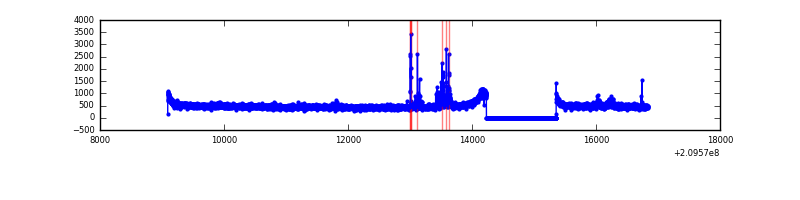 |
| D | 7744 | 6619 | 123 | 123 | 1.59% | 1.86% | 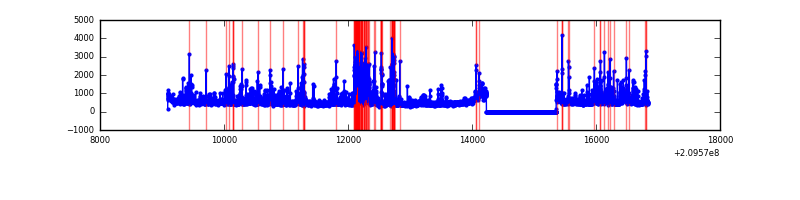 |
Top three noisy pixels from each quadrant. If the there are fewer than three noisy pixels in the level2.evt file, extra rows are filled as -1
| Pixel properties | Quadrant properties | ||||||
|---|---|---|---|---|---|---|---|
| Quadrant | DetID | PixID | Counts | Sigma | Mean | Median | Sigma |
| A | 8 | 15 | 32180 | 180.78 | 844 | 829 | 173.4 |
| A | 0 | 50 | 11537 | 61.75 | 844 | 829 | 173.4 |
| A | 12 | 194 | 8606 | 44.84 | 844 | 829 | 173.4 |
| B | 4 | 80 | 233748 | 1431.63 | 848 | 829 | 162.7 |
| B | 15 | 204 | 118415 | 722.74 | 848 | 829 | 162.7 |
| B | 10 | 16 | 31919 | 191.09 | 848 | 829 | 162.7 |
| C | 9 | 247 | 114754 | 600.53 | 817 | 822 | 189.7 |
| C | 13 | 61 | 6767 | 31.34 | 817 | 822 | 189.7 |
| C | 12 | 4 | 3511 | 14.17 | 817 | 822 | 189.7 |
| D | 13 | 235 | 429581 | 2123.63 | 816 | 793 | 201.9 |
| D | 2 | 136 | 131984 | 649.74 | 816 | 793 | 201.9 |
| D | 2 | 234 | 125304 | 616.66 | 816 | 793 | 201.9 |
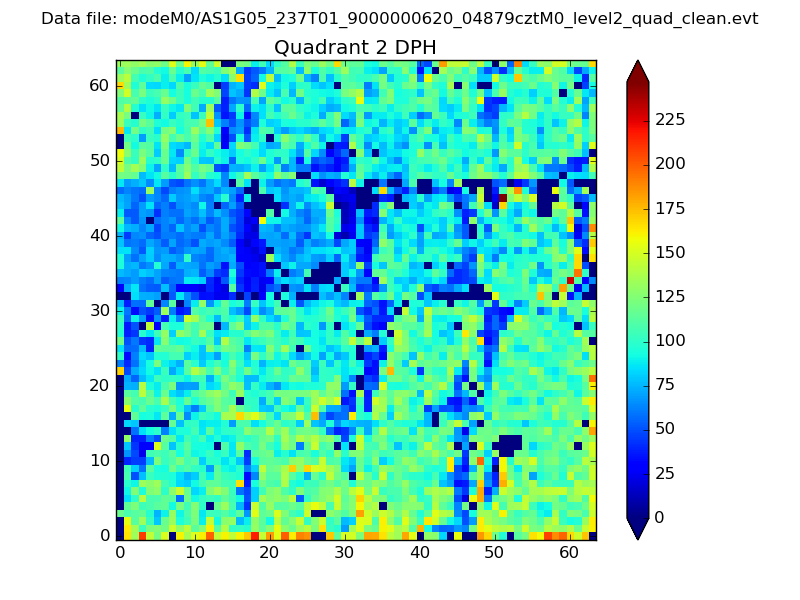
Histogram calculated using DETX and DETY for each event in the final _common_clean file
| Quadrant A | 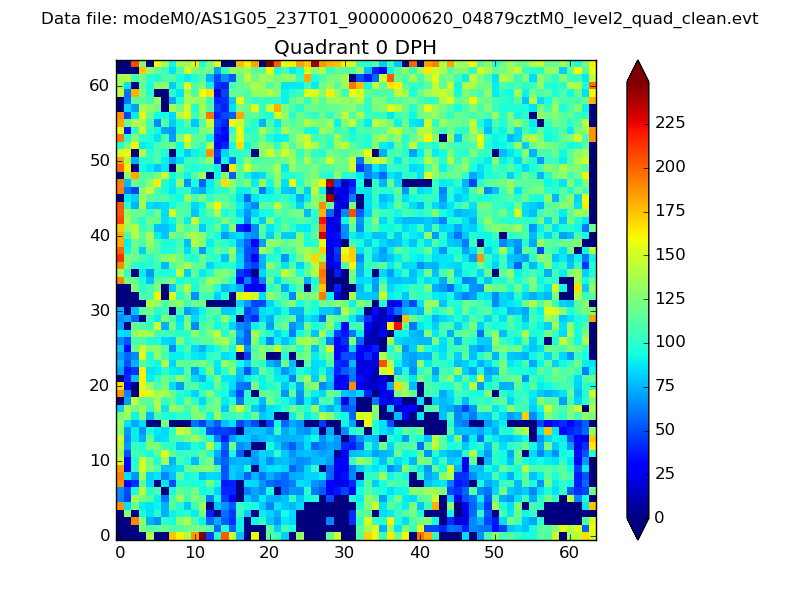 |
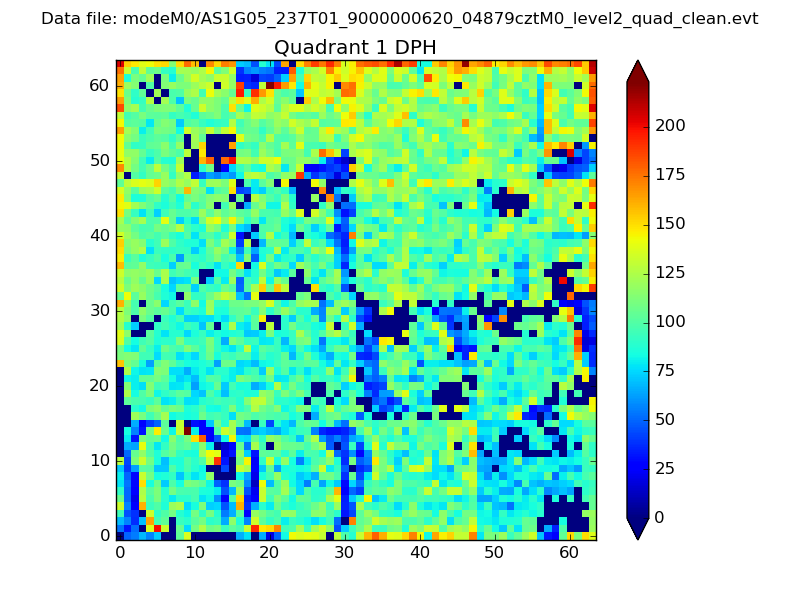 |
Quadrant B |
|---|---|---|---|
| Quadrant D | 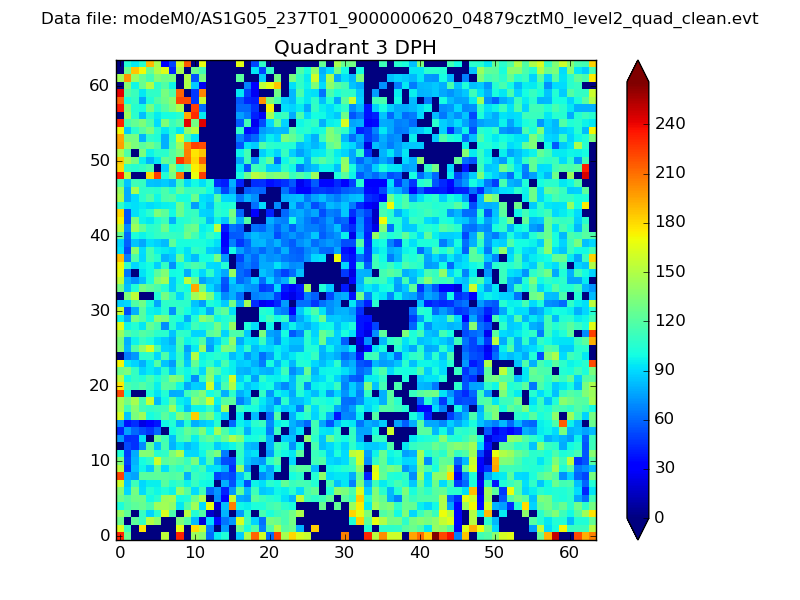 |
 |
Quadrant C |
| Plot type | Count rate plots | Images |
|---|---|---|
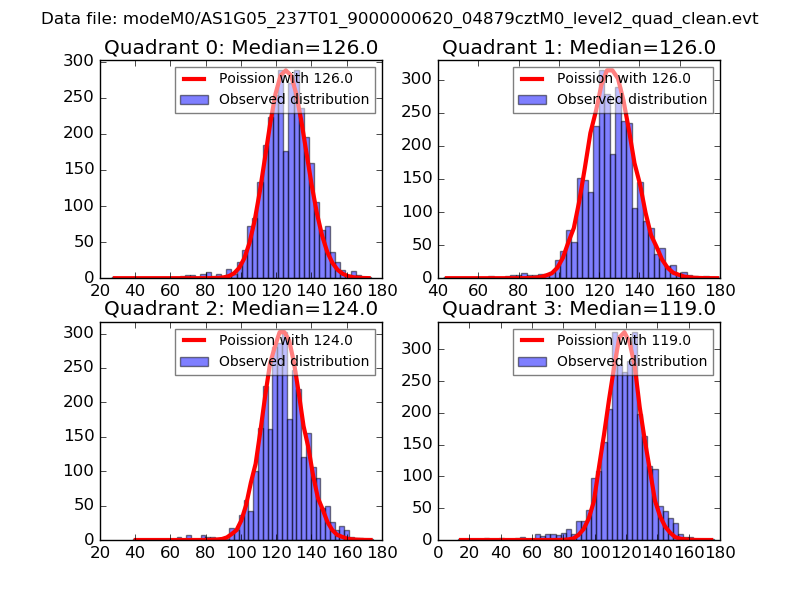
| Comparison with Poisson distribution Blue bars denote a histogram of data divided into 1 sec bins. Red curve is a Poisson curve with rate = median count rate of data. |
 |
 |
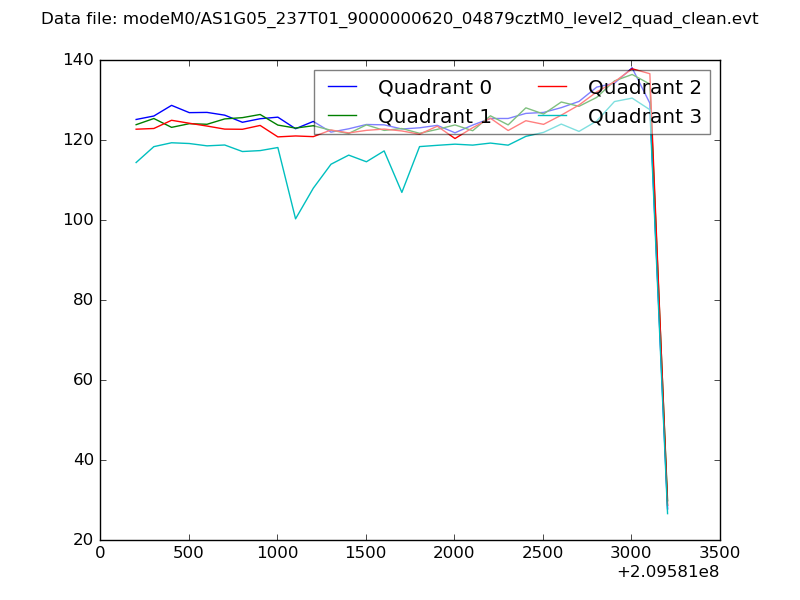
| Quadrant-wise count rates Data is divided into 100 sec bins |
 |
|
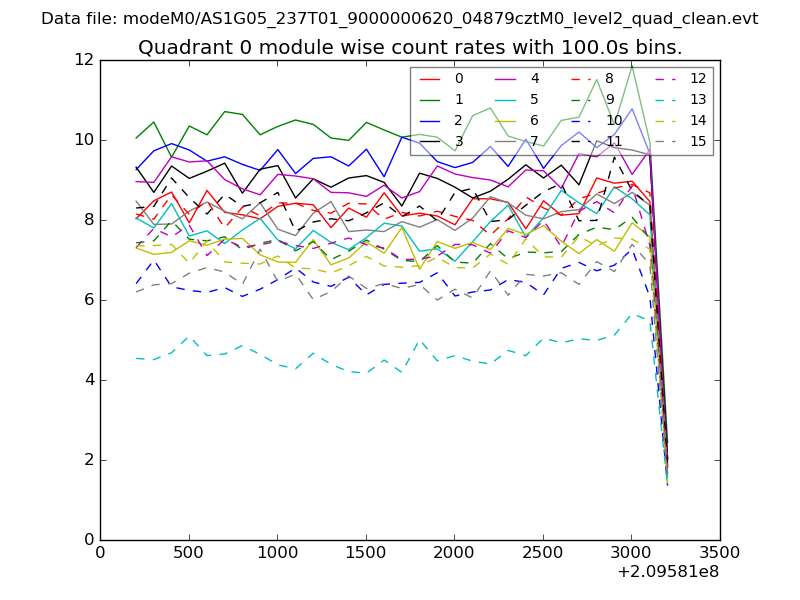
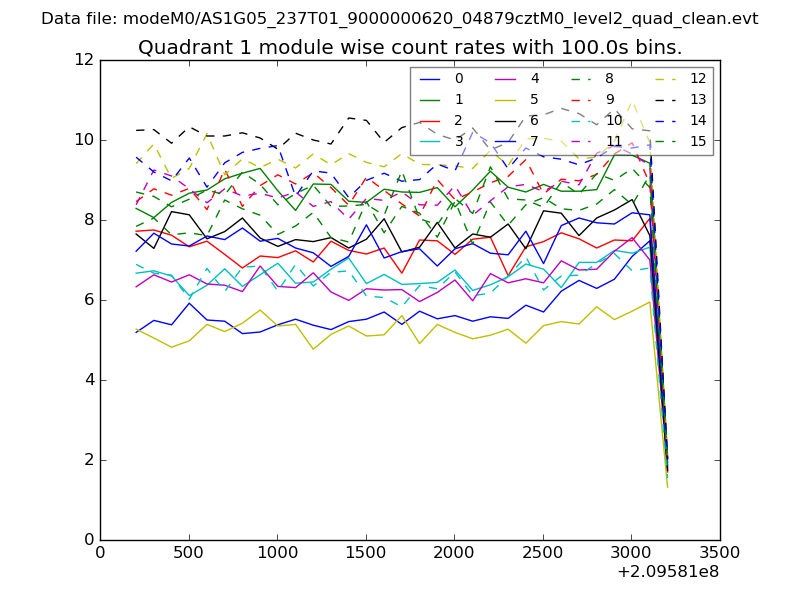
| Module-wise count rates for Quadrant A Data is divided into 100 sec bins |
 |
 |
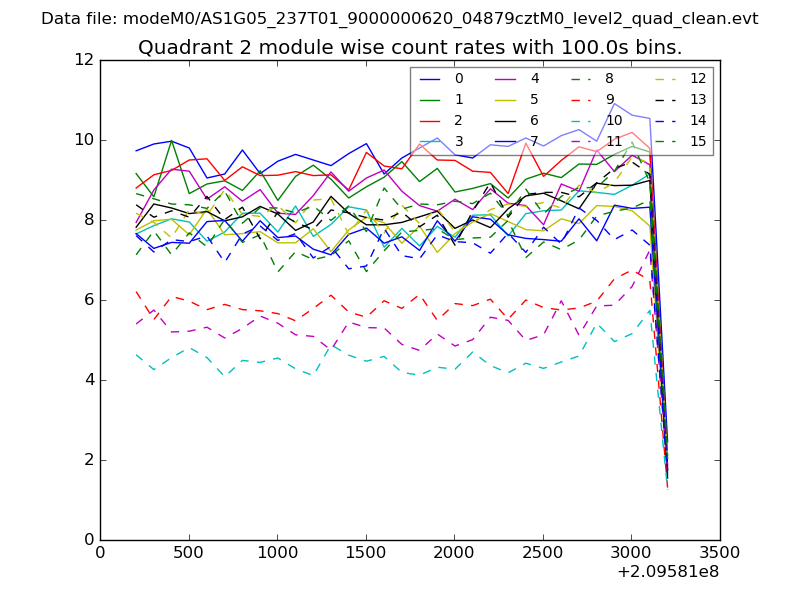
| Module-wise count rates for Quadrant B Data is divided into 100 sec bins |
 |
 |
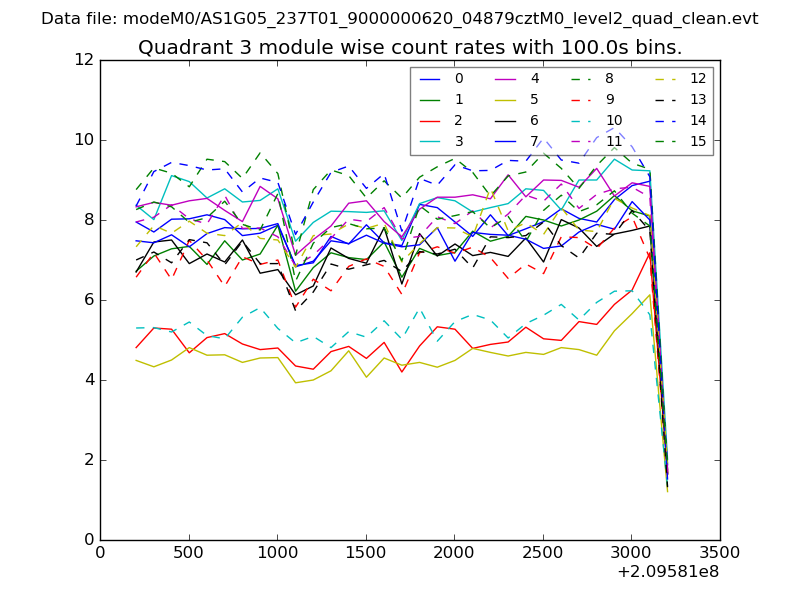
| Module-wise count rates for Quadrant C Data is divided into 100 sec bins |
 |
 |
| Module-wise count rates for Quadrant D Data is divided into 100 sec bins |
 |
 |
| Parameter | Plot |
|---|---|
| CZT HV Monitor | 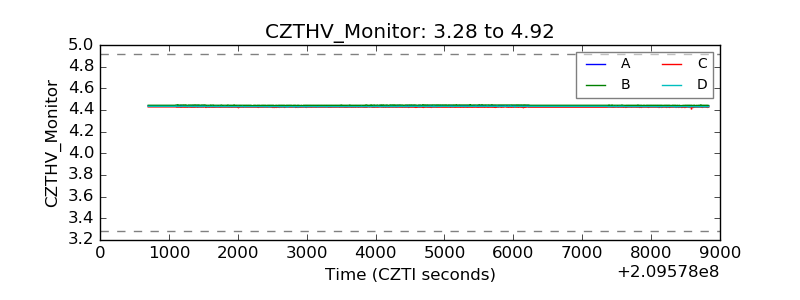 |
| D_VDD | 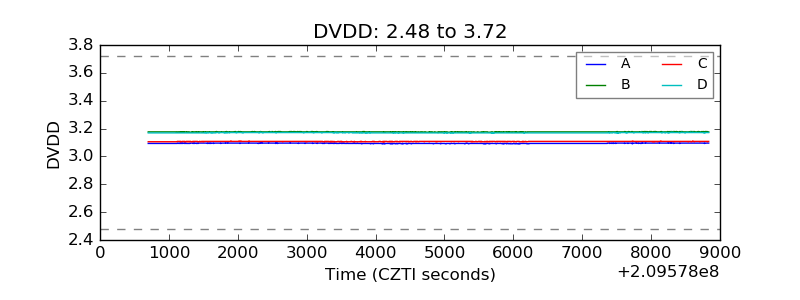 |
| Temperature 1 | 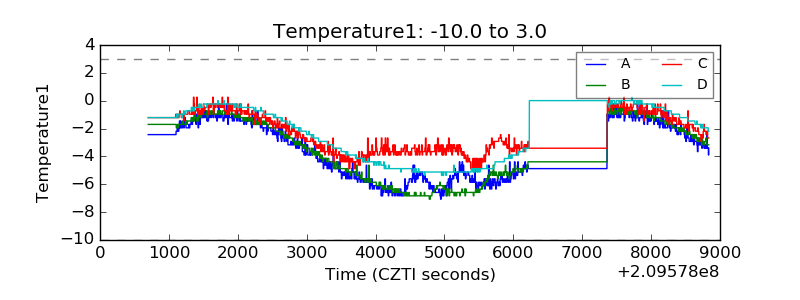 |
| Veto HV Monitor | 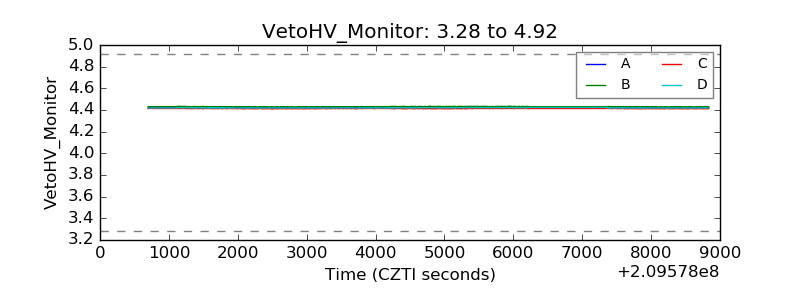 |
| Veto LLD | 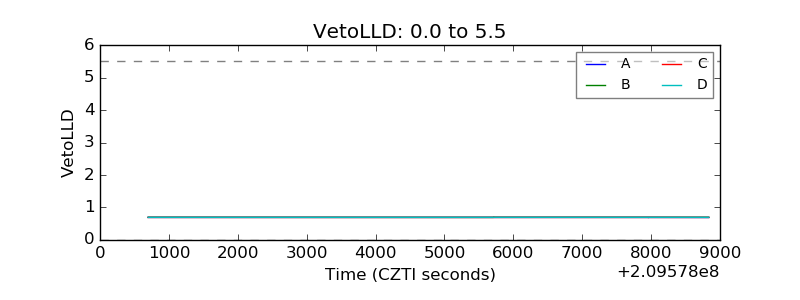 |
| Alpha Counter | 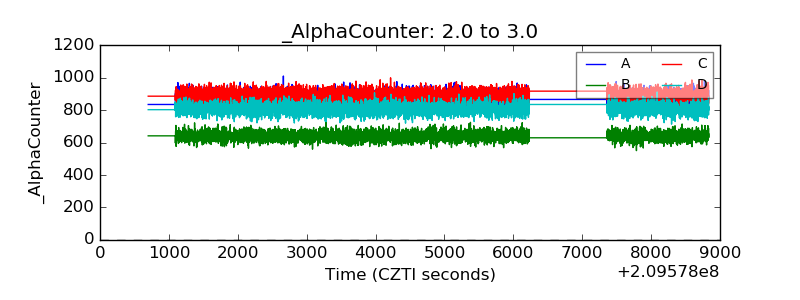 |
| _CPM_Rate | 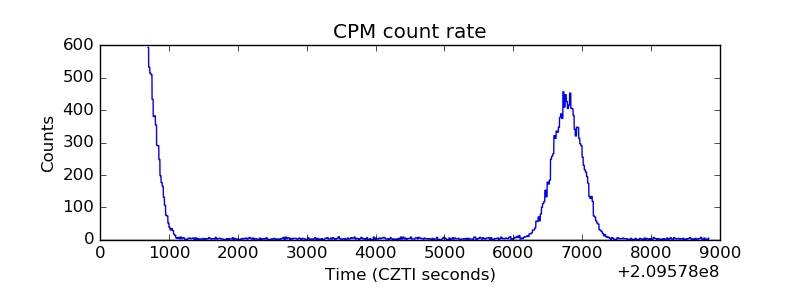 |
| CZT Counter | 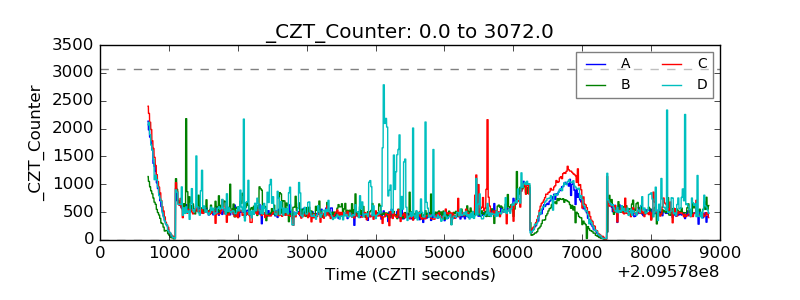 |
| +2.5 Volts monitor |  |
| +5 Volts monitor |  |
| _ROLL_ROT | 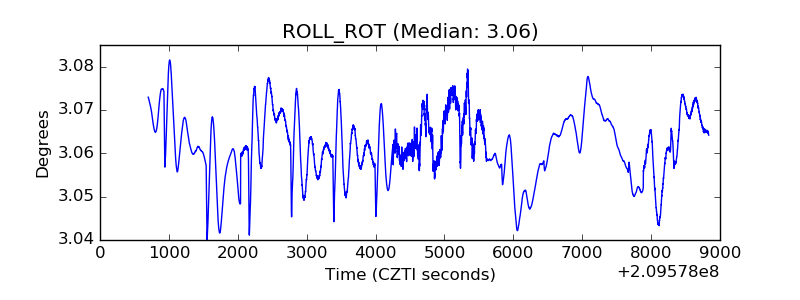 |
| _Roll_DEC | 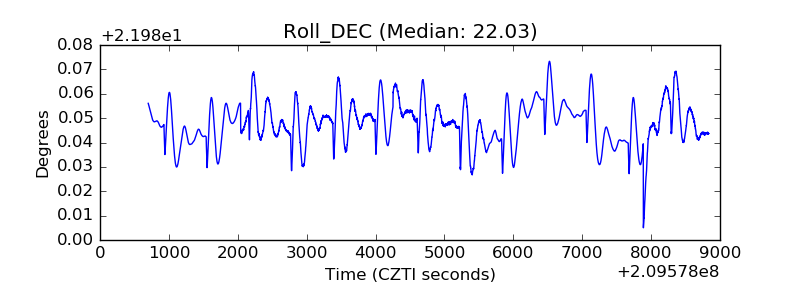 |
| _Roll_RA | 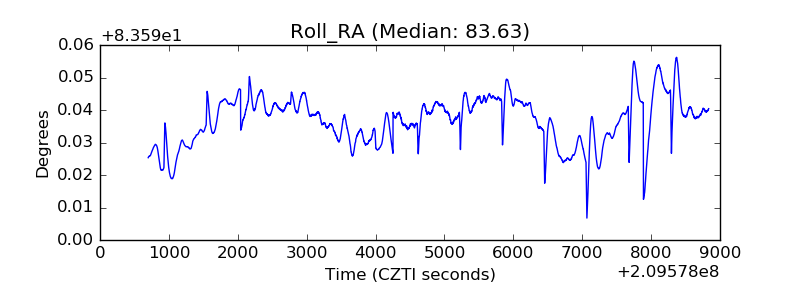 |
| Veto Counter | 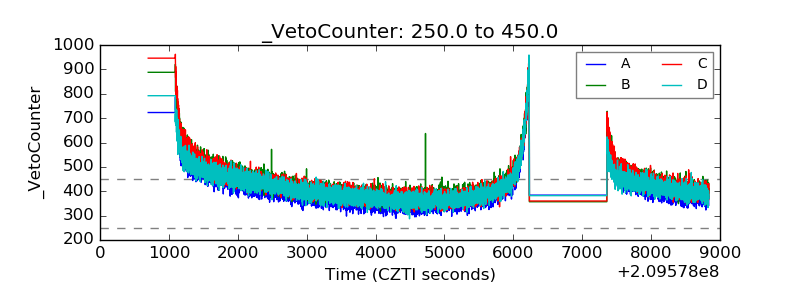 |