| Param | Original file | Final file |
|---|---|---|
| Filename | modeM0/AS1G05_237T01_9000000620_04880cztM0_level2.evt | modeM0/AS1G05_237T01_9000000620_04880cztM0_level2_quad_clean.evt |
| Size (bytes) | 480,473,280 | 73,892,160 |
| Size | 458.2 MB | 70.5 MB |
| Events in quadrant A | 3,028,664 | 456,163 |
| Events in quadrant B | 3,566,249 | 454,864 |
| Events in quadrant C | 3,000,928 | 453,021 |
| Events in quadrant D | 4,520,148 | 426,304 |
| Mode M9 | |||
|---|---|---|---|
| Quadrant | BADHDUFLAG | Total packets | Discarded packets |
| A | 0 | 8 | 0 |
| B | 0 | 8 | 0 |
| C | 0 | 8 | 0 |
| D | 0 | 8 | 0 |
| Mode SS | |||
|---|---|---|---|
| Quadrant | BADHDUFLAG | Total packets | Discarded packets |
| A | 0 | 130 | 0 |
| B | 0 | 130 | 0 |
| C | 0 | 130 | 0 |
| D | 0 | 130 | 0 |
| Mode M0 | |||
|---|---|---|---|
| Quadrant | BADHDUFLAG | Total packets | Discarded packets |
| A | 0 | 13200 | 2 |
| B | 0 | 14663 | 1 |
| C | 0 | 13201 | 1 |
| D | 0 | 17809 | 1 |
| Quadrant | Total seconds | Saturated seconds | Saturation percentage |
|---|---|---|---|
| A | 6408 | 57 | 0.889513% |
| B | 6408 | 89 | 1.388889% |
| C | 6408 | 45 | 0.702247% |
| D | 6408 | 358 | 5.586767% |
Noise dominated data is calculated using 1-second bins in cleaned event files. If a bin has >2000 counts, and if more than 50% of those come from <1% of pixels, then it is considered to be noise-dominated and hence unusable.
| Quadrant | # 1 sec bins | Bins with >0 counts | Bins with >2000 counts | High rate bins dominated by noise | Noise dominated (total time) | Noise dominated (detector-on time) | Marked lightcurve |
|---|---|---|---|---|---|---|---|
| A | 7273 | 6409 | 0 | 0 | 0.00% | 0.00% | 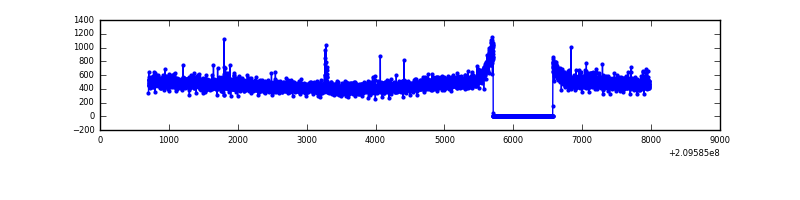 |
| B | 7273 | 6409 | 5 | 5 | 0.07% | 0.08% | 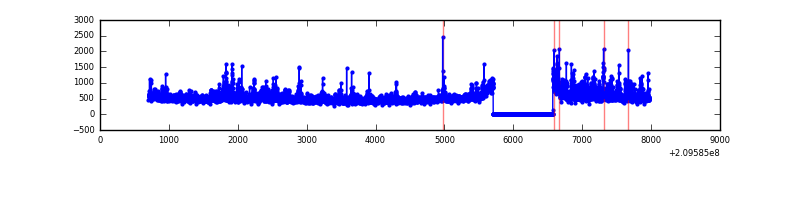 |
| C | 7273 | 6409 | 0 | 0 | 0.00% | 0.00% | 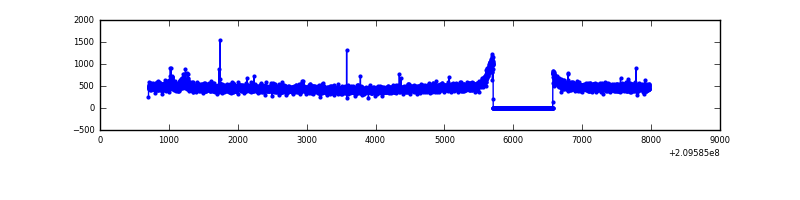 |
| D | 7273 | 6409 | 254 | 254 | 3.49% | 3.96% | 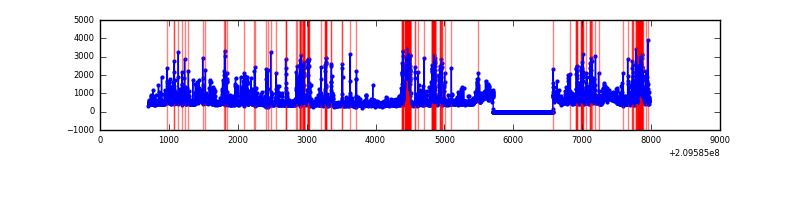 |
Top three noisy pixels from each quadrant. If the there are fewer than three noisy pixels in the level2.evt file, extra rows are filled as -1
| Pixel properties | Quadrant properties | ||||||
|---|---|---|---|---|---|---|---|
| Quadrant | DetID | PixID | Counts | Sigma | Mean | Median | Sigma |
| A | 12 | 133 | 14078 | 82.52 | 778 | 764 | 161.3 |
| A | 8 | 15 | 9997 | 57.23 | 778 | 764 | 161.3 |
| A | 0 | 50 | 8643 | 48.84 | 778 | 764 | 161.3 |
| B | 4 | 80 | 298651 | 1967.64 | 786 | 769 | 151.4 |
| B | 15 | 204 | 150131 | 986.6 | 786 | 769 | 151.4 |
| B | 0 | 183 | 23054 | 147.2 | 786 | 769 | 151.4 |
| C | 9 | 247 | 23851 | 130.44 | 757 | 763 | 177.0 |
| C | 13 | 61 | 6253 | 31.02 | 757 | 763 | 177.0 |
| C | 14 | 67 | 4814 | 22.89 | 757 | 763 | 177.0 |
| D | 1 | 7 | 573338 | 3053.21 | 746 | 723 | 187.5 |
| D | 13 | 235 | 464299 | 2471.81 | 746 | 723 | 187.5 |
| D | 2 | 234 | 256005 | 1361.18 | 746 | 723 | 187.5 |
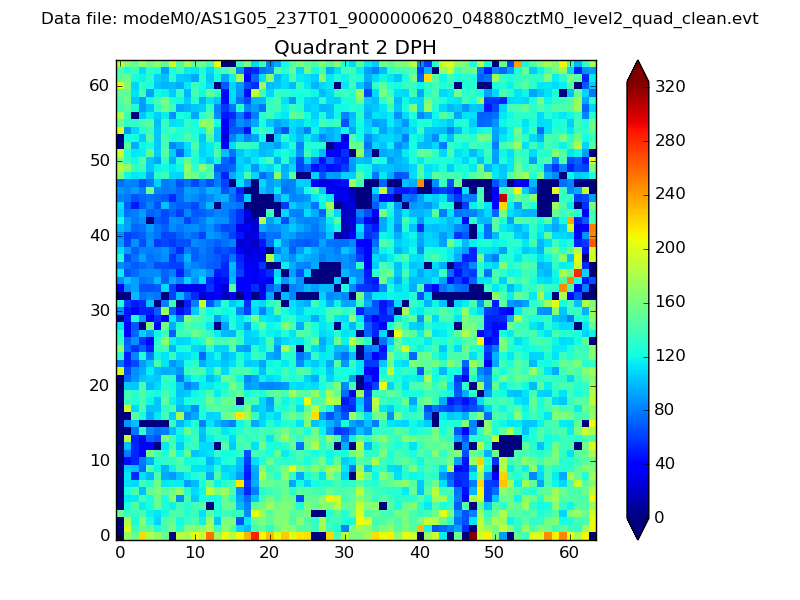
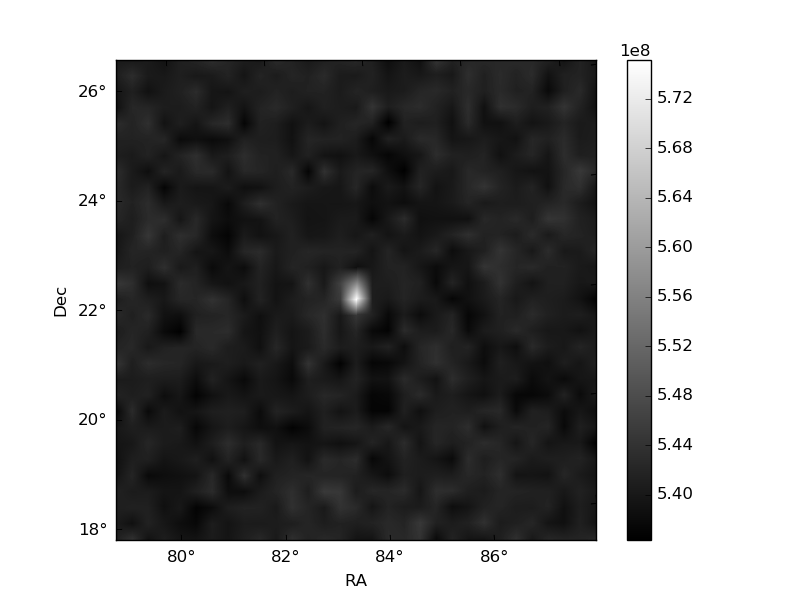
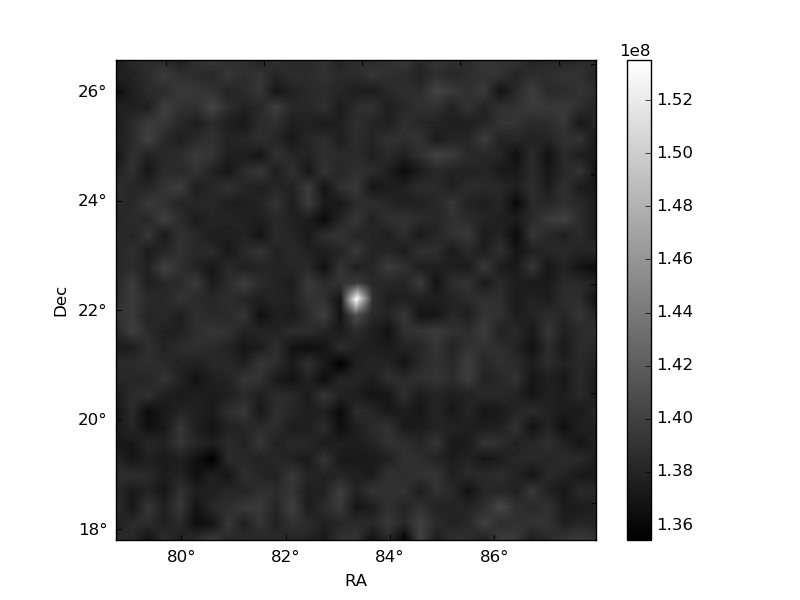
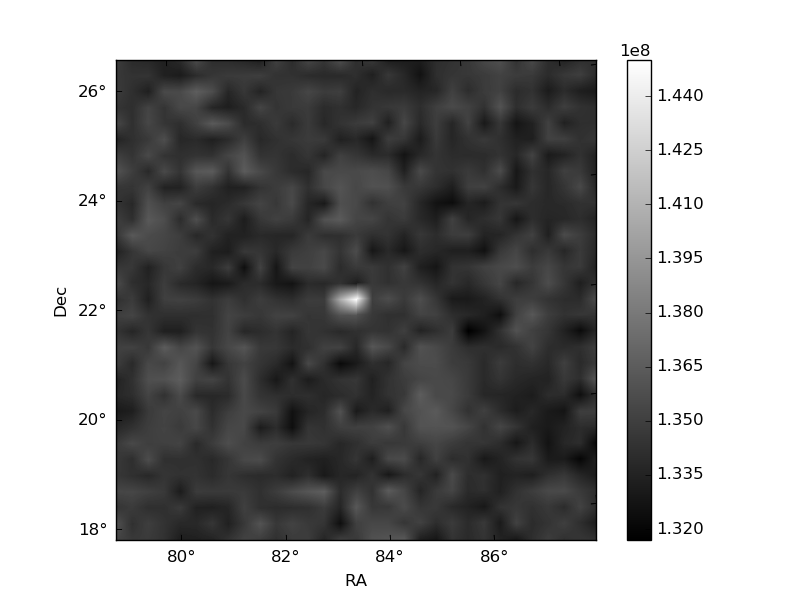
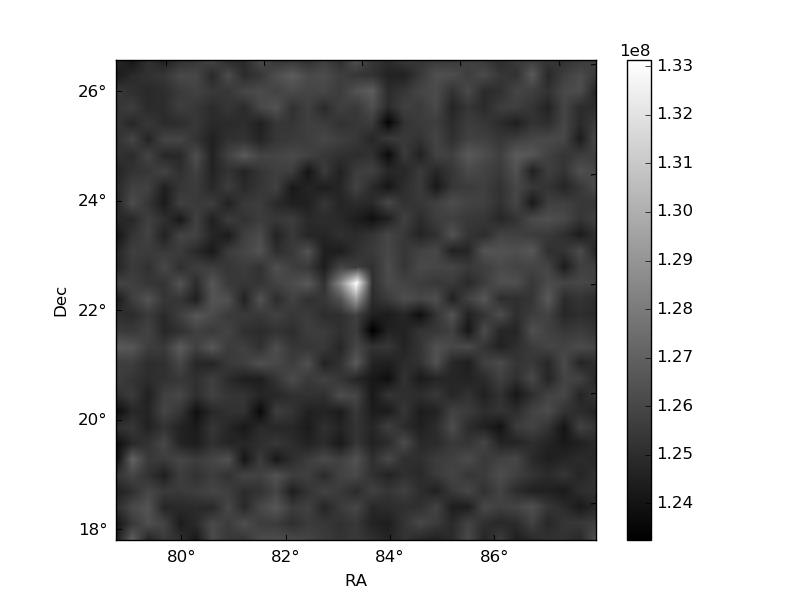
Histogram calculated using DETX and DETY for each event in the final _common_clean file
| Quadrant A | 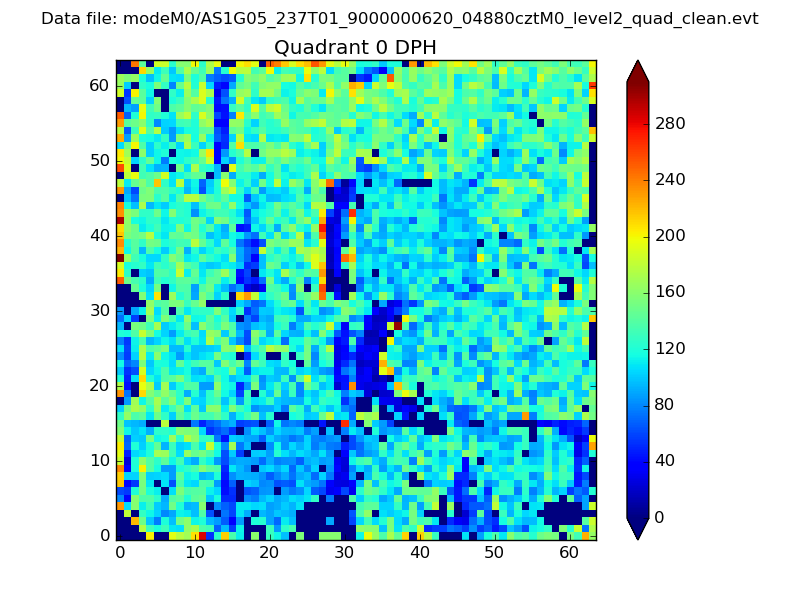 |
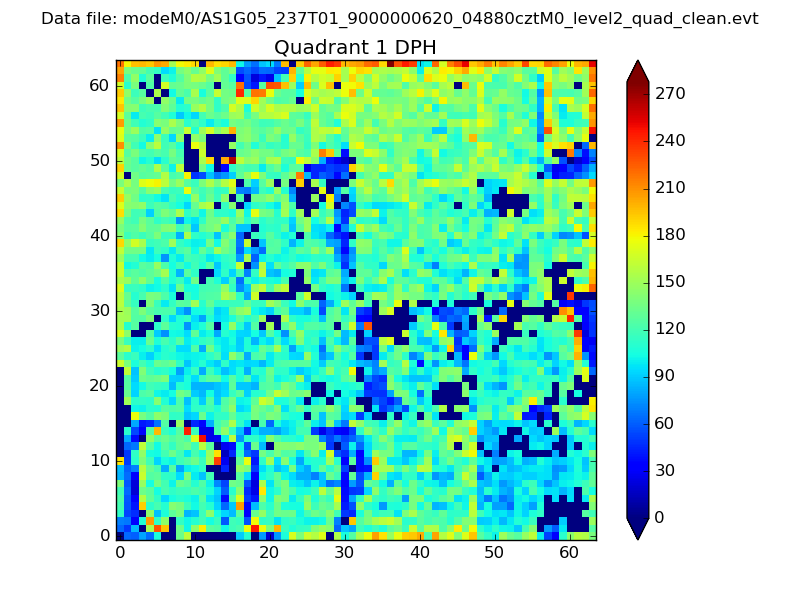 |
Quadrant B |
|---|---|---|---|
| Quadrant D | 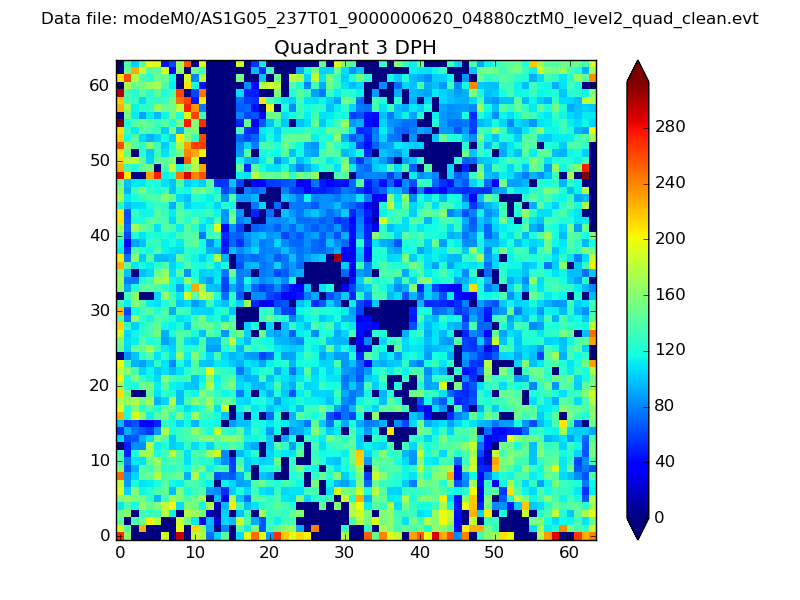 |
 |
Quadrant C |
| Plot type | Count rate plots | Images |
|---|---|---|
| Comparison with Poisson distribution Blue bars denote a histogram of data divided into 1 sec bins. Red curve is a Poisson curve with rate = median count rate of data. |
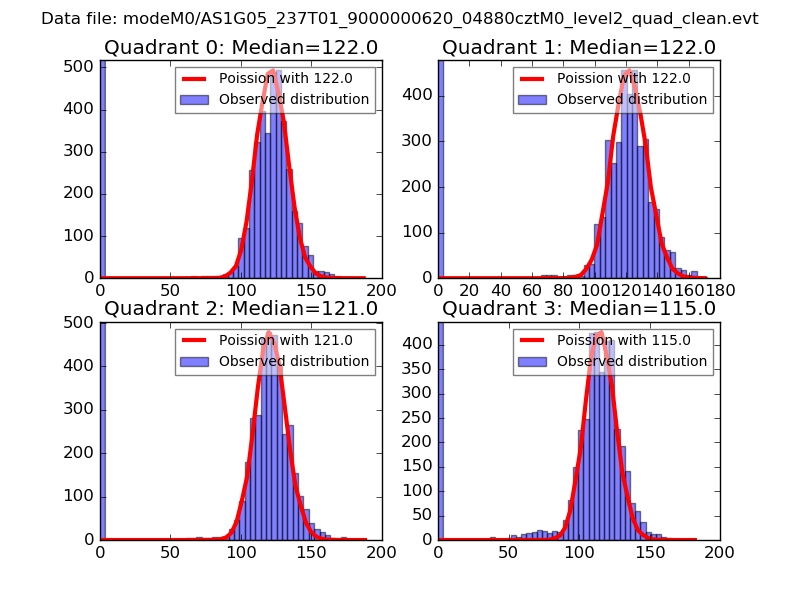 |
 |
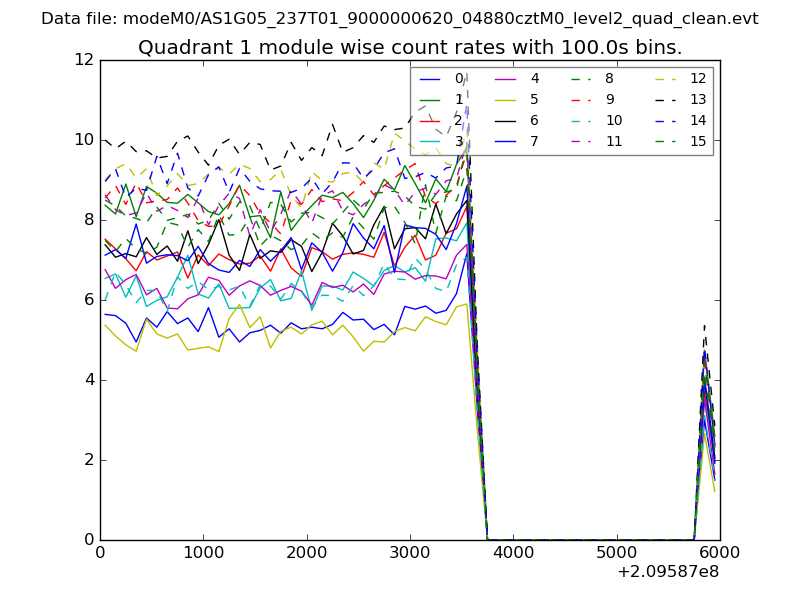
| Quadrant-wise count rates Data is divided into 100 sec bins |
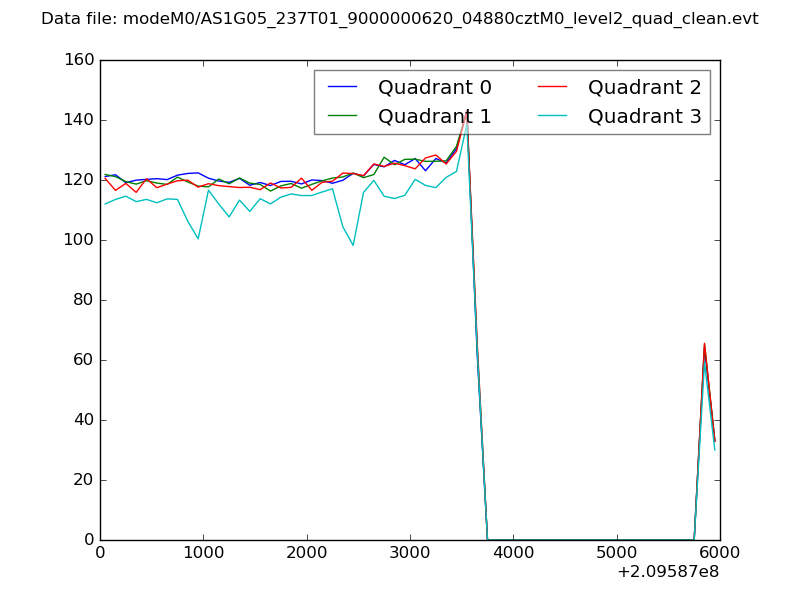 |
|
| Module-wise count rates for Quadrant A Data is divided into 100 sec bins |
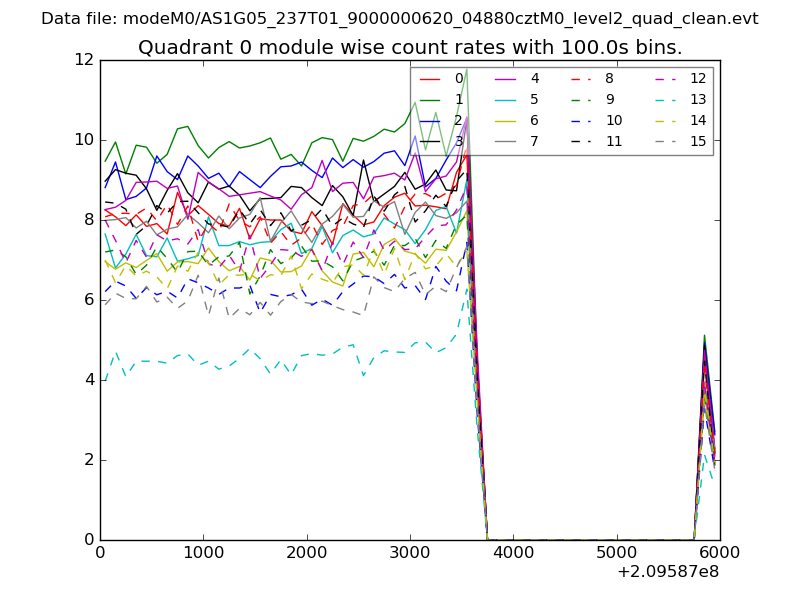 |
 |
| Module-wise count rates for Quadrant B Data is divided into 100 sec bins |
 |
 |
| Module-wise count rates for Quadrant C Data is divided into 100 sec bins |
 |
 |
| Module-wise count rates for Quadrant D Data is divided into 100 sec bins |
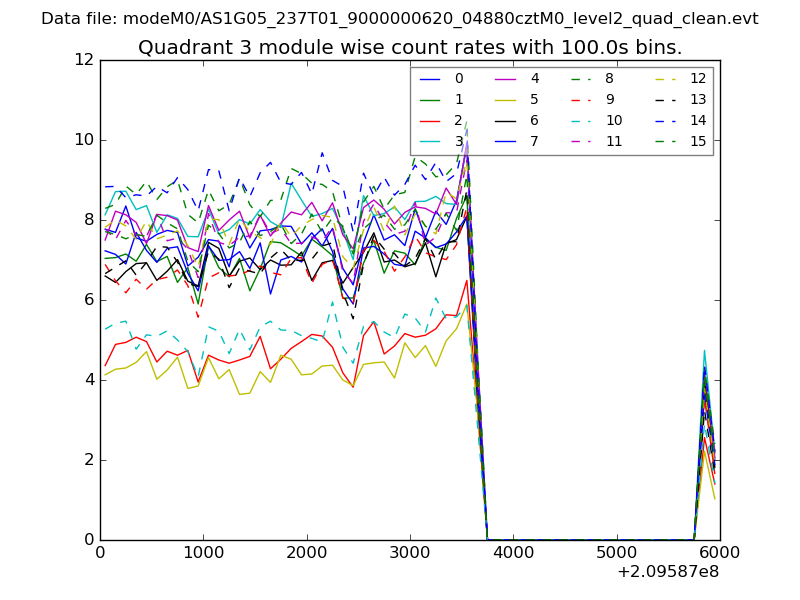 |
 |
| Parameter | Plot |
|---|---|
| CZT HV Monitor | 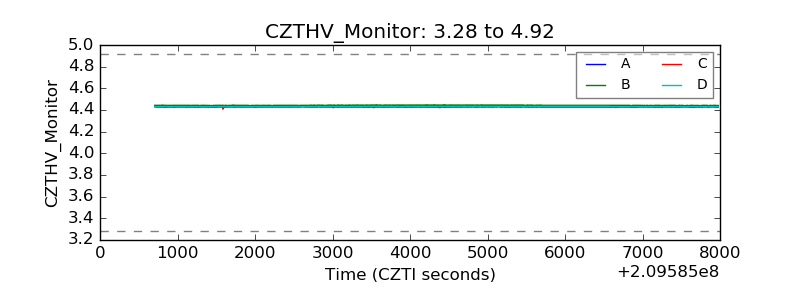 |
| D_VDD | 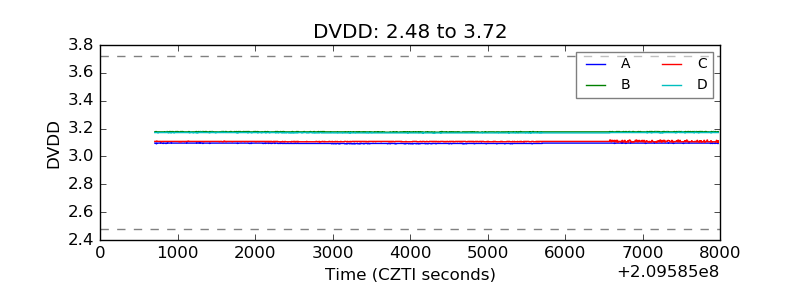 |
| Temperature 1 | 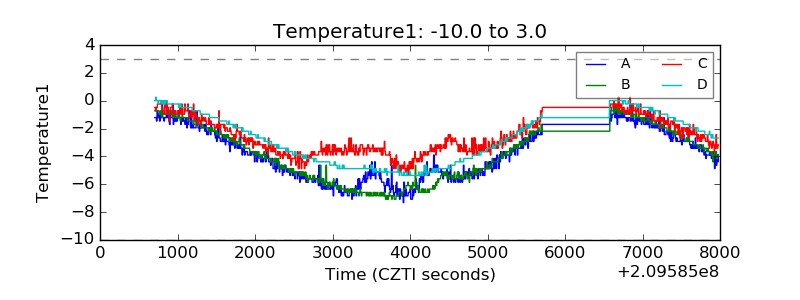 |
| Veto HV Monitor | 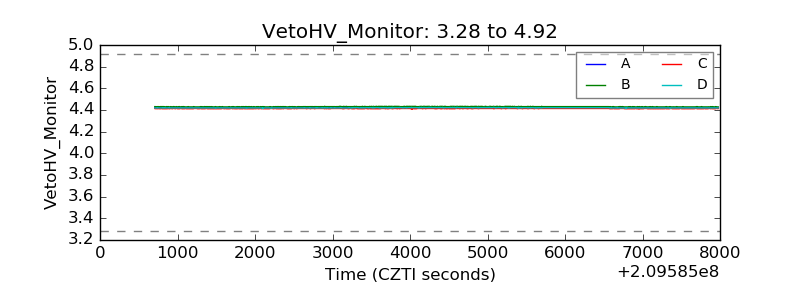 |
| Veto LLD | 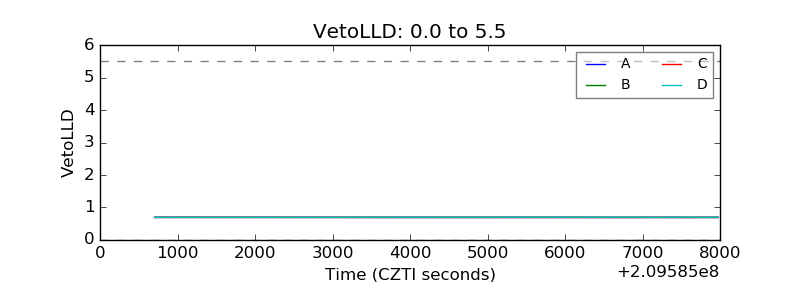 |
| Alpha Counter | 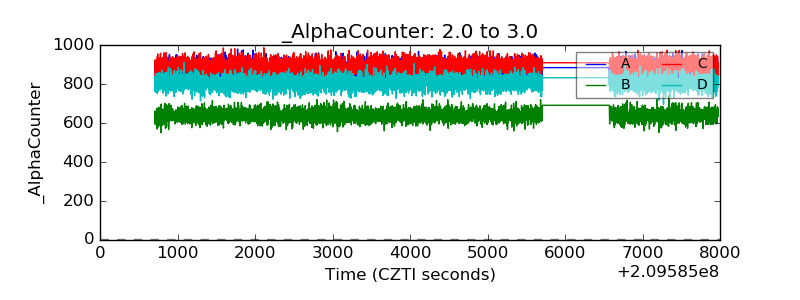 |
| _CPM_Rate | 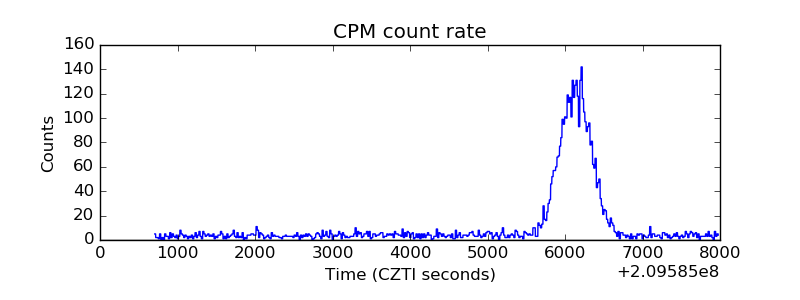 |
| CZT Counter | 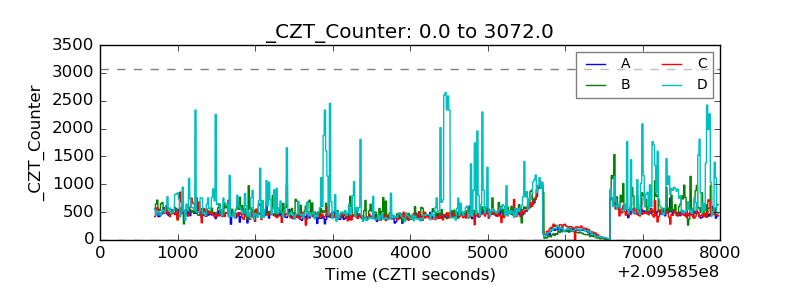 |
| +2.5 Volts monitor |  |
| +5 Volts monitor |  |
| _ROLL_ROT | 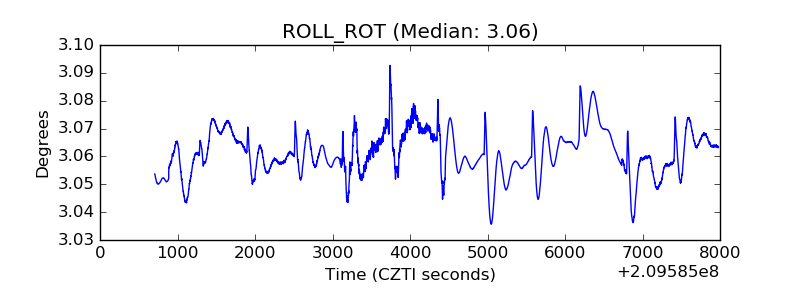 |
| _Roll_DEC | 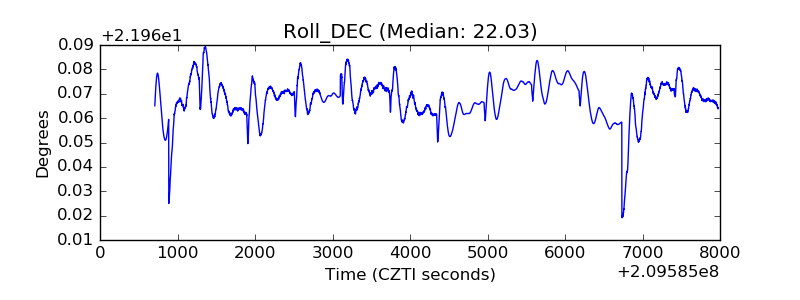 |
| _Roll_RA | 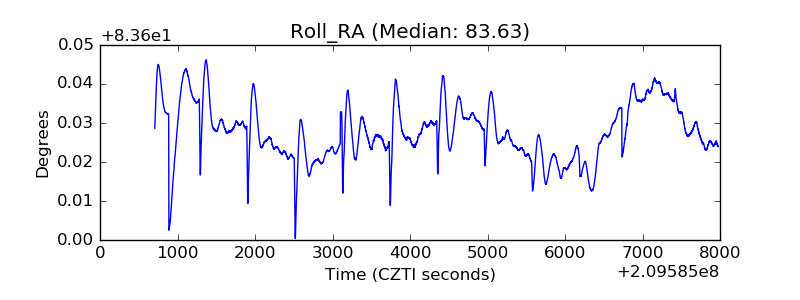 |
| Veto Counter | 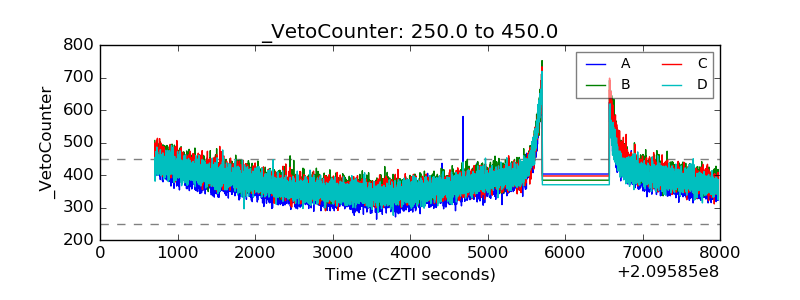 |