| Param | Original file | Final file |
|---|---|---|
| Filename | modeM0/AS1G05_237T01_9000000620_04881cztM0_level2.evt | modeM0/AS1G05_237T01_9000000620_04881cztM0_level2_quad_clean.evt |
| Size (bytes) | 571,740,480 | 84,856,320 |
| Size | 545.3 MB | 80.9 MB |
| Events in quadrant A | 3,774,088 | 520,931 |
| Events in quadrant B | 4,276,400 | 520,947 |
| Events in quadrant C | 3,484,901 | 517,235 |
| Events in quadrant D | 5,275,300 | 492,827 |
| Mode M9 | |||
|---|---|---|---|
| Quadrant | BADHDUFLAG | Total packets | Discarded packets |
| A | 0 | 13 | 0 |
| B | 0 | 13 | 0 |
| C | 0 | 13 | 0 |
| D | 0 | 13 | 0 |
| Mode SS | |||
|---|---|---|---|
| Quadrant | BADHDUFLAG | Total packets | Discarded packets |
| A | 0 | 154 | 0 |
| B | 0 | 154 | 0 |
| C | 0 | 154 | 0 |
| D | 0 | 154 | 0 |
| Mode M0 | |||
|---|---|---|---|
| Quadrant | BADHDUFLAG | Total packets | Discarded packets |
| A | 0 | 16100 | 3 |
| B | 0 | 17679 | 2 |
| C | 0 | 15381 | 2 |
| D | 0 | 20822 | 2 |
| Quadrant | Total seconds | Saturated seconds | Saturation percentage |
|---|---|---|---|
| A | 7434 | 95 | 1.277912% |
| B | 7434 | 147 | 1.977401% |
| C | 7434 | 63 | 0.847458% |
| D | 7434 | 586 | 7.882701% |
Noise dominated data is calculated using 1-second bins in cleaned event files. If a bin has >2000 counts, and if more than 50% of those come from <1% of pixels, then it is considered to be noise-dominated and hence unusable.
| Quadrant | # 1 sec bins | Bins with >0 counts | Bins with >2000 counts | High rate bins dominated by noise | Noise dominated (total time) | Noise dominated (detector-on time) | Marked lightcurve |
|---|---|---|---|---|---|---|---|
| A | 8789 | 7436 | 8 | 8 | 0.09% | 0.11% | 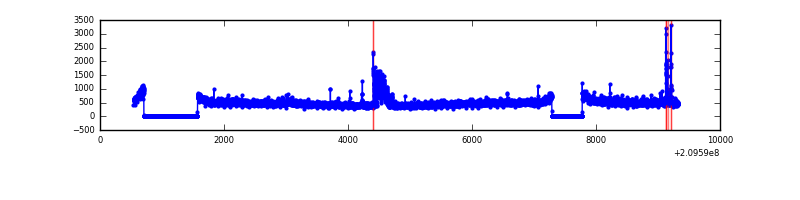 |
| B | 8789 | 7436 | 16 | 16 | 0.18% | 0.22% | 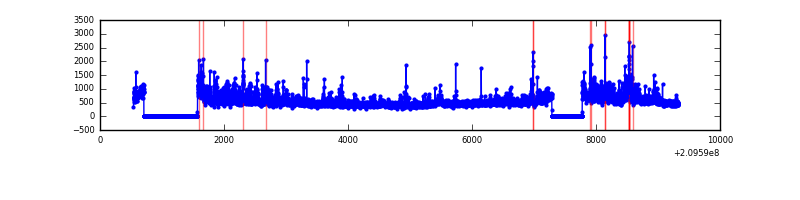 |
| C | 8789 | 7436 | 0 | 0 | 0.00% | 0.00% | 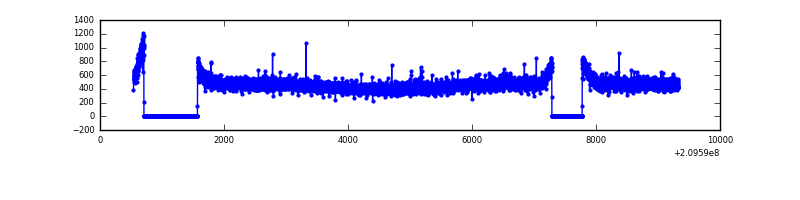 |
| D | 8789 | 7436 | 391 | 391 | 4.45% | 5.26% | 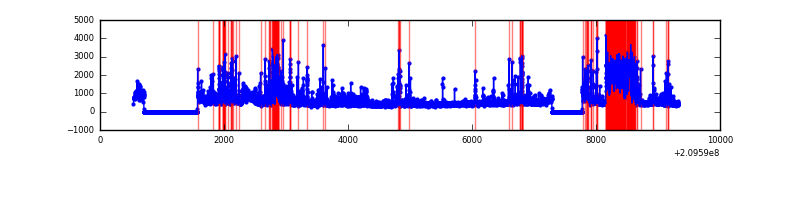 |
Top three noisy pixels from each quadrant. If the there are fewer than three noisy pixels in the level2.evt file, extra rows are filled as -1
| Pixel properties | Quadrant properties | ||||||
|---|---|---|---|---|---|---|---|
| Quadrant | DetID | PixID | Counts | Sigma | Mean | Median | Sigma |
| A | 0 | 31 | 149290 | 785.94 | 910 | 890 | 188.8 |
| A | 15 | 234 | 46576 | 241.96 | 910 | 890 | 188.8 |
| A | 12 | 133 | 35325 | 182.37 | 910 | 890 | 188.8 |
| B | 4 | 80 | 319302 | 1817.84 | 915 | 896 | 175.2 |
| B | 15 | 204 | 156728 | 889.68 | 915 | 896 | 175.2 |
| B | 5 | 6 | 79160 | 446.82 | 915 | 896 | 175.2 |
| C | 8 | 128 | 11556 | 51.76 | 883 | 888 | 206.1 |
| C | 12 | 4 | 8885 | 38.8 | 883 | 888 | 206.1 |
| C | 13 | 61 | 7076 | 30.03 | 883 | 888 | 206.1 |
| D | 1 | 52 | 814995 | 3817.99 | 859 | 833 | 213.2 |
| D | 13 | 235 | 356349 | 1667.18 | 859 | 833 | 213.2 |
| D | 2 | 234 | 253430 | 1184.55 | 859 | 833 | 213.2 |
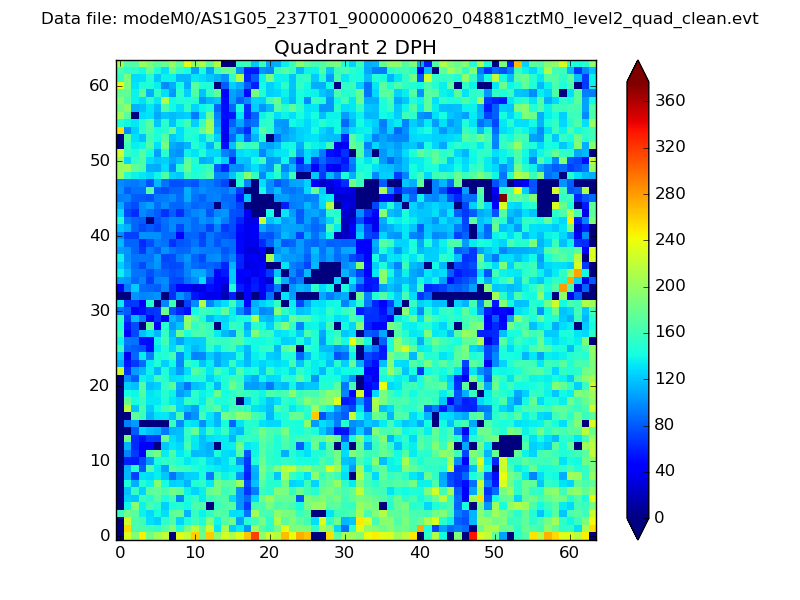
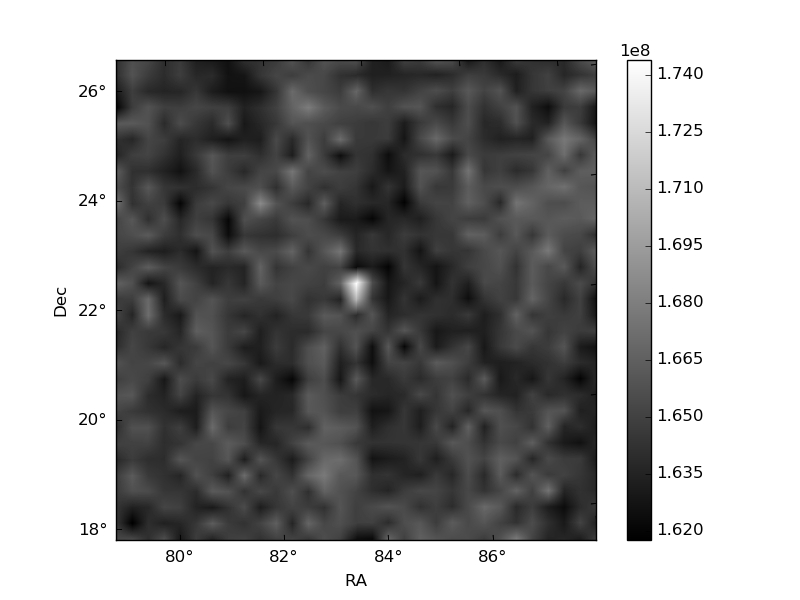
Histogram calculated using DETX and DETY for each event in the final _common_clean file
| Quadrant A | 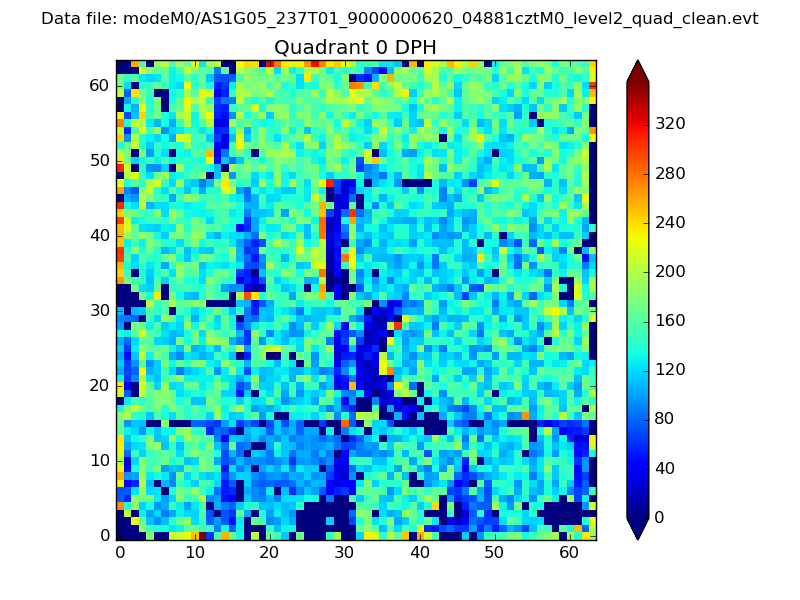 |
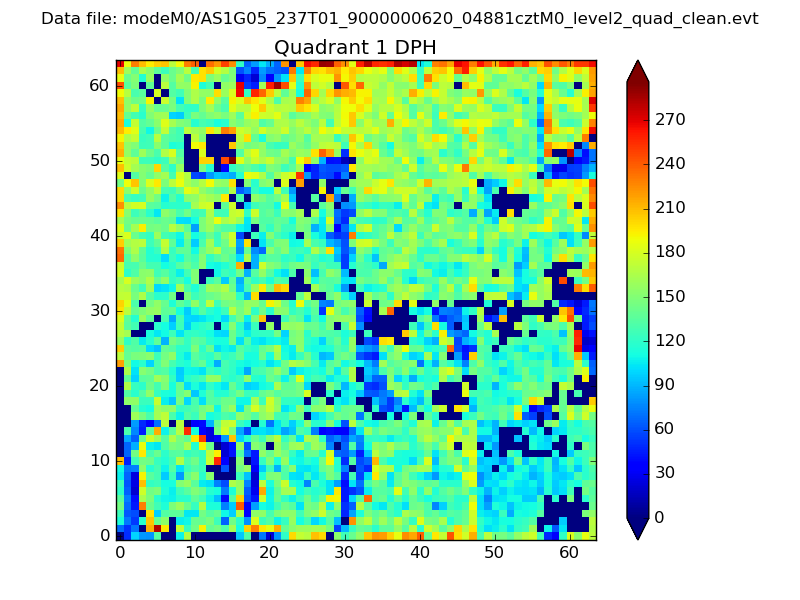 |
Quadrant B |
|---|---|---|---|
| Quadrant D | 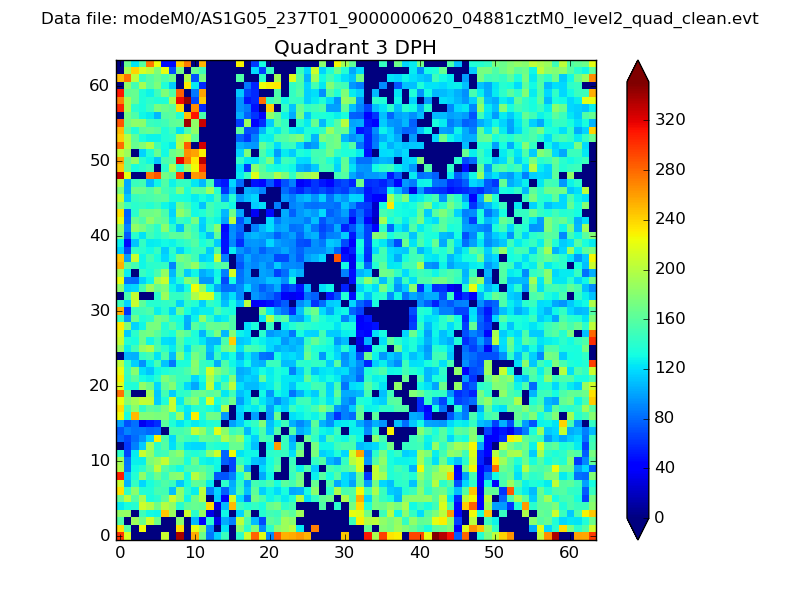 |
 |
Quadrant C |
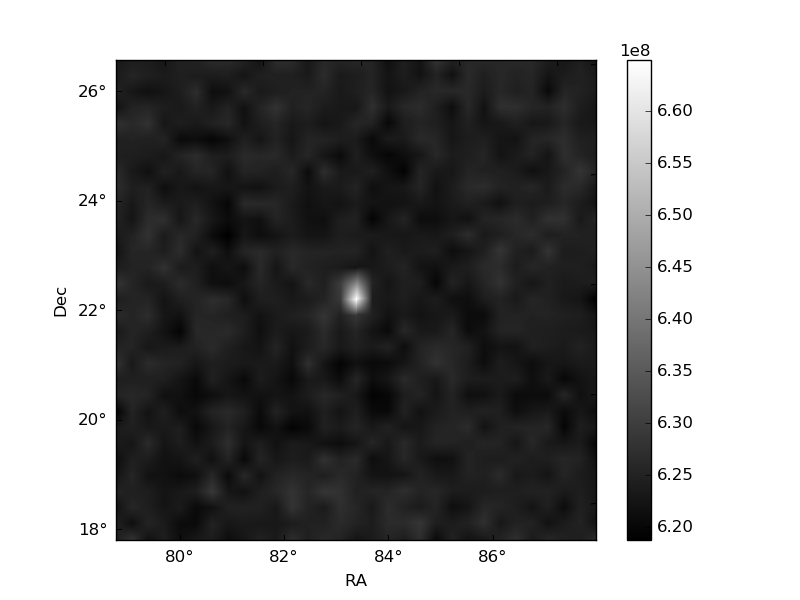
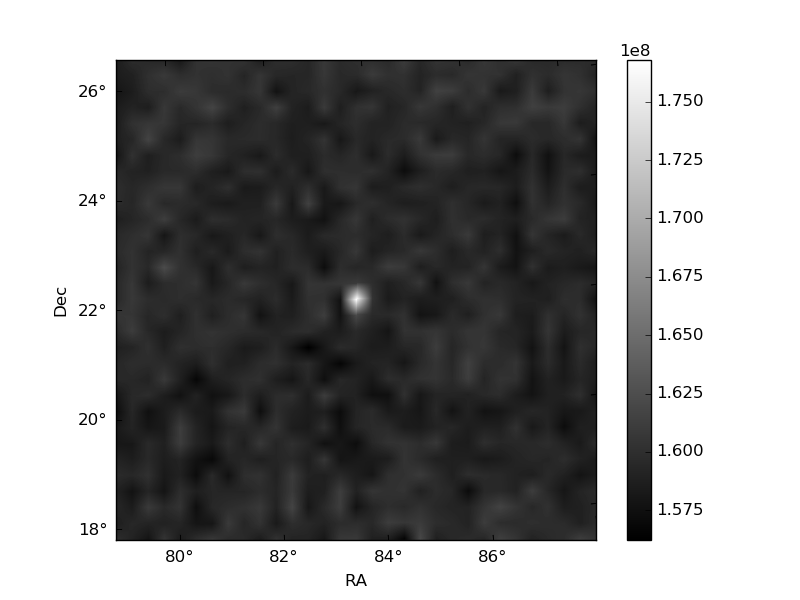
| Plot type | Count rate plots | Images |
|---|---|---|
| Comparison with Poisson distribution Blue bars denote a histogram of data divided into 1 sec bins. Red curve is a Poisson curve with rate = median count rate of data. |
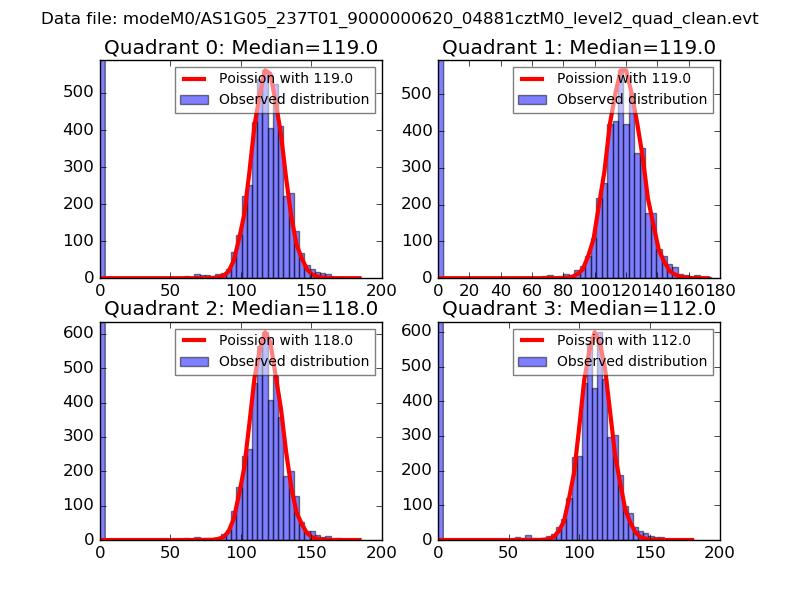 |
 |
| Quadrant-wise count rates Data is divided into 100 sec bins |
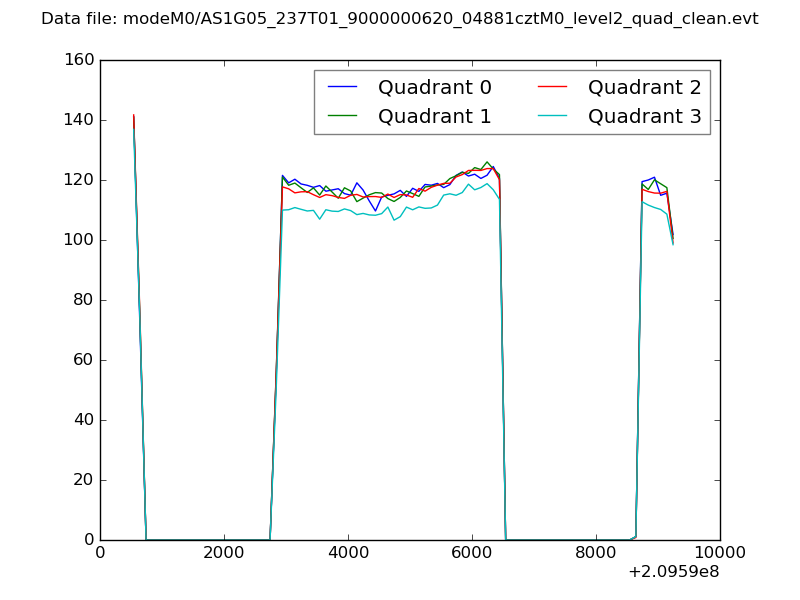 |
|
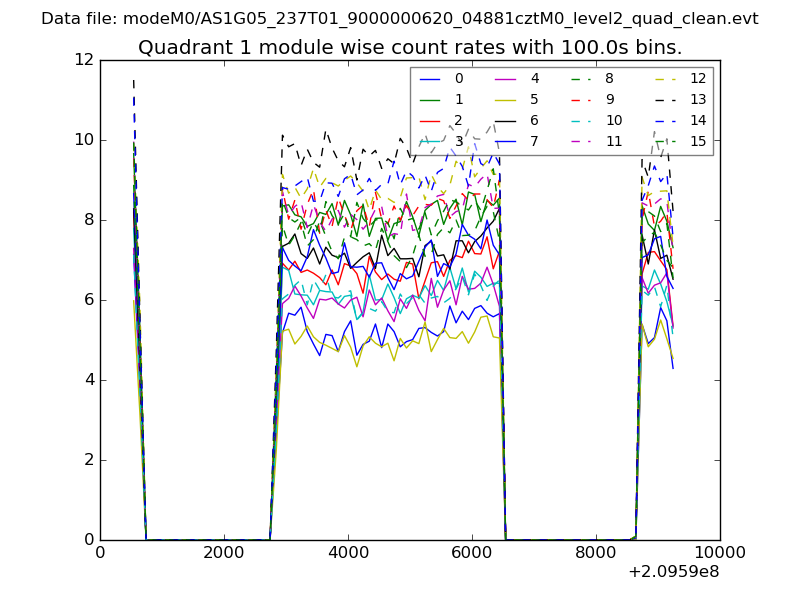
| Module-wise count rates for Quadrant A Data is divided into 100 sec bins |
 |
 |
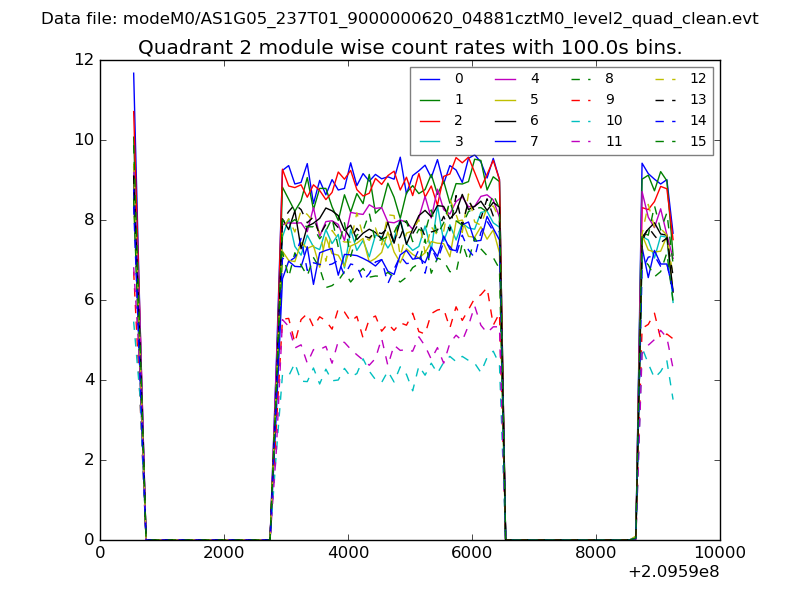
| Module-wise count rates for Quadrant B Data is divided into 100 sec bins |
 |
 |
| Module-wise count rates for Quadrant C Data is divided into 100 sec bins |
 |
 |
| Module-wise count rates for Quadrant D Data is divided into 100 sec bins |
 |
 |
| Parameter | Plot |
|---|---|
| CZT HV Monitor | 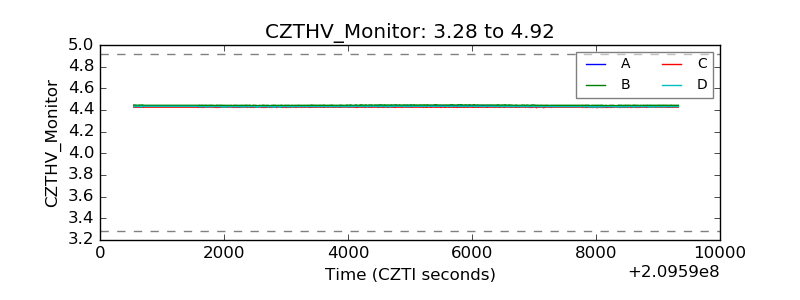 |
| D_VDD | 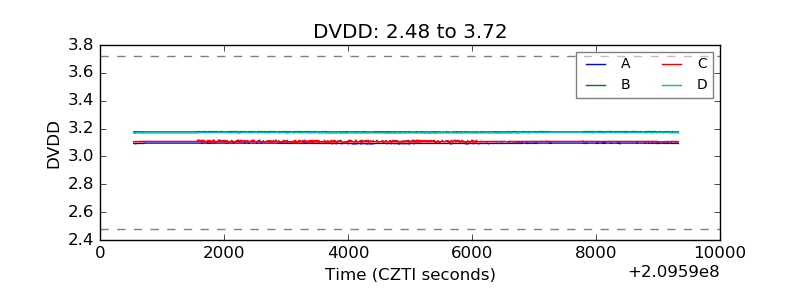 |
| Temperature 1 | 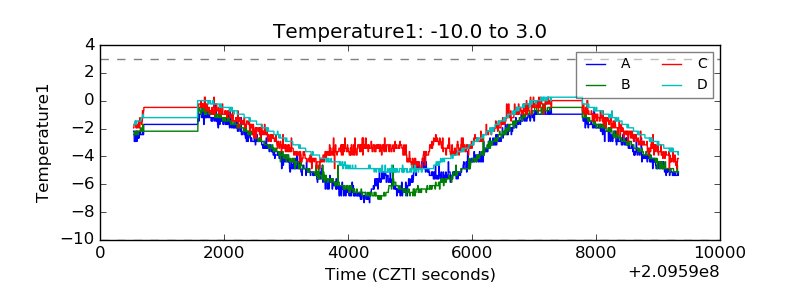 |
| Veto HV Monitor | 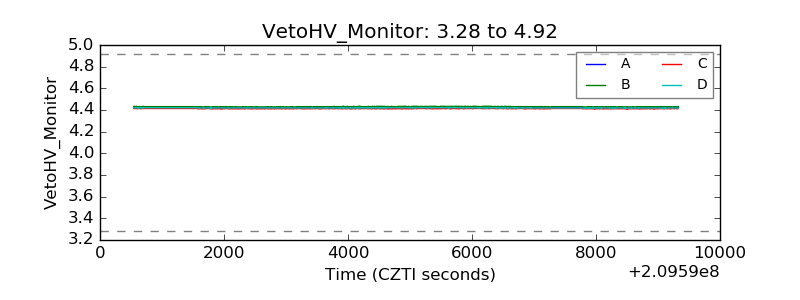 |
| Veto LLD | 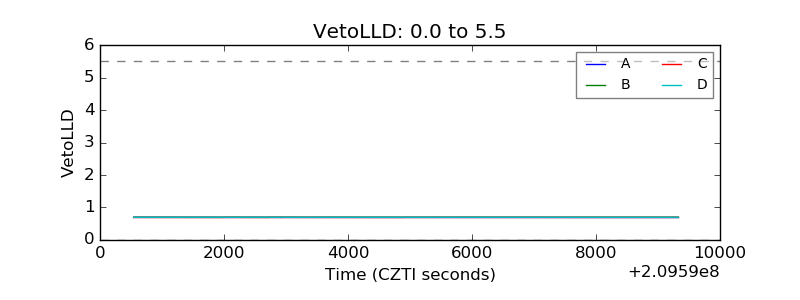 |
| Alpha Counter | 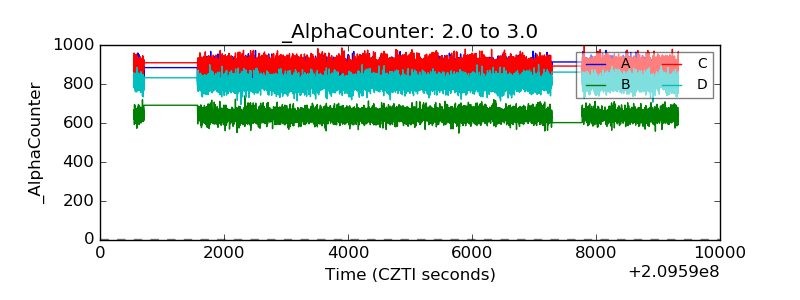 |
| _CPM_Rate |  |
| CZT Counter | 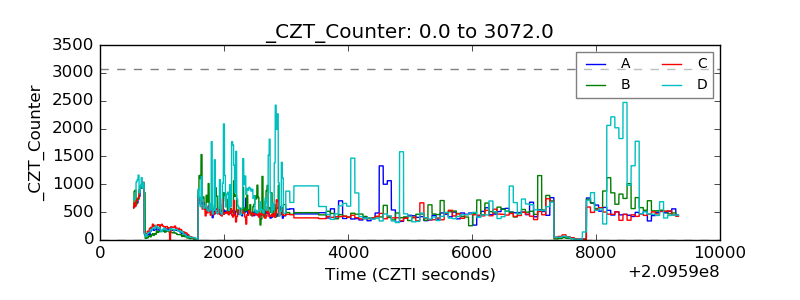 |
| +2.5 Volts monitor |  |
| +5 Volts monitor |  |
| _ROLL_ROT | 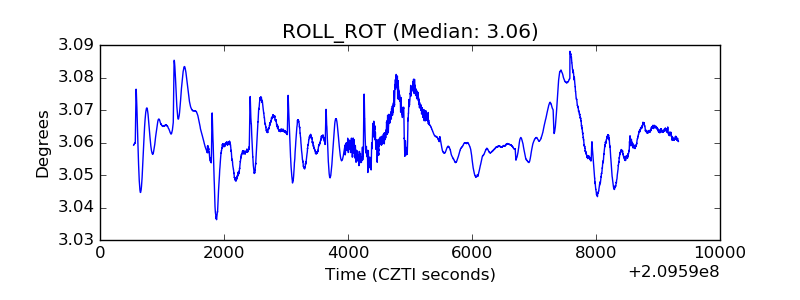 |
| _Roll_DEC | 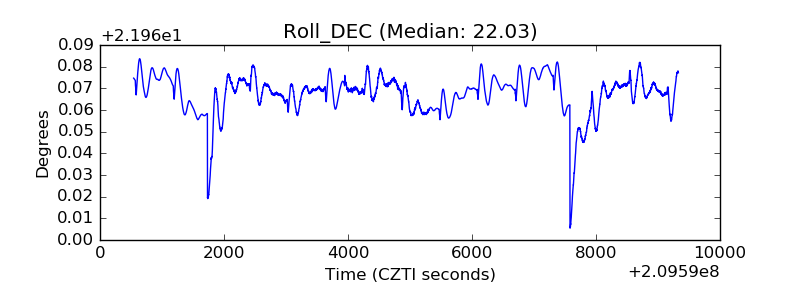 |
| _Roll_RA | 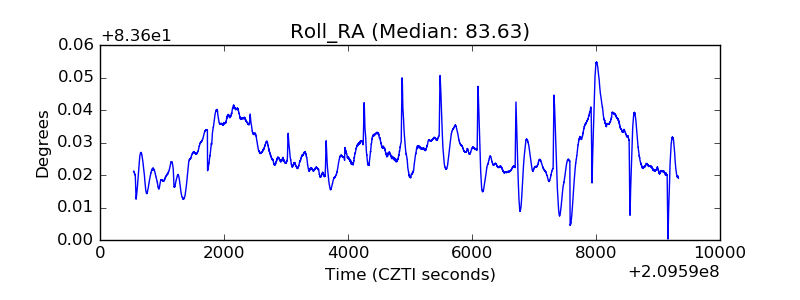 |
| Veto Counter | 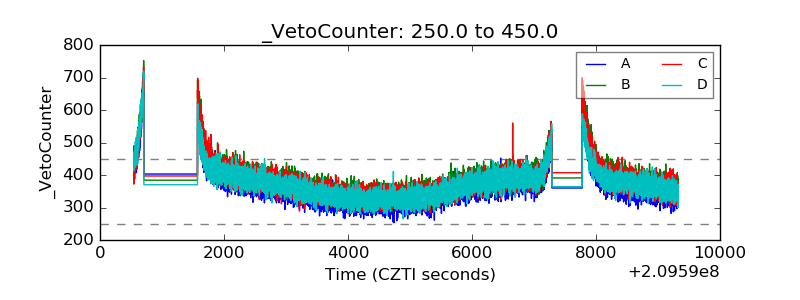 |