| Param | Original file | Final file |
|---|---|---|
| Filename | modeM0/AS1G05_237T01_9000000620_04882cztM0_level2.evt | modeM0/AS1G05_237T01_9000000620_04882cztM0_level2_quad_clean.evt |
| Size (bytes) | 566,199,360 | 87,488,640 |
| Size | 540.0 MB | 83.4 MB |
| Events in quadrant A | 3,745,706 | 538,758 |
| Events in quadrant B | 4,360,529 | 540,264 |
| Events in quadrant C | 3,455,354 | 535,930 |
| Events in quadrant D | 5,074,405 | 510,021 |
| Mode M9 | |||
|---|---|---|---|
| Quadrant | BADHDUFLAG | Total packets | Discarded packets |
| A | 0 | 3 | 0 |
| B | 0 | 3 | 0 |
| C | 0 | 3 | 0 |
| D | 0 | 3 | 0 |
| Mode SS | |||
|---|---|---|---|
| Quadrant | BADHDUFLAG | Total packets | Discarded packets |
| A | 0 | 152 | 0 |
| B | 0 | 152 | 0 |
| C | 0 | 152 | 0 |
| D | 0 | 152 | 0 |
| Mode M0 | |||
|---|---|---|---|
| Quadrant | BADHDUFLAG | Total packets | Discarded packets |
| A | 0 | 16133 | 1 |
| B | 0 | 18088 | 0 |
| C | 0 | 15474 | 0 |
| D | 0 | 20313 | 0 |
| Quadrant | Total seconds | Saturated seconds | Saturation percentage |
|---|---|---|---|
| A | 7546 | 88 | 1.166181% |
| B | 7546 | 130 | 1.722767% |
| C | 7546 | 39 | 0.516830% |
| D | 7546 | 552 | 7.315134% |
Noise dominated data is calculated using 1-second bins in cleaned event files. If a bin has >2000 counts, and if more than 50% of those come from <1% of pixels, then it is considered to be noise-dominated and hence unusable.
| Quadrant | # 1 sec bins | Bins with >0 counts | Bins with >2000 counts | High rate bins dominated by noise | Noise dominated (total time) | Noise dominated (detector-on time) | Marked lightcurve |
|---|---|---|---|---|---|---|---|
| A | 7751 | 7548 | 23 | 23 | 0.30% | 0.30% | 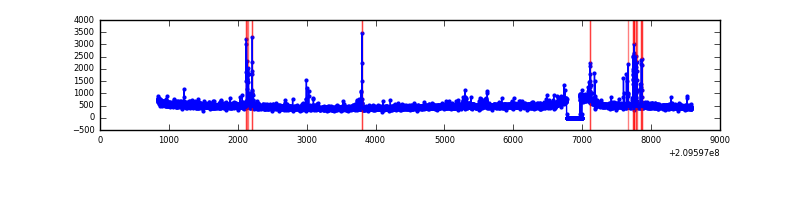 |
| B | 7751 | 7548 | 13 | 13 | 0.17% | 0.17% | 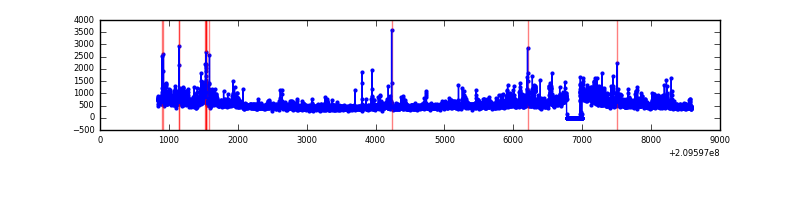 |
| C | 7751 | 7548 | 0 | 0 | 0.00% | 0.00% | 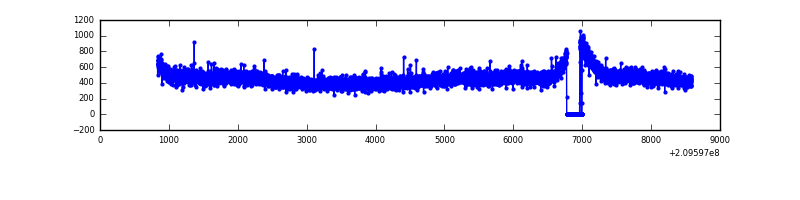 |
| D | 7751 | 7546 | 415 | 415 | 5.35% | 5.50% | 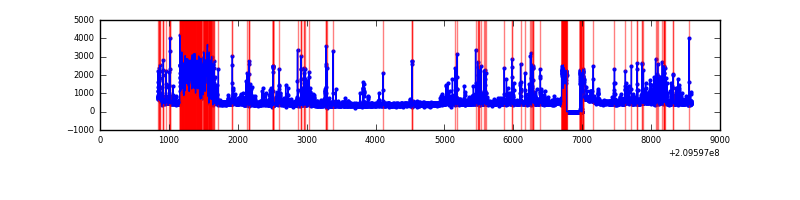 |
Top three noisy pixels from each quadrant. If the there are fewer than three noisy pixels in the level2.evt file, extra rows are filled as -1
| Pixel properties | Quadrant properties | ||||||
|---|---|---|---|---|---|---|---|
| Quadrant | DetID | PixID | Counts | Sigma | Mean | Median | Sigma |
| A | 3 | 1 | 76530 | 404.29 | 908 | 888 | 187.1 |
| A | 15 | 234 | 48844 | 256.31 | 908 | 888 | 187.1 |
| A | 8 | 15 | 44603 | 233.65 | 908 | 888 | 187.1 |
| B | 4 | 80 | 264322 | 1501.42 | 918 | 898 | 175.4 |
| B | 15 | 204 | 243047 | 1380.16 | 918 | 898 | 175.4 |
| B | 5 | 6 | 77616 | 437.26 | 918 | 898 | 175.4 |
| C | 13 | 61 | 7225 | 30.71 | 882 | 888 | 206.4 |
| C | 12 | 4 | 6022 | 24.88 | 882 | 888 | 206.4 |
| C | 1 | 16 | 3327 | 11.82 | 882 | 888 | 206.4 |
| D | 1 | 52 | 1027493 | 4843.34 | 849 | 823 | 212.0 |
| D | 2 | 136 | 247405 | 1163.26 | 849 | 823 | 212.0 |
| D | 13 | 235 | 230905 | 1085.42 | 849 | 823 | 212.0 |
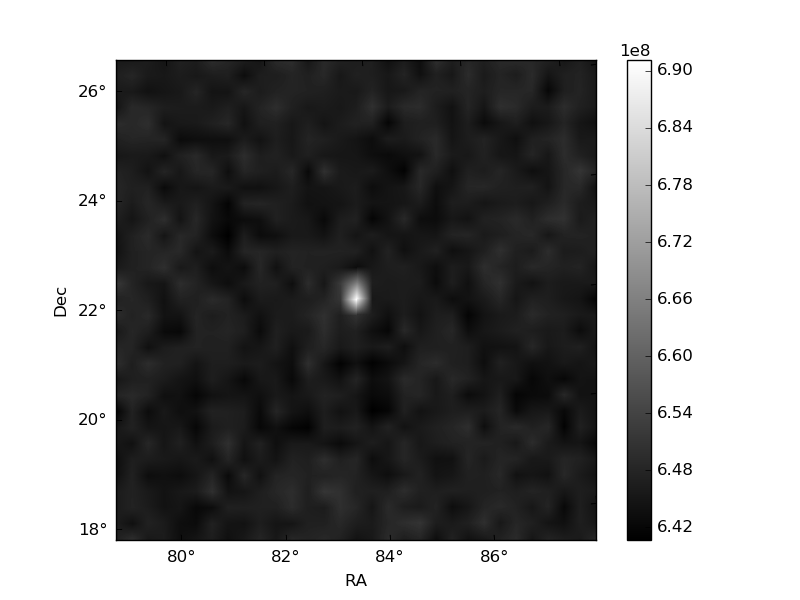
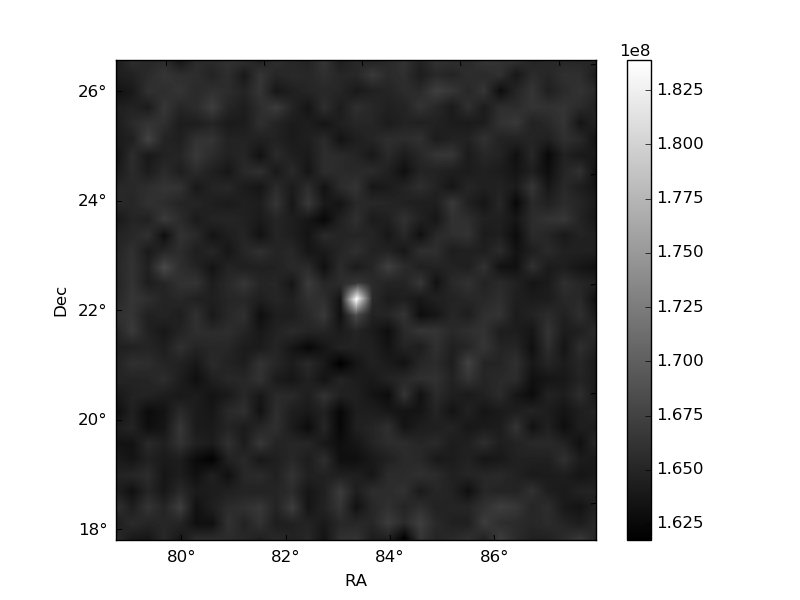
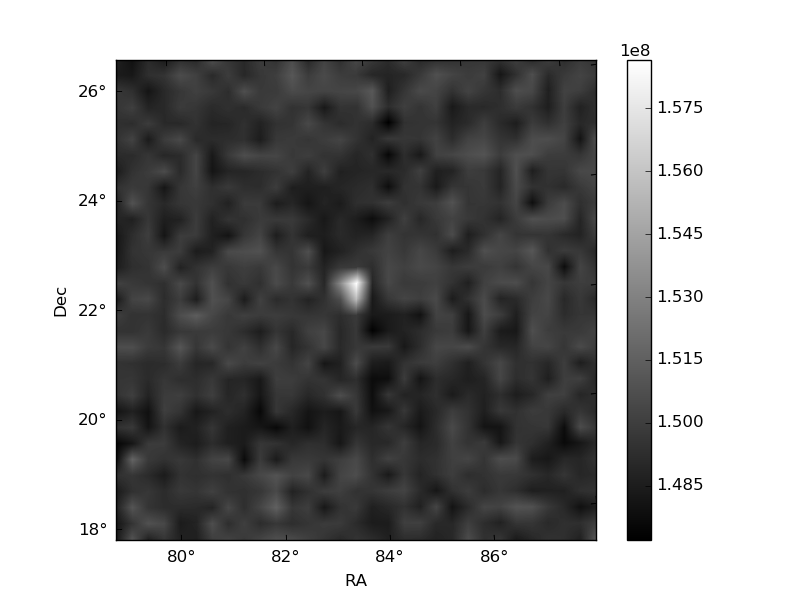
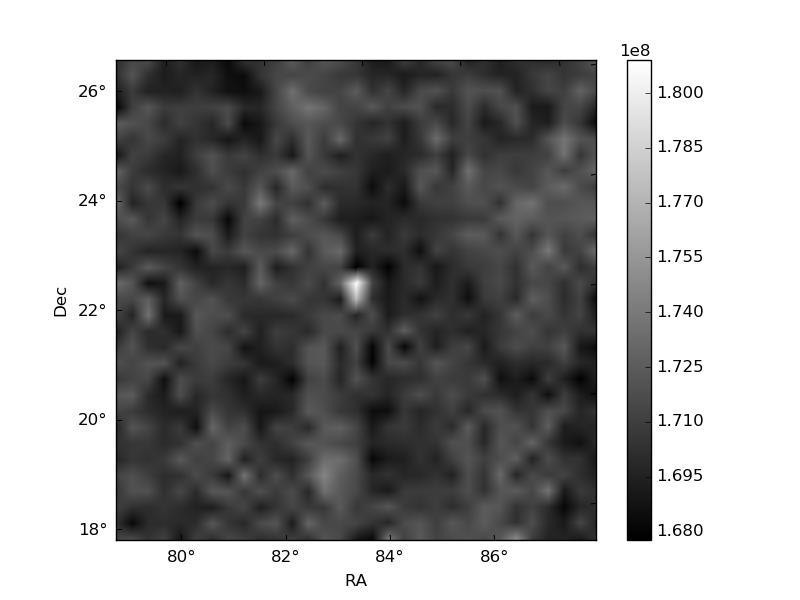
Histogram calculated using DETX and DETY for each event in the final _common_clean file
| Quadrant A | 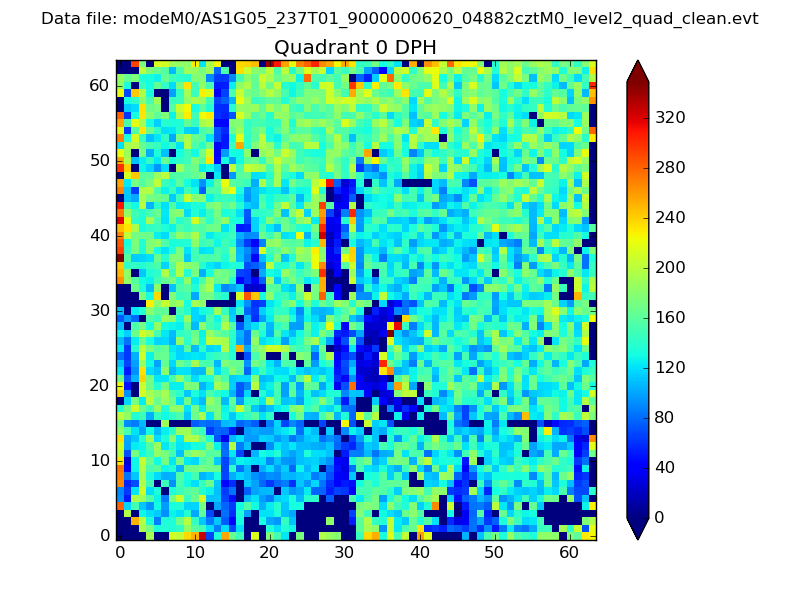 |
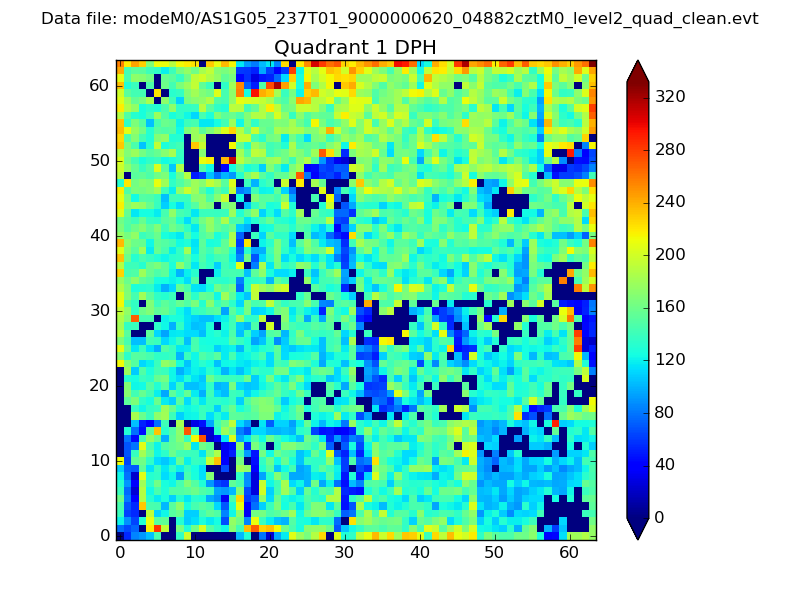 |
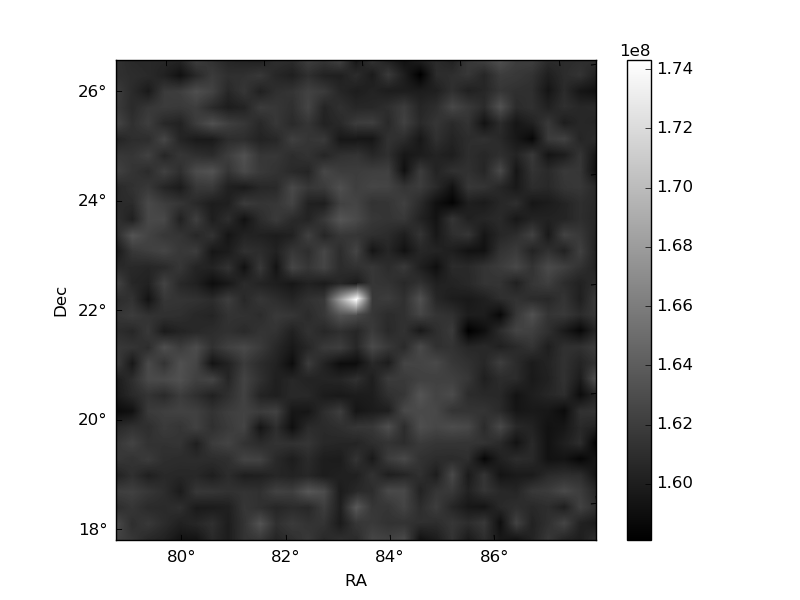
Quadrant B |
|---|---|---|---|
| Quadrant D | 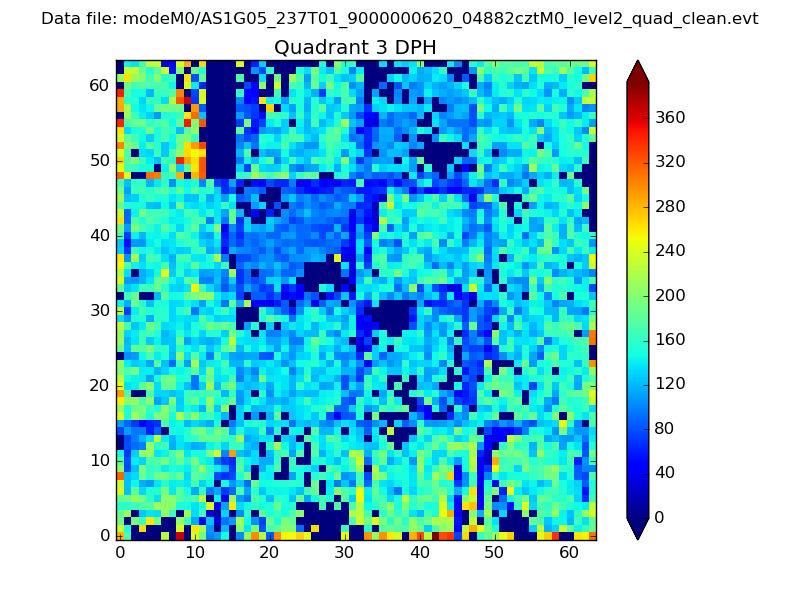 |
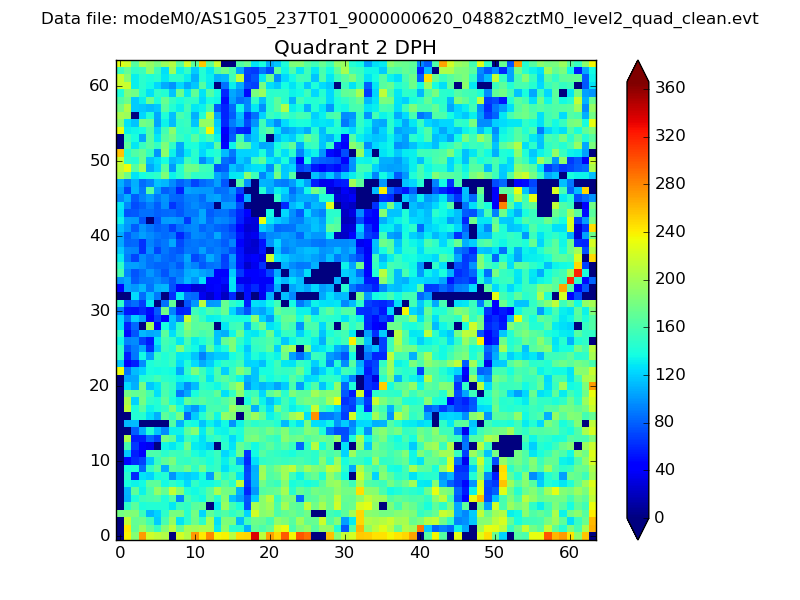 |
Quadrant C |
| Plot type | Count rate plots | Images |
|---|---|---|
| Comparison with Poisson distribution Blue bars denote a histogram of data divided into 1 sec bins. Red curve is a Poisson curve with rate = median count rate of data. |
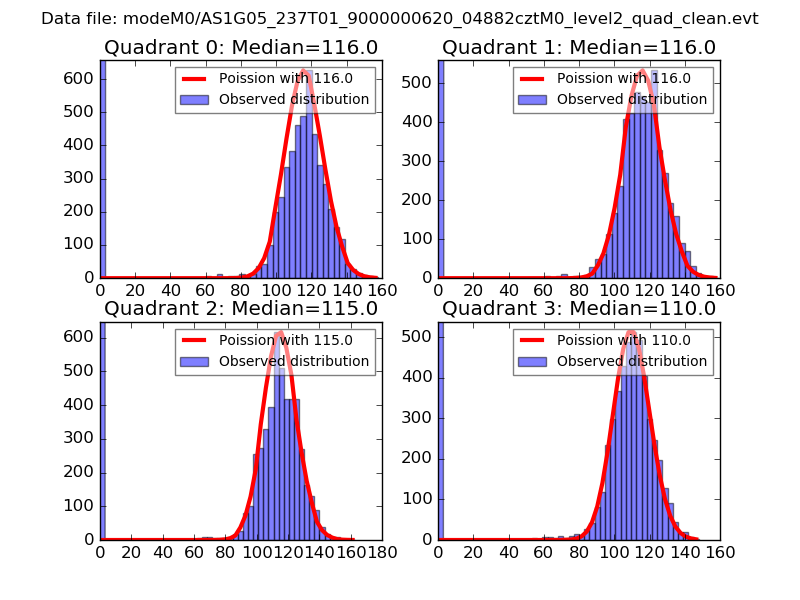 |
 |
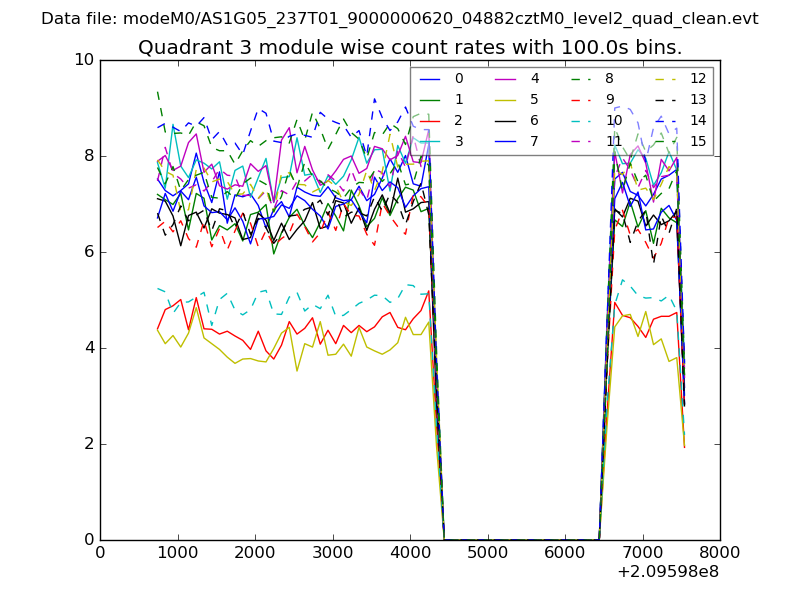
| Quadrant-wise count rates Data is divided into 100 sec bins |
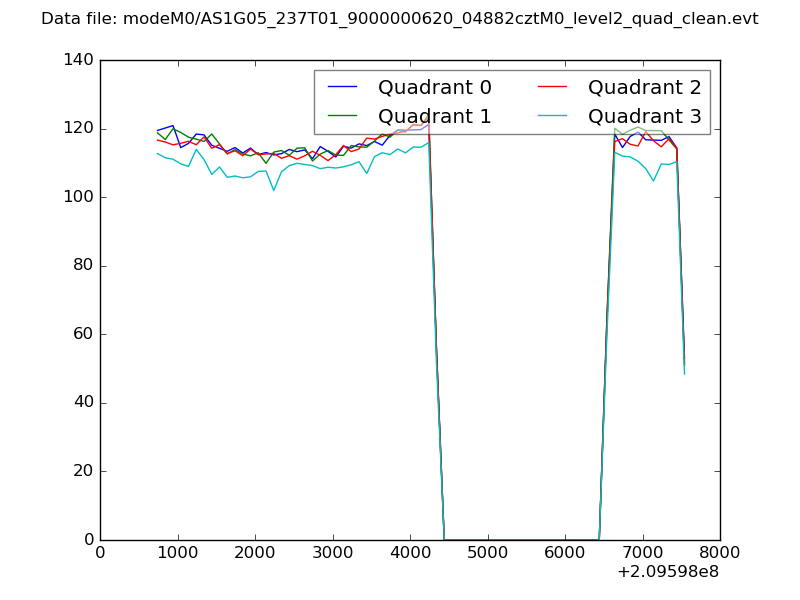 |
|
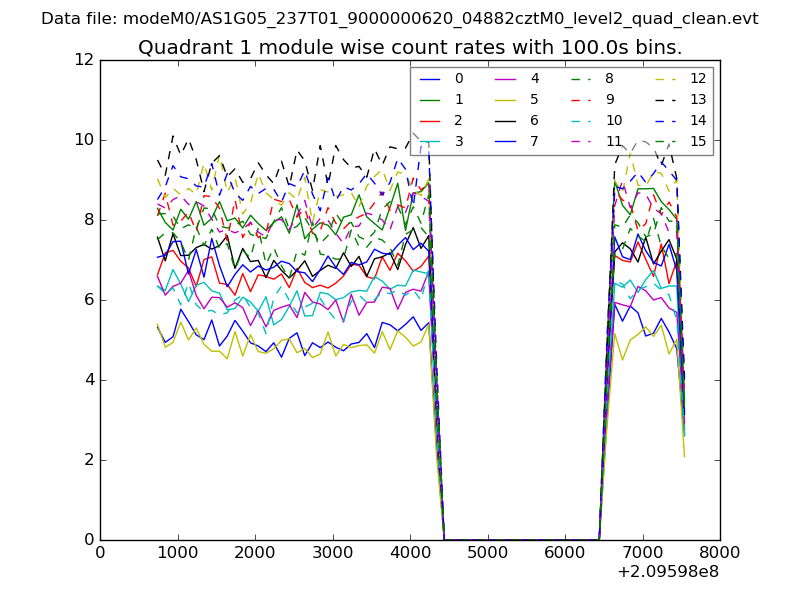
| Module-wise count rates for Quadrant A Data is divided into 100 sec bins |
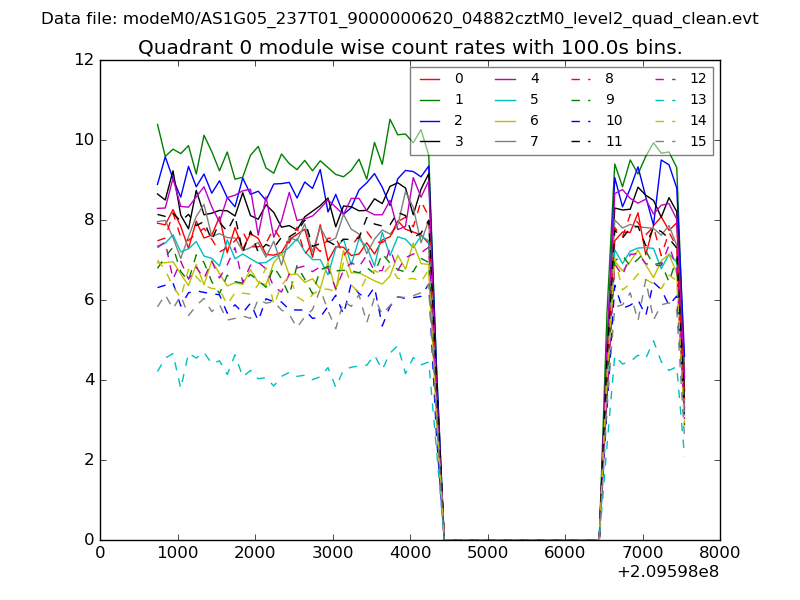 |
 |
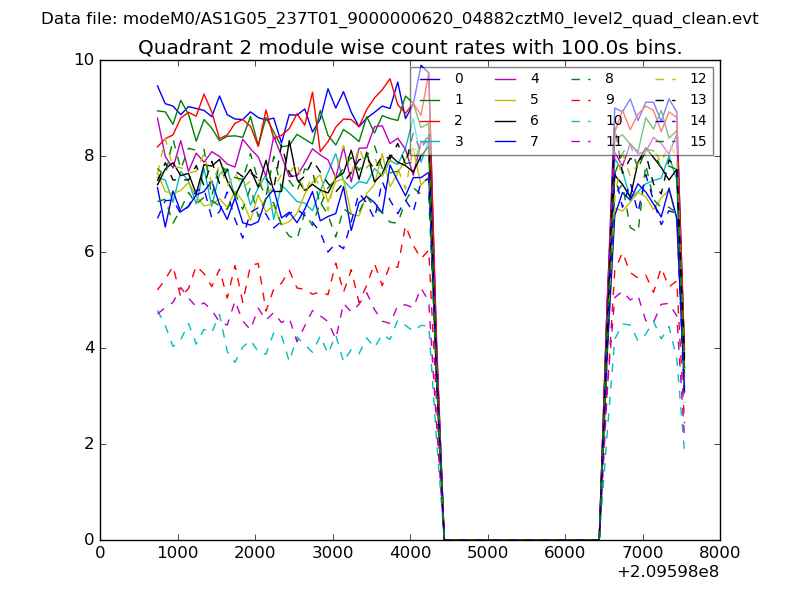
| Module-wise count rates for Quadrant B Data is divided into 100 sec bins |
 |
 |
| Module-wise count rates for Quadrant C Data is divided into 100 sec bins |
 |
 |
| Module-wise count rates for Quadrant D Data is divided into 100 sec bins |
 |
 |
| Parameter | Plot |
|---|---|
| CZT HV Monitor | 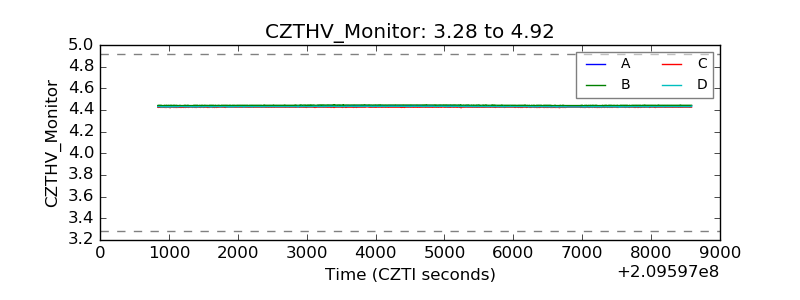 |
| D_VDD | 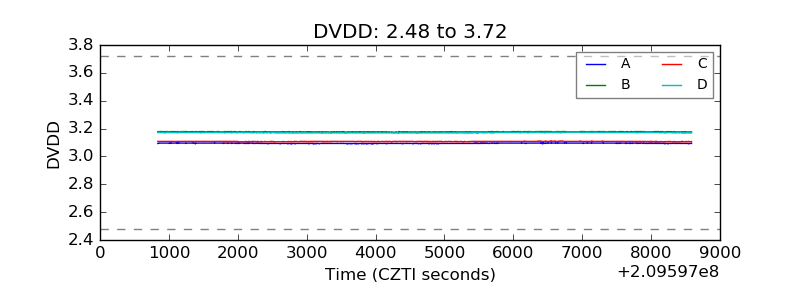 |
| Temperature 1 | 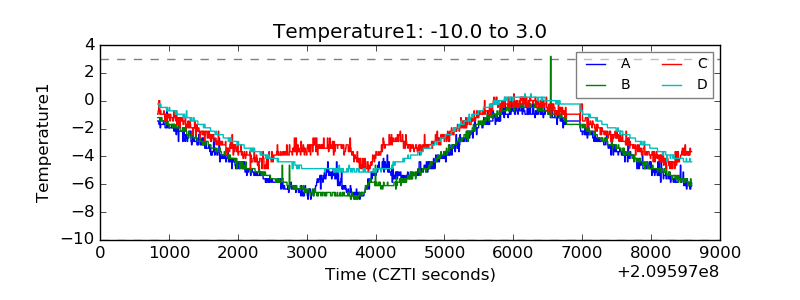 |
| Veto HV Monitor | 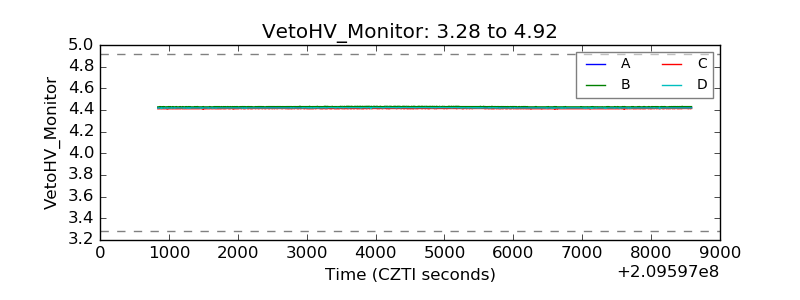 |
| Veto LLD | 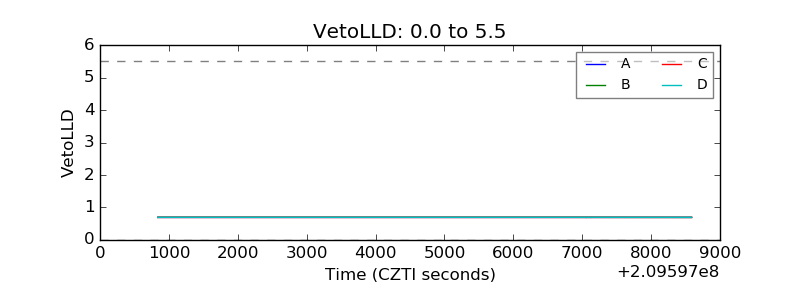 |
| Alpha Counter | 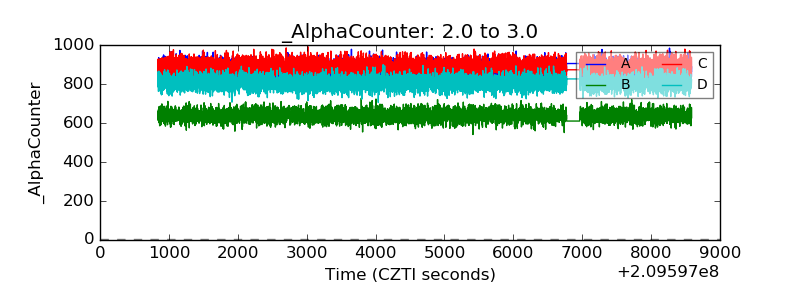 |
| _CPM_Rate | 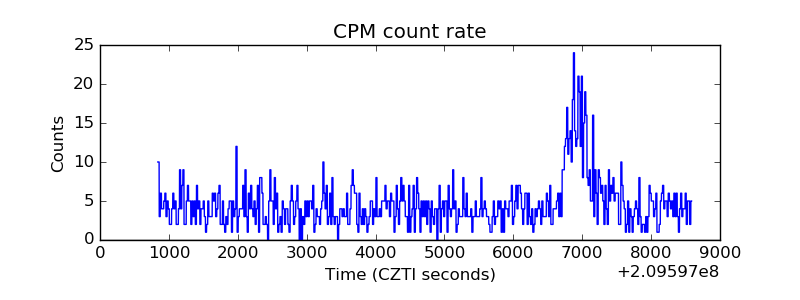 |
| CZT Counter | 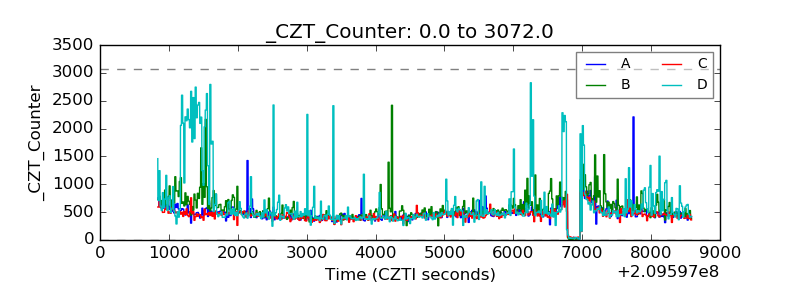 |
| +2.5 Volts monitor | 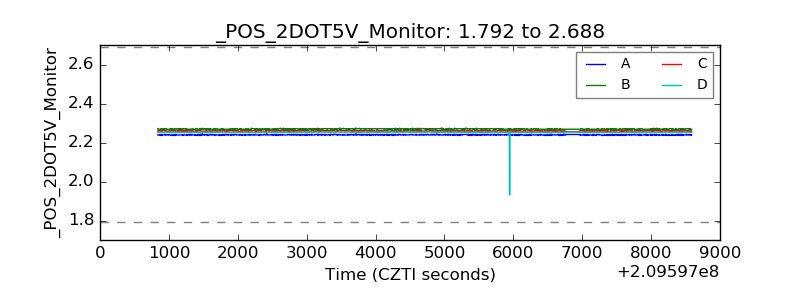 |
| +5 Volts monitor |  |
| _ROLL_ROT | 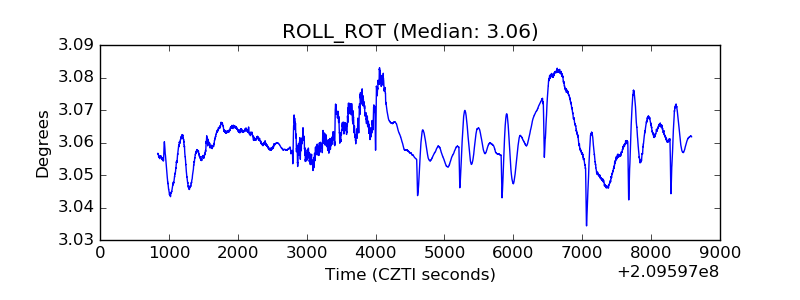 |
| _Roll_DEC | 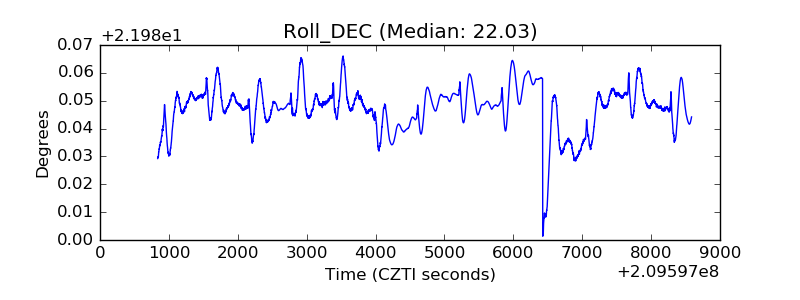 |
| _Roll_RA | 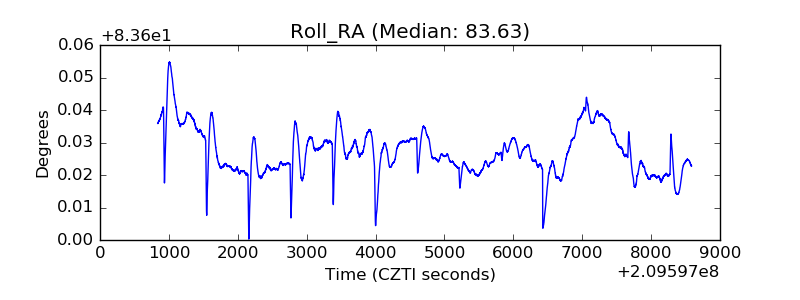 |
| Veto Counter | 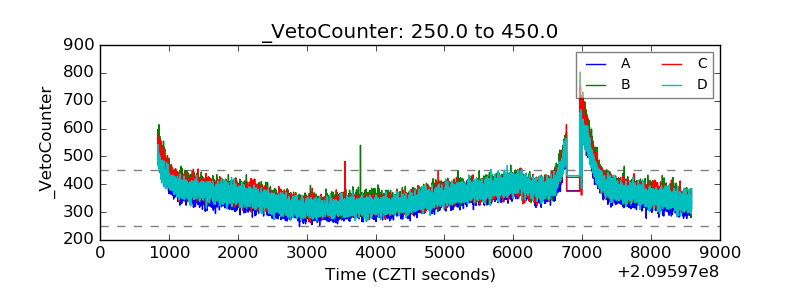 |