| Param | Original file | Final file |
|---|---|---|
| Filename | modeM0/AS1G05_237T01_9000000620_04883cztM0_level2.evt | modeM0/AS1G05_237T01_9000000620_04883cztM0_level2_quad_clean.evt |
| Size (bytes) | 514,667,520 | 90,544,320 |
| Size | 490.8 MB | 86.3 MB |
| Events in quadrant A | 3,613,423 | 571,999 |
| Events in quadrant B | 3,591,658 | 576,938 |
| Events in quadrant C | 3,102,528 | 573,809 |
| Events in quadrant D | 4,811,875 | 539,788 |
| Mode M9 | |||
|---|---|---|---|
| Quadrant | BADHDUFLAG | Total packets | Discarded packets |
| A | 0 | 3 | 0 |
| B | 0 | 3 | 0 |
| C | 0 | 3 | 0 |
| D | 0 | 3 | 0 |
| Mode SS | |||
|---|---|---|---|
| Quadrant | BADHDUFLAG | Total packets | Discarded packets |
| A | 0 | 140 | 0 |
| B | 0 | 140 | 0 |
| C | 0 | 140 | 0 |
| D | 0 | 140 | 0 |
| Mode M0 | |||
|---|---|---|---|
| Quadrant | BADHDUFLAG | Total packets | Discarded packets |
| A | 0 | 15404 | 2 |
| B | 0 | 15278 | 1 |
| C | 0 | 14078 | 1 |
| D | 0 | 19155 | 1 |
| Quadrant | Total seconds | Saturated seconds | Saturation percentage |
|---|---|---|---|
| A | 6879 | 122 | 1.773514% |
| B | 6879 | 63 | 0.915831% |
| C | 6879 | 16 | 0.232592% |
| D | 6879 | 650 | 9.449048% |
Noise dominated data is calculated using 1-second bins in cleaned event files. If a bin has >2000 counts, and if more than 50% of those come from <1% of pixels, then it is considered to be noise-dominated and hence unusable.
| Quadrant | # 1 sec bins | Bins with >0 counts | Bins with >2000 counts | High rate bins dominated by noise | Noise dominated (total time) | Noise dominated (detector-on time) | Marked lightcurve |
|---|---|---|---|---|---|---|---|
| A | 7194 | 6880 | 79 | 79 | 1.10% | 1.15% | 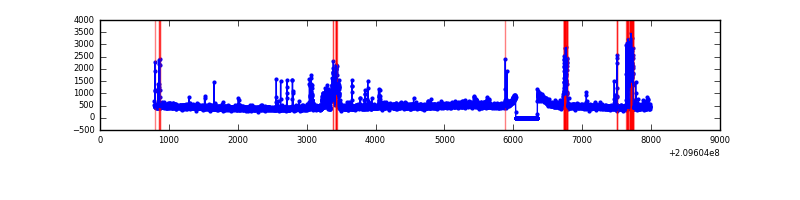 |
| B | 7194 | 6880 | 0 | 0 | 0.00% | 0.00% | 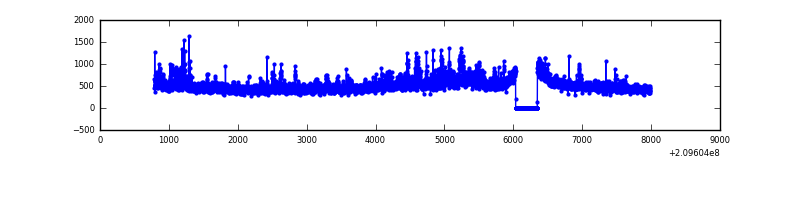 |
| C | 7194 | 6880 | 0 | 0 | 0.00% | 0.00% | 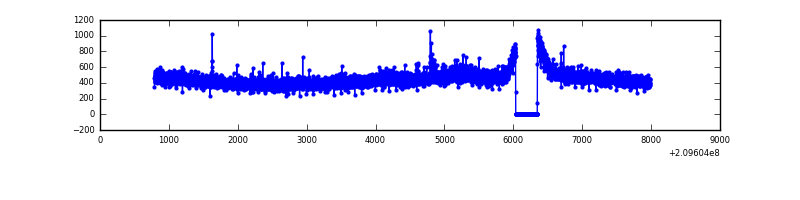 |
| D | 7194 | 6879 | 479 | 479 | 6.66% | 6.96% | 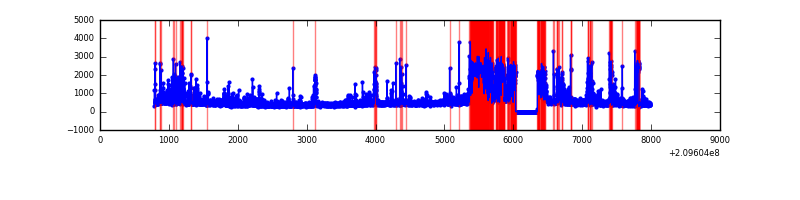 |
Top three noisy pixels from each quadrant. If the there are fewer than three noisy pixels in the level2.evt file, extra rows are filled as -1
| Pixel properties | Quadrant properties | ||||||
|---|---|---|---|---|---|---|---|
| Quadrant | DetID | PixID | Counts | Sigma | Mean | Median | Sigma |
| A | 0 | 50 | 412723 | 2455.55 | 807 | 790 | 167.8 |
| A | 3 | 1 | 56755 | 333.61 | 807 | 790 | 167.8 |
| A | 12 | 133 | 15384 | 87.0 | 807 | 790 | 167.8 |
| B | 15 | 204 | 237502 | 1480.99 | 823 | 804 | 159.8 |
| B | 4 | 80 | 48319 | 297.3 | 823 | 804 | 159.8 |
| B | 0 | 228 | 37939 | 232.35 | 823 | 804 | 159.8 |
| C | 12 | 4 | 13558 | 69.07 | 787 | 793 | 184.8 |
| C | 13 | 61 | 6482 | 30.78 | 787 | 793 | 184.8 |
| C | 1 | 16 | 5842 | 27.32 | 787 | 793 | 184.8 |
| D | 1 | 52 | 1081869 | 5866.51 | 741 | 719 | 184.3 |
| D | 2 | 136 | 337058 | 1825.03 | 741 | 719 | 184.3 |
| D | 13 | 235 | 335296 | 1815.47 | 741 | 719 | 184.3 |
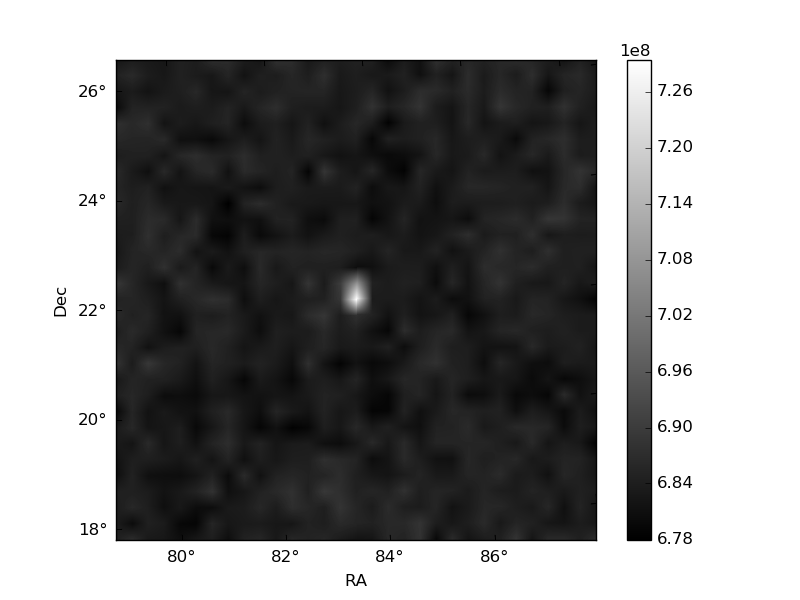
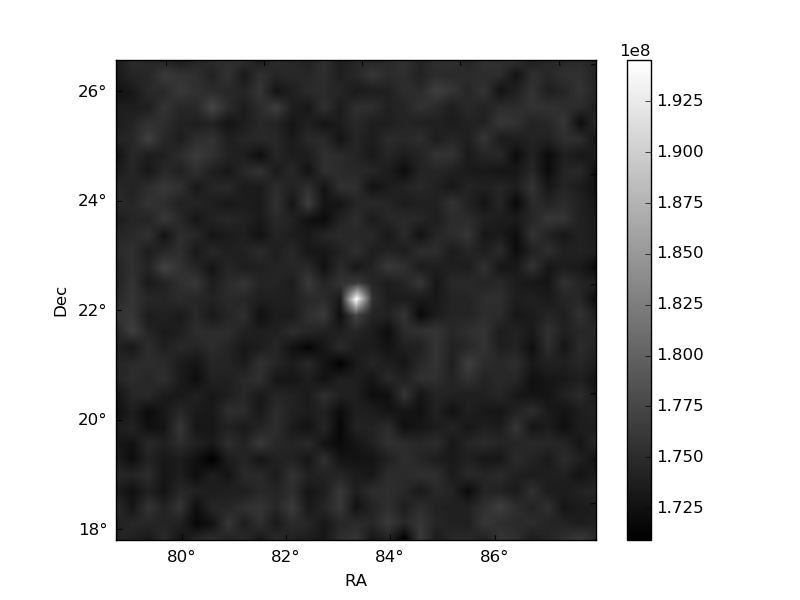
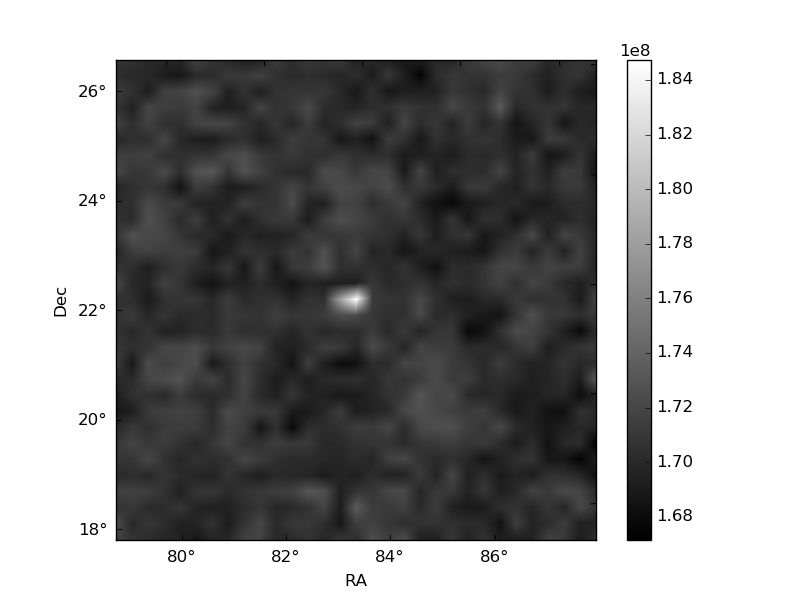
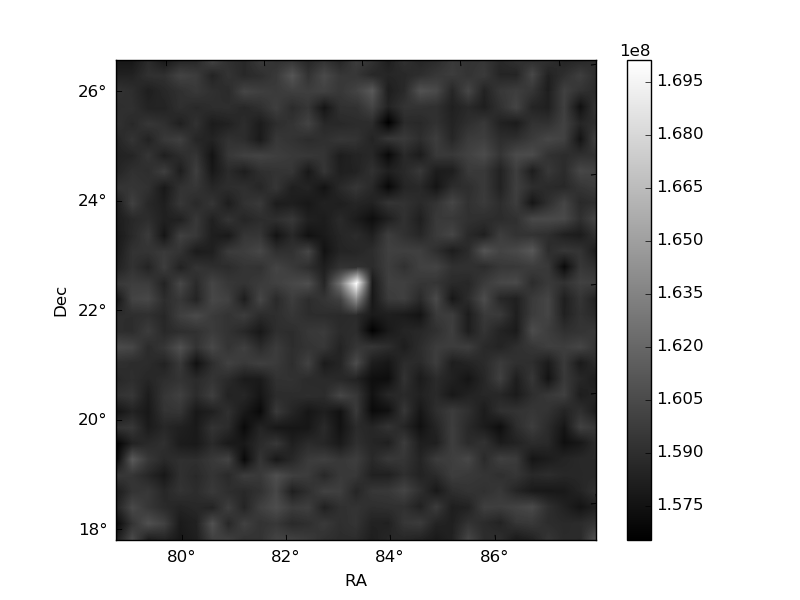
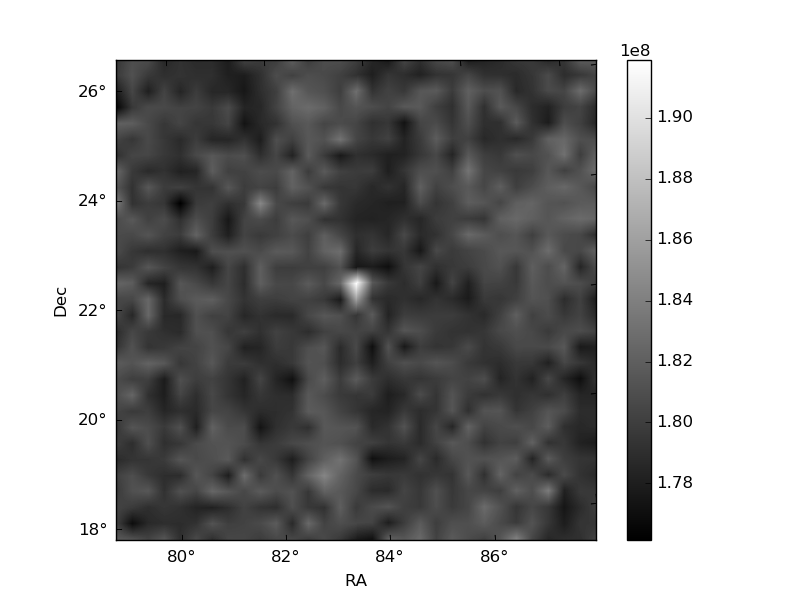
Histogram calculated using DETX and DETY for each event in the final _common_clean file
| Quadrant A | 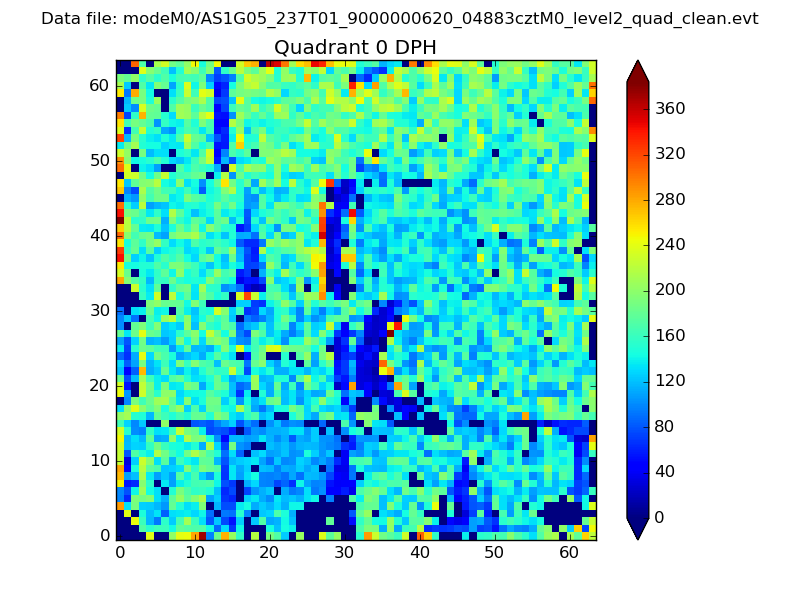 |
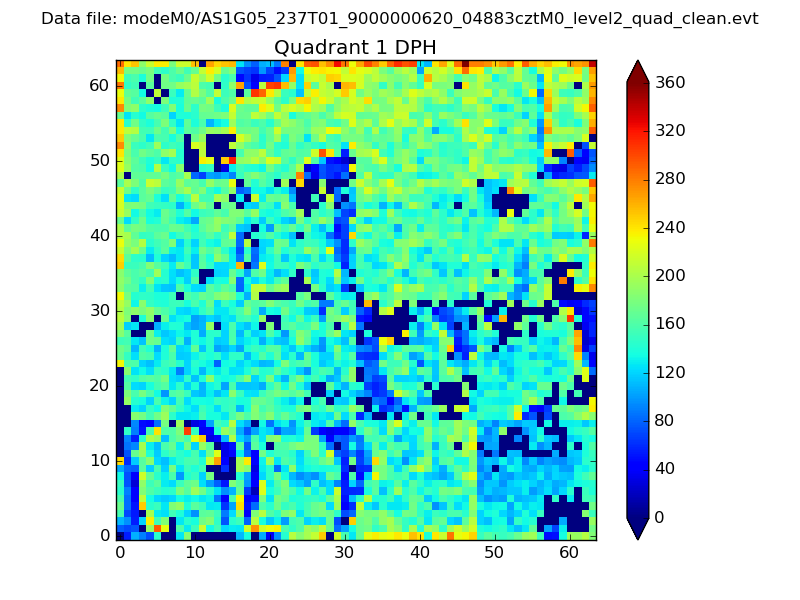 |
Quadrant B |
|---|---|---|---|
| Quadrant D | 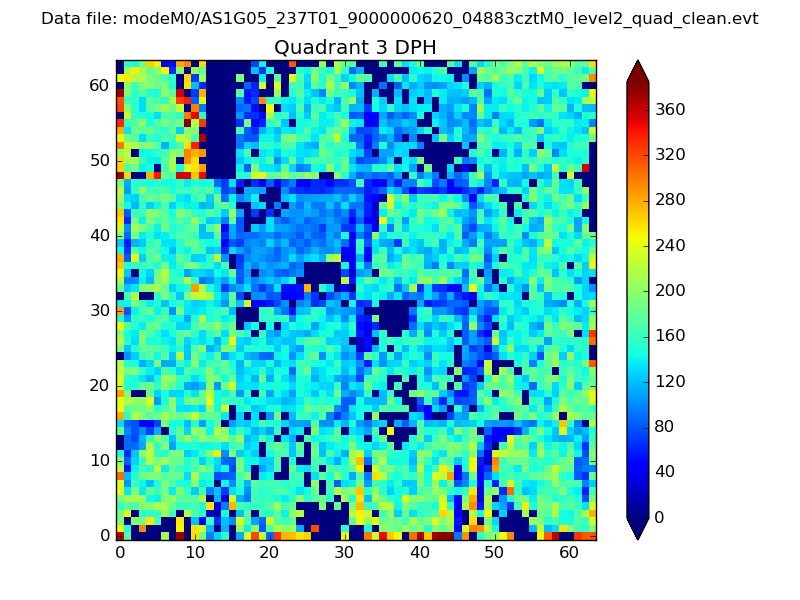 |
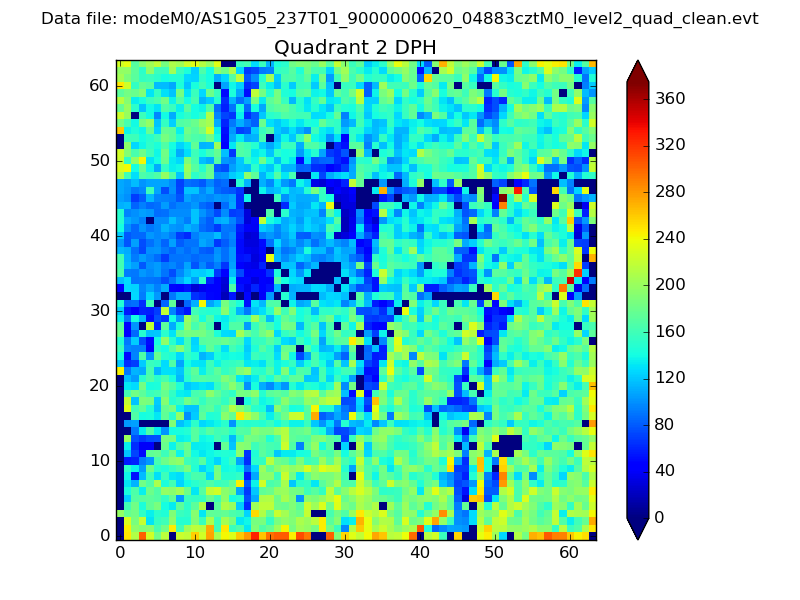 |
Quadrant C |
| Plot type | Count rate plots | Images |
|---|---|---|
| Comparison with Poisson distribution Blue bars denote a histogram of data divided into 1 sec bins. Red curve is a Poisson curve with rate = median count rate of data. |
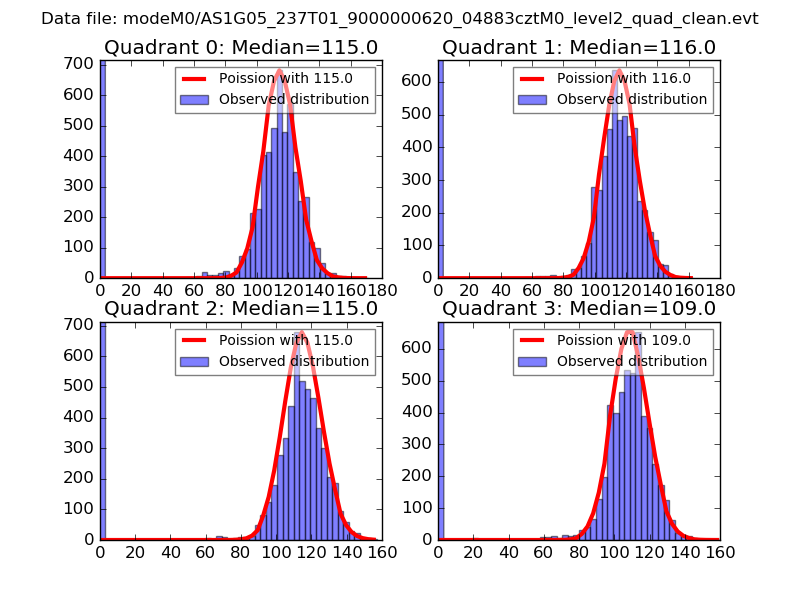 |
 |
| Quadrant-wise count rates Data is divided into 100 sec bins |
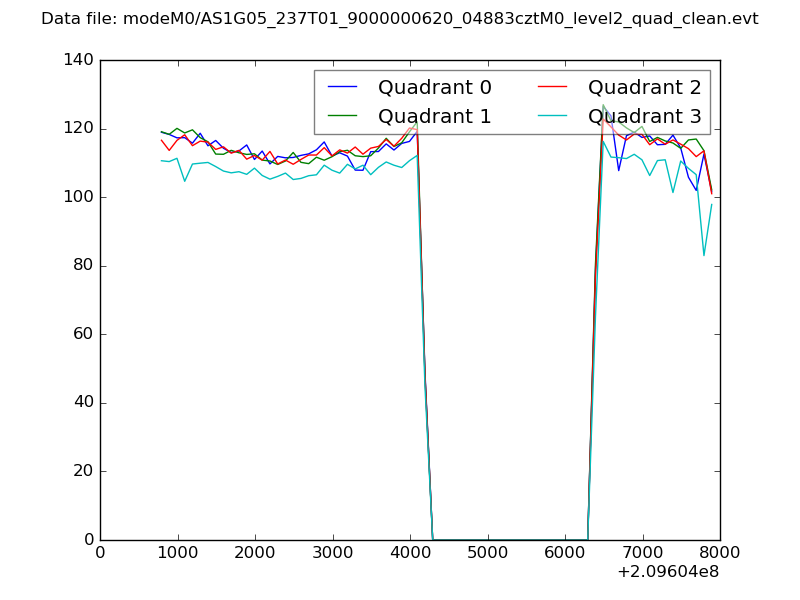 |
|
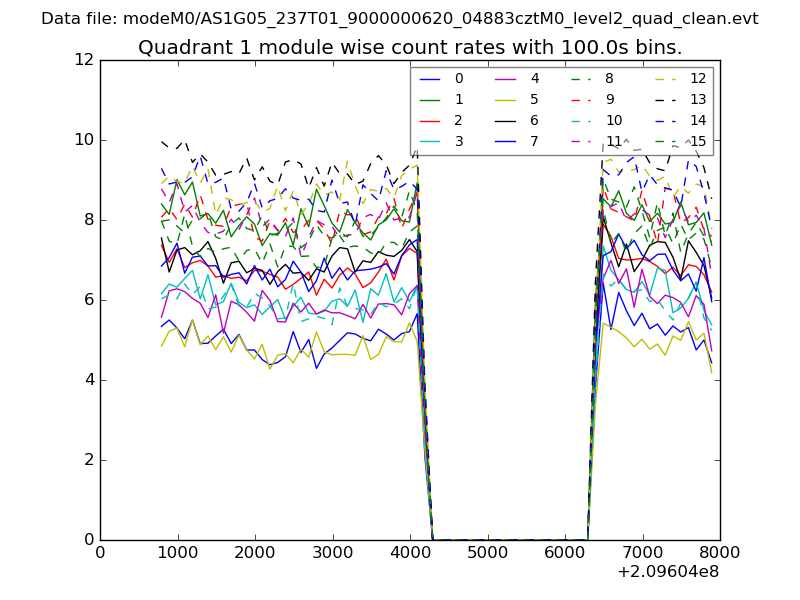
| Module-wise count rates for Quadrant A Data is divided into 100 sec bins |
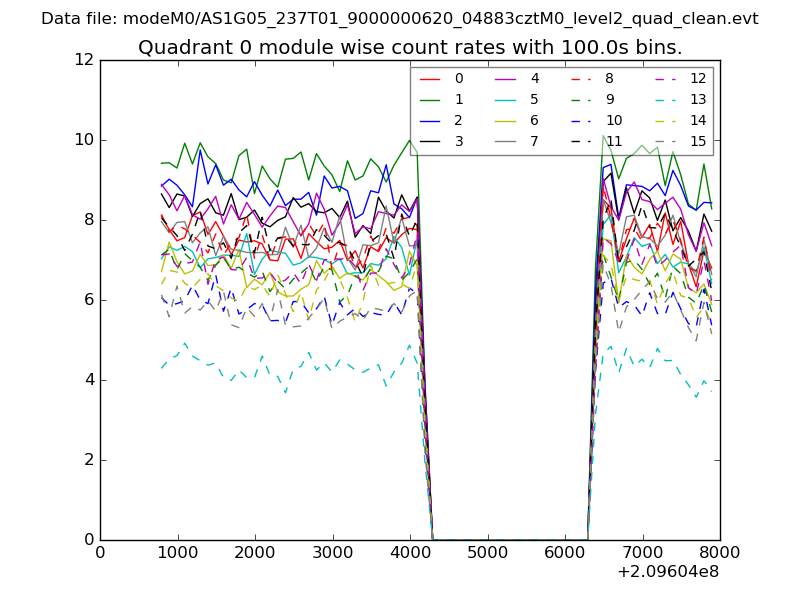 |
 |
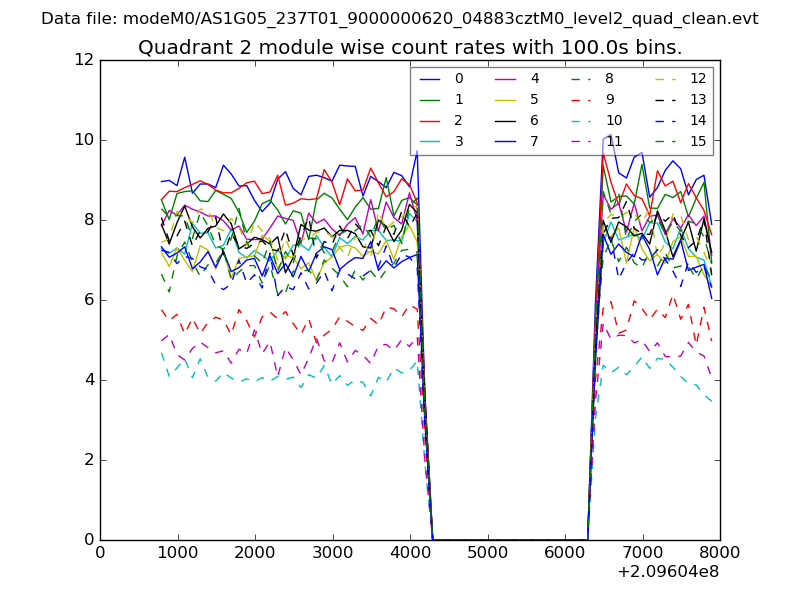
| Module-wise count rates for Quadrant B Data is divided into 100 sec bins |
 |
 |
| Module-wise count rates for Quadrant C Data is divided into 100 sec bins |
 |
 |
| Module-wise count rates for Quadrant D Data is divided into 100 sec bins |
 |
 |
| Parameter | Plot |
|---|---|
| CZT HV Monitor | 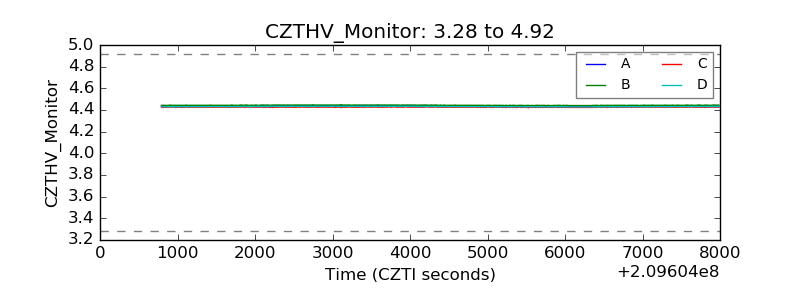 |
| D_VDD | 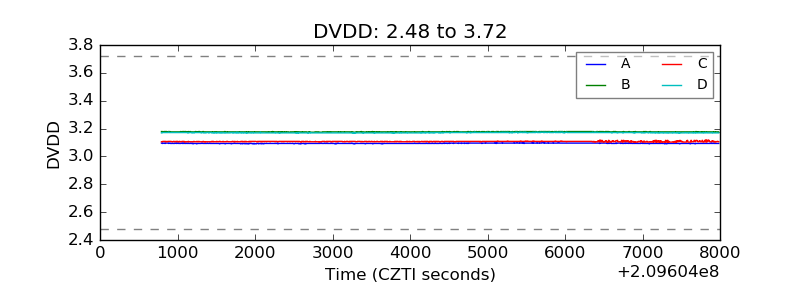 |
| Temperature 1 | 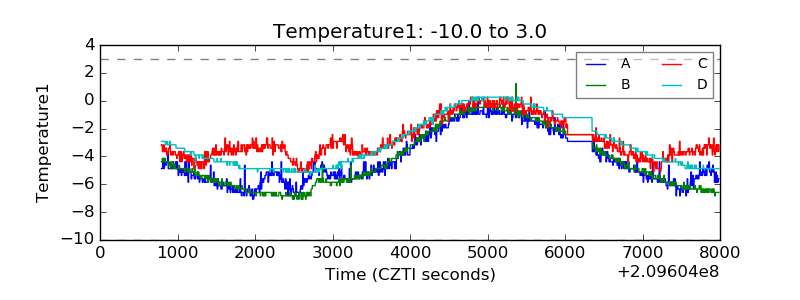 |
| Veto HV Monitor | 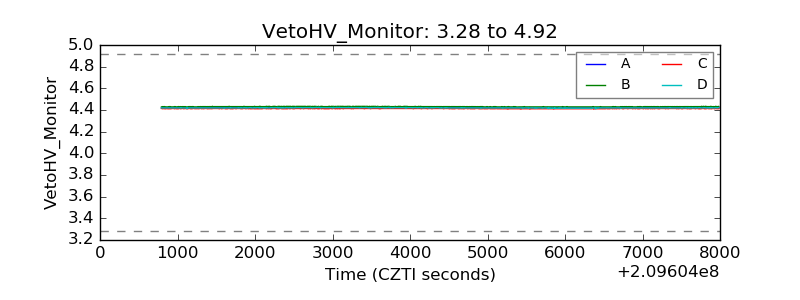 |
| Veto LLD | 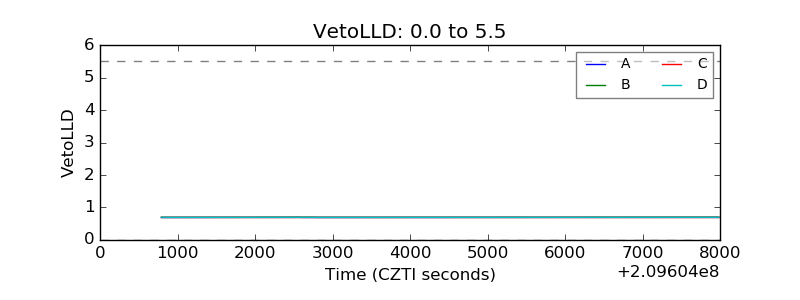 |
| Alpha Counter |  |
| _CPM_Rate | 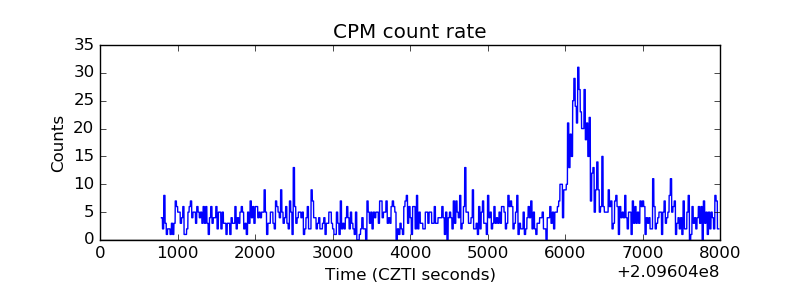 |
| CZT Counter | 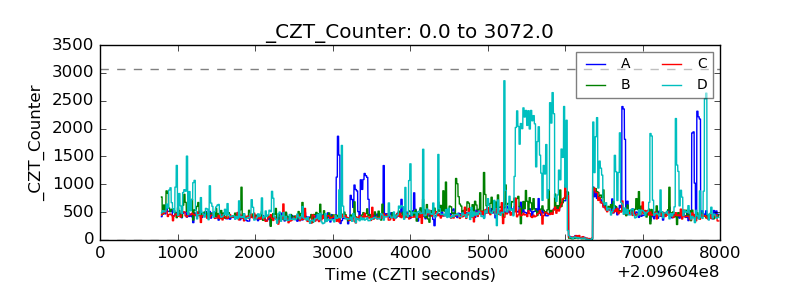 |
| +2.5 Volts monitor |  |
| +5 Volts monitor |  |
| _ROLL_ROT | 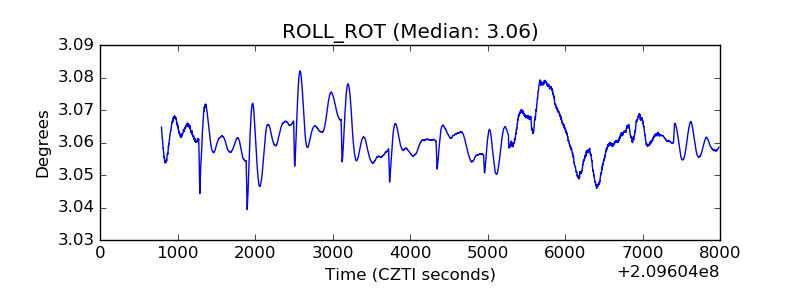 |
| _Roll_DEC | 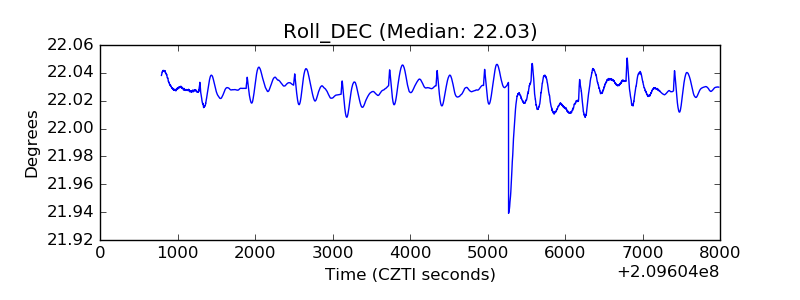 |
| _Roll_RA | 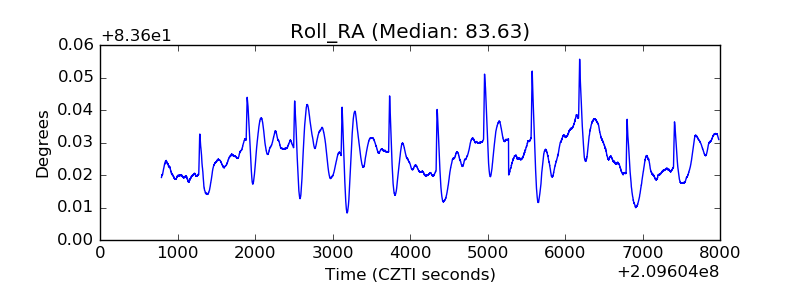 |
| Veto Counter | 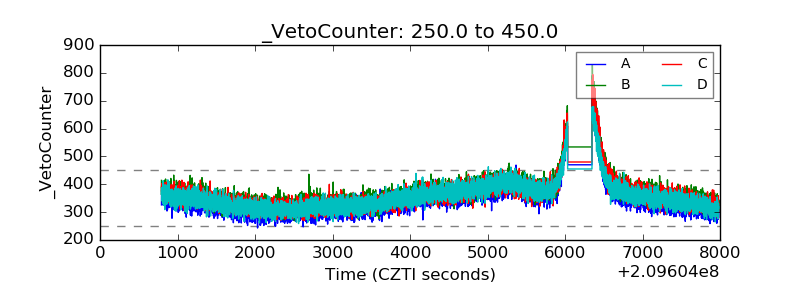 |