| Param | Original file | Final file |
|---|---|---|
| Filename | modeM0/AS1G05_237T01_9000000620_04886cztM0_level2.evt | modeM0/AS1G05_237T01_9000000620_04886cztM0_level2_quad_clean.evt |
| Size (bytes) | 622,077,120 | 98,179,200 |
| Size | 593.3 MB | 93.6 MB |
| Events in quadrant A | 4,497,421 | 592,933 |
| Events in quadrant B | 4,651,160 | 587,433 |
| Events in quadrant C | 4,197,966 | 592,868 |
| Events in quadrant D | 4,863,840 | 556,701 |
| Mode M9 | |||
|---|---|---|---|
| Quadrant | BADHDUFLAG | Total packets | Discarded packets |
| A | 0 | 16 | 0 |
| B | 0 | 16 | 0 |
| C | 0 | 17 | 2 |
| D | 0 | 16 | 1 |
| Mode SS | |||
|---|---|---|---|
| Quadrant | BADHDUFLAG | Total packets | Discarded packets |
| A | 0 | 222 | 36 |
| B | 0 | 222 | 36 |
| C | 0 | 221 | 32 |
| D | 0 | 222 | 32 |
| Mode M0 | |||
|---|---|---|---|
| Quadrant | BADHDUFLAG | Total packets | Discarded packets |
| A | 0 | 23064 | 3468 |
| B | 0 | 23582 | 3727 |
| C | 0 | 22401 | 3382 |
| D | 0 | 25251 | 4400 |
| Quadrant | Total seconds | Saturated seconds | Saturation percentage |
|---|---|---|---|
| A | 9301 | 72 | 0.774110% |
| B | 9194 | 86 | 0.935393% |
| C | 9312 | 29 | 0.311426% |
| D | 9260 | 111 | 1.198704% |
Noise dominated data is calculated using 1-second bins in cleaned event files. If a bin has >2000 counts, and if more than 50% of those come from <1% of pixels, then it is considered to be noise-dominated and hence unusable.
| Quadrant | # 1 sec bins | Bins with >0 counts | Bins with >2000 counts | High rate bins dominated by noise | Noise dominated (total time) | Noise dominated (detector-on time) | Marked lightcurve |
|---|---|---|---|---|---|---|---|
| A | 12104 | 9840 | 13 | 13 | 0.11% | 0.13% | 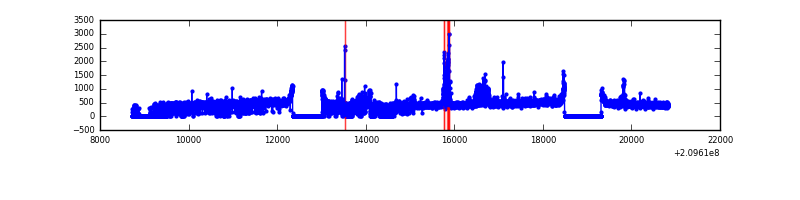 |
| B | 12103 | 9750 | 4 | 4 | 0.03% | 0.04% | 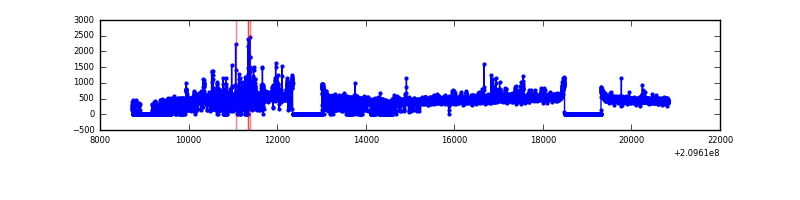 |
| C | 12104 | 9840 | 0 | 0 | 0.00% | 0.00% | 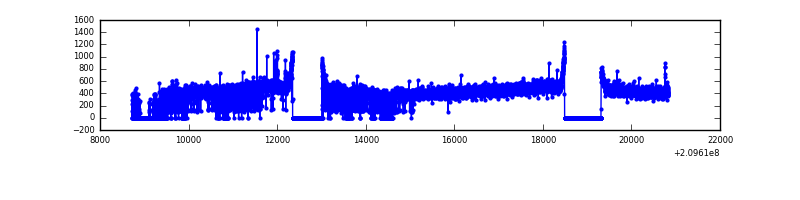 |
| D | 12114 | 9759 | 68 | 68 | 0.56% | 0.70% | 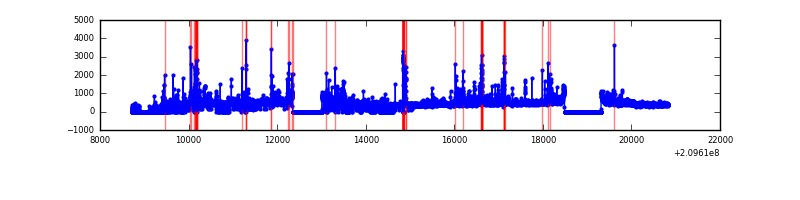 |
Top three noisy pixels from each quadrant. If the there are fewer than three noisy pixels in the level2.evt file, extra rows are filled as -1
| Pixel properties | Quadrant properties | ||||||
|---|---|---|---|---|---|---|---|
| Quadrant | DetID | PixID | Counts | Sigma | Mean | Median | Sigma |
| A | 0 | 31 | 163197 | 712.94 | 1105 | 1082 | 227.4 |
| A | 0 | 50 | 65551 | 283.52 | 1105 | 1082 | 227.4 |
| A | 13 | 14 | 12867 | 51.83 | 1105 | 1082 | 227.4 |
| B | 15 | 204 | 236936 | 1110.44 | 1102 | 1079 | 212.4 |
| B | 0 | 219 | 51116 | 235.58 | 1102 | 1079 | 212.4 |
| B | 15 | 54 | 40826 | 187.13 | 1102 | 1079 | 212.4 |
| C | 12 | 4 | 19534 | 74.14 | 1067 | 1077 | 249.0 |
| C | 14 | 67 | 10894 | 39.43 | 1067 | 1077 | 249.0 |
| C | 13 | 61 | 8644 | 30.4 | 1067 | 1077 | 249.0 |
| D | 2 | 136 | 271746 | 1038.39 | 1058 | 1025 | 260.7 |
| D | 13 | 235 | 170131 | 648.63 | 1058 | 1025 | 260.7 |
| D | 2 | 14 | 116034 | 441.13 | 1058 | 1025 | 260.7 |
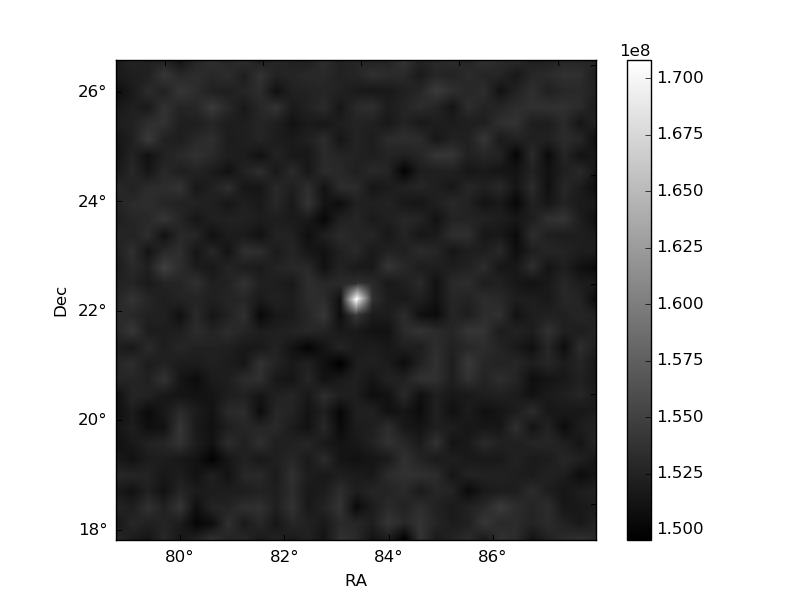
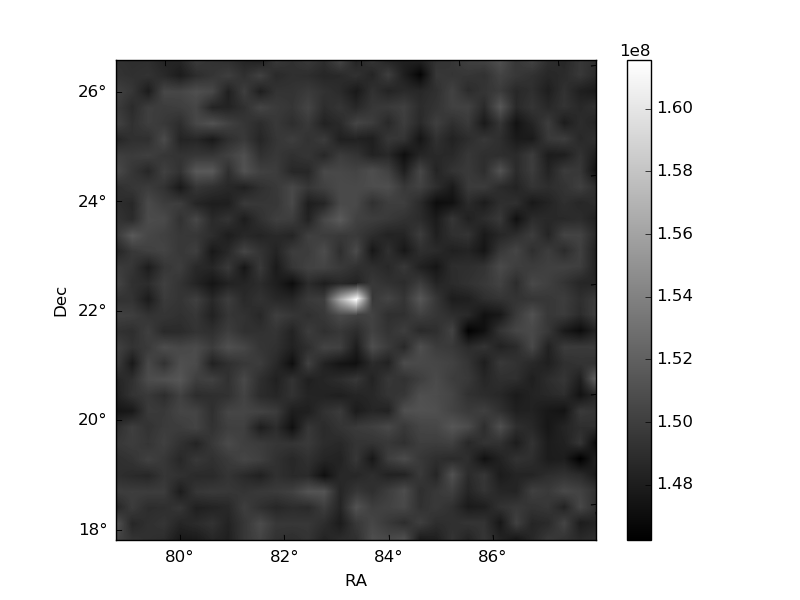
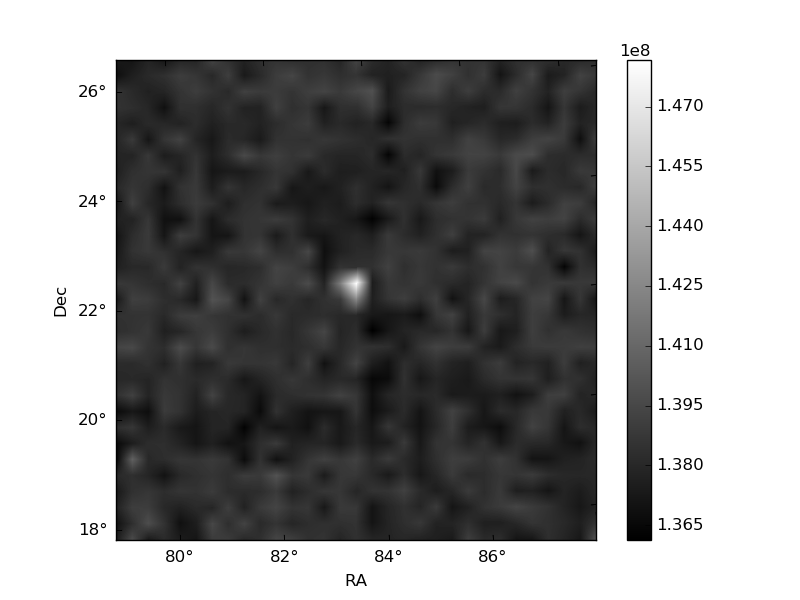
Histogram calculated using DETX and DETY for each event in the final _common_clean file
| Quadrant A | 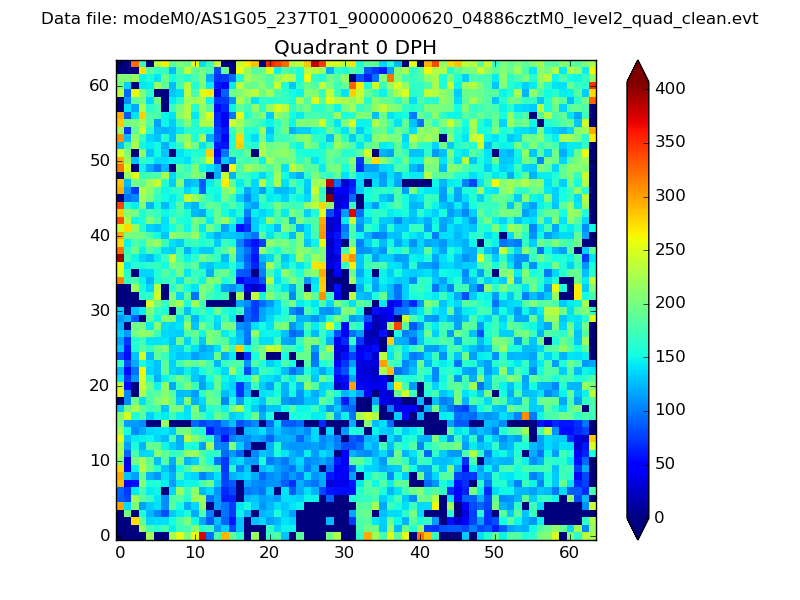 |
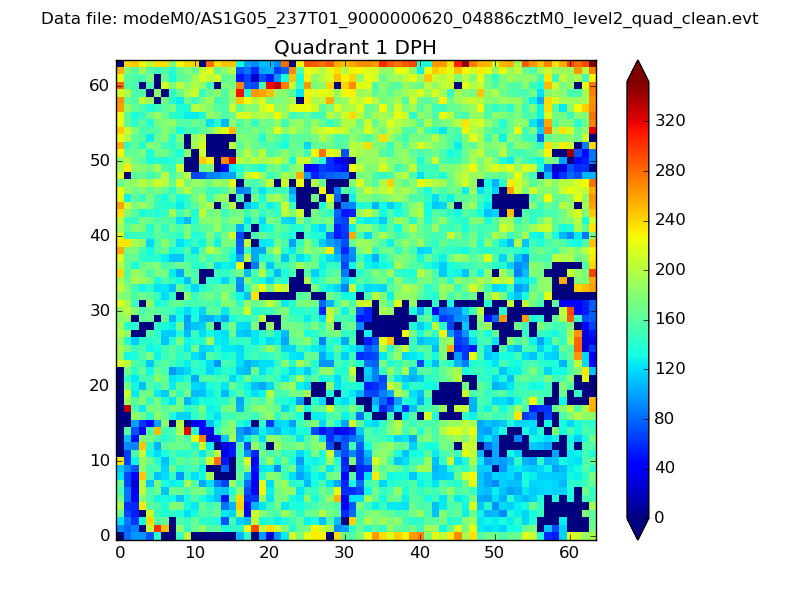 |
Quadrant B |
|---|---|---|---|
| Quadrant D | 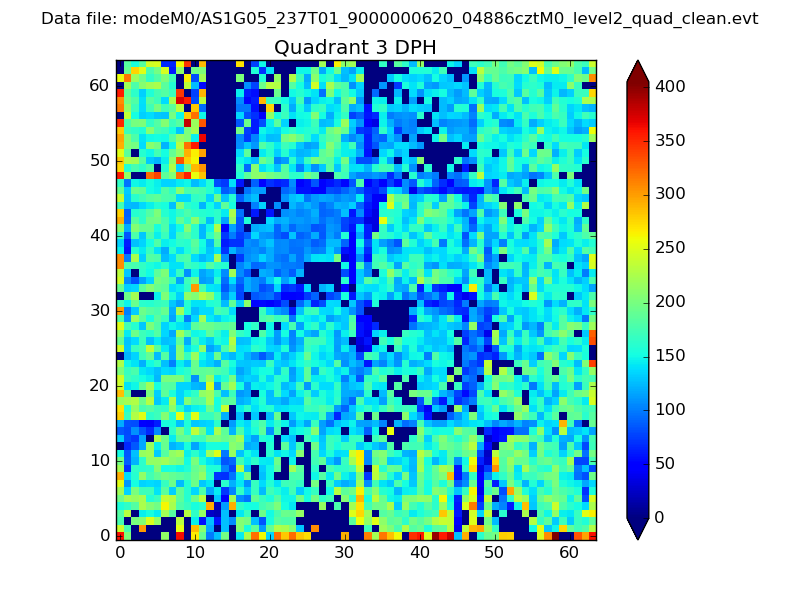 |
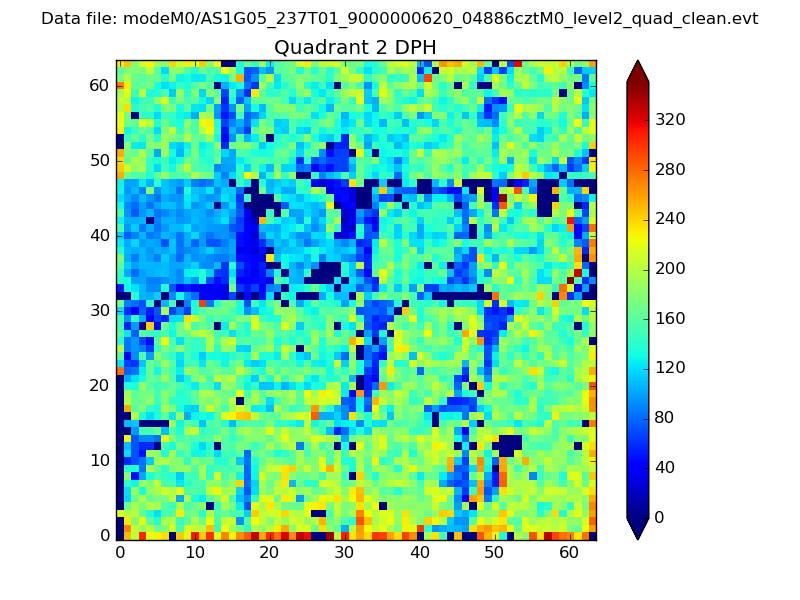 |
Quadrant C |
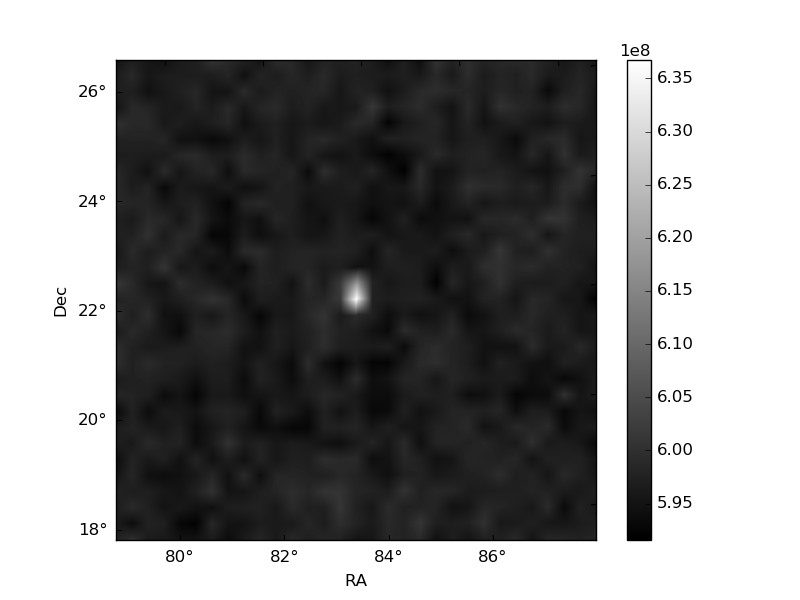
| Plot type | Count rate plots | Images |
|---|---|---|
| Comparison with Poisson distribution Blue bars denote a histogram of data divided into 1 sec bins. Red curve is a Poisson curve with rate = median count rate of data. |
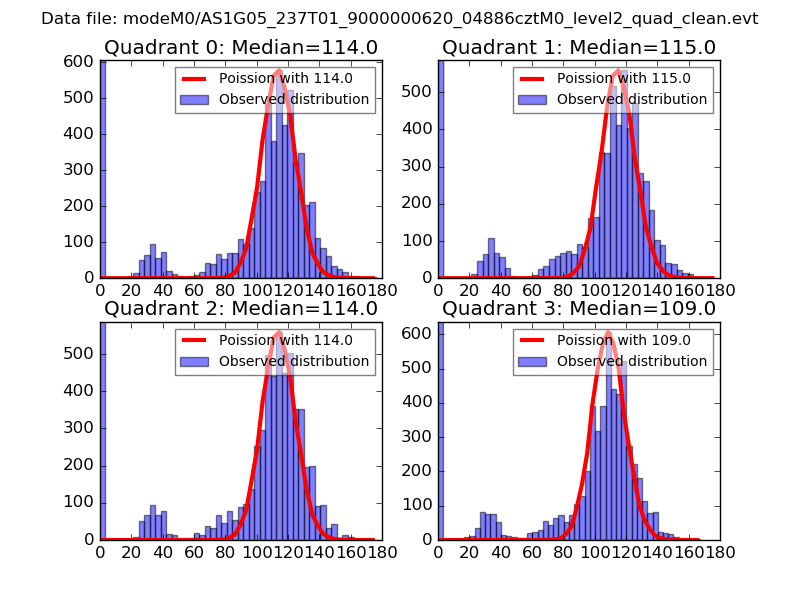 |
 |
| Quadrant-wise count rates Data is divided into 100 sec bins |
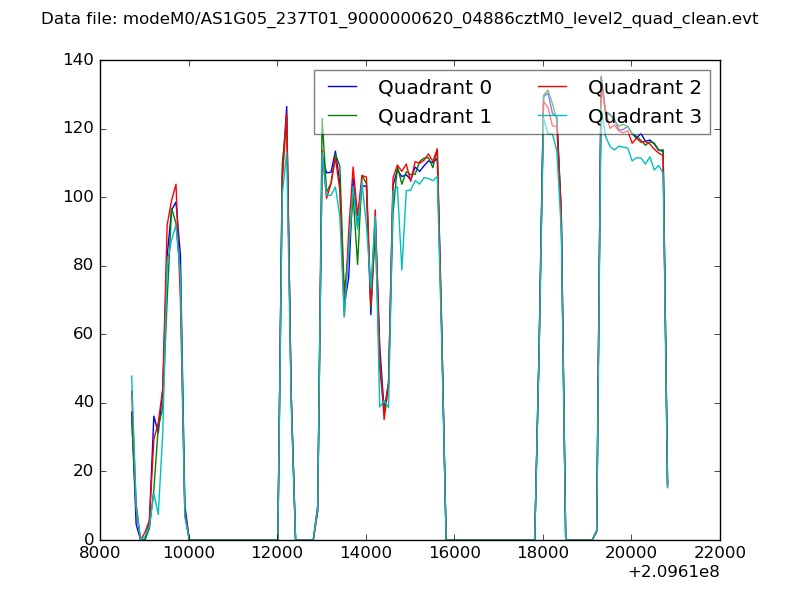 |
|
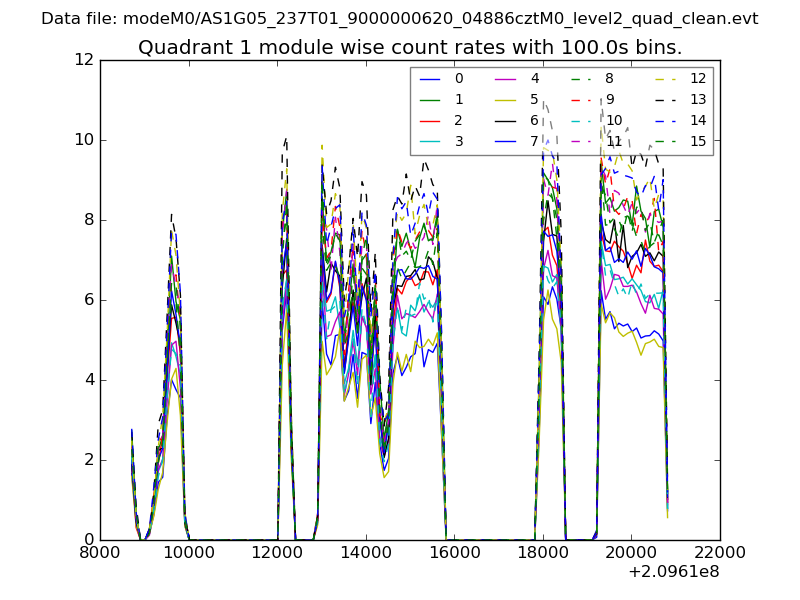
| Module-wise count rates for Quadrant A Data is divided into 100 sec bins |
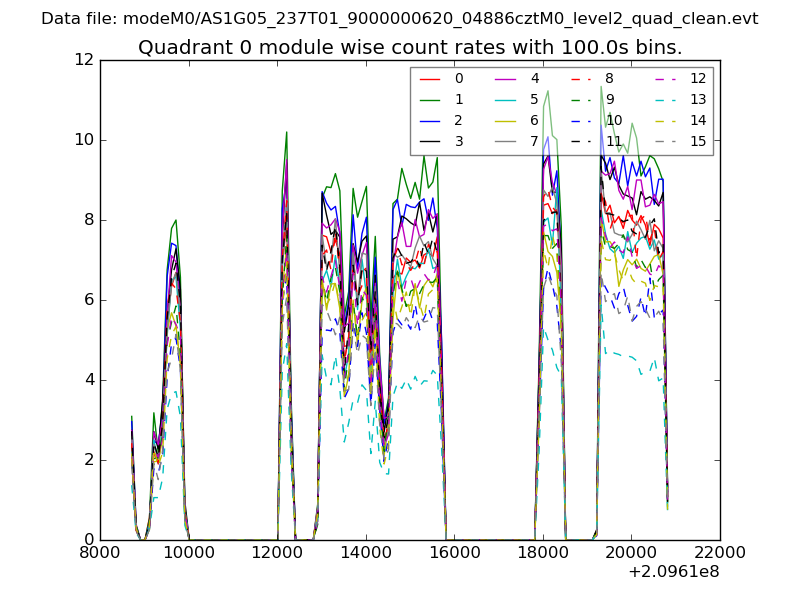 |
 |
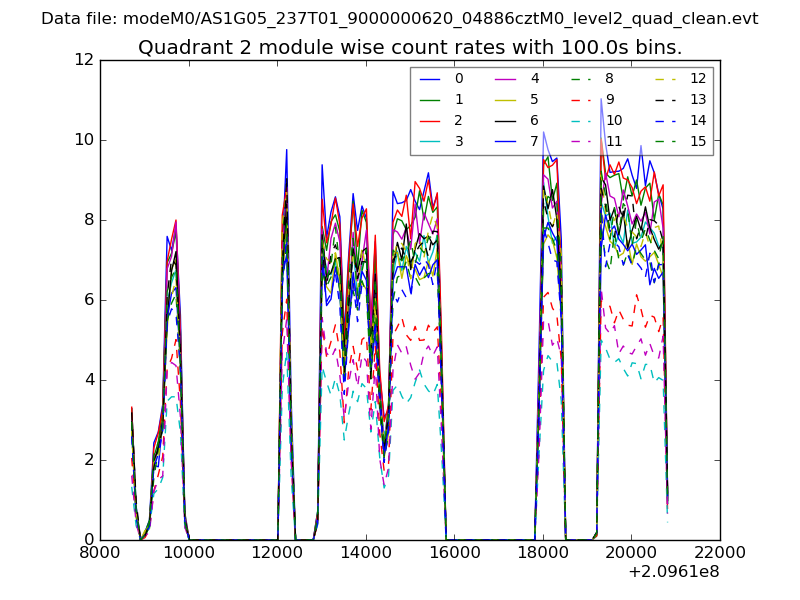
| Module-wise count rates for Quadrant B Data is divided into 100 sec bins |
 |
 |
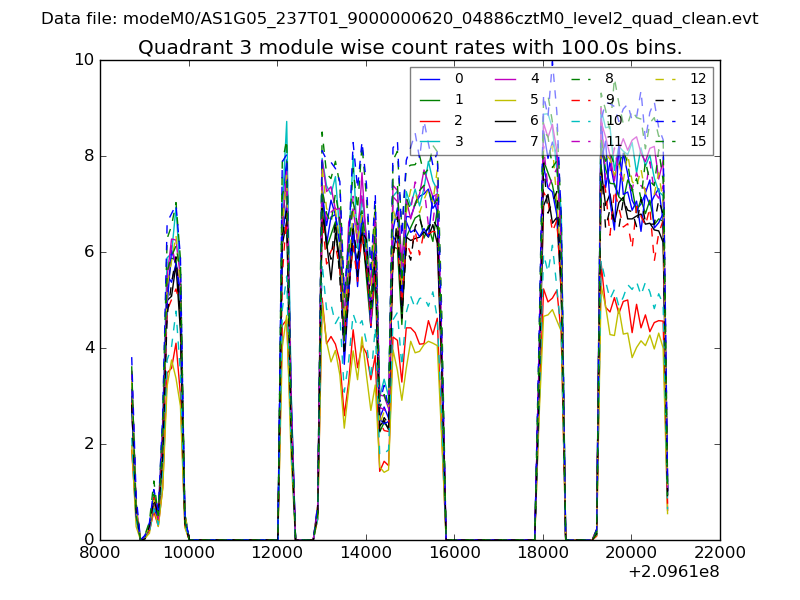
| Module-wise count rates for Quadrant C Data is divided into 100 sec bins |
 |
 |
| Module-wise count rates for Quadrant D Data is divided into 100 sec bins |
 |
 |
| Parameter | Plot |
|---|---|
| CZT HV Monitor | 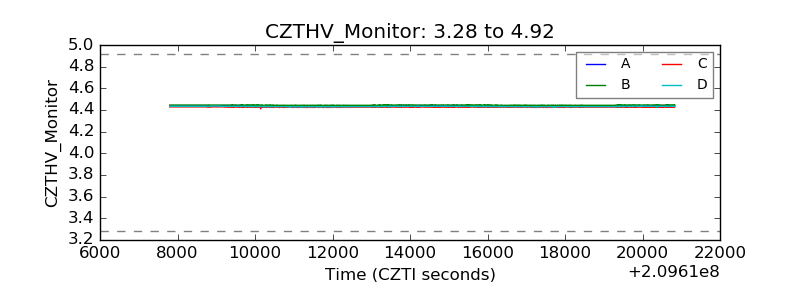 |
| D_VDD | 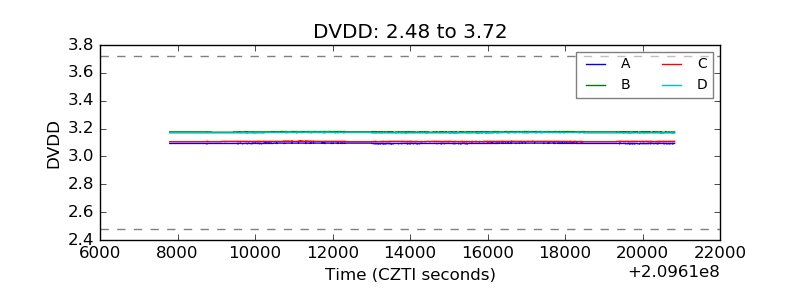 |
| Temperature 1 | 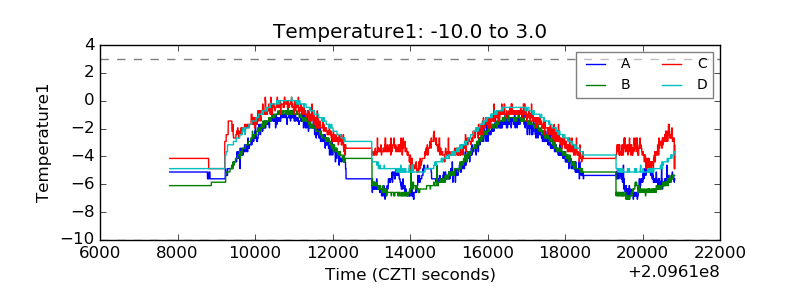 |
| Veto HV Monitor | 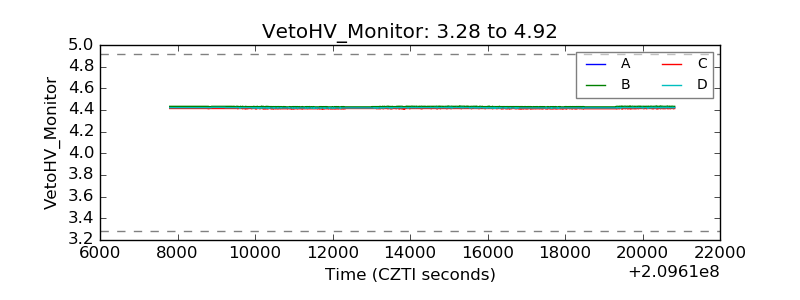 |
| Veto LLD | 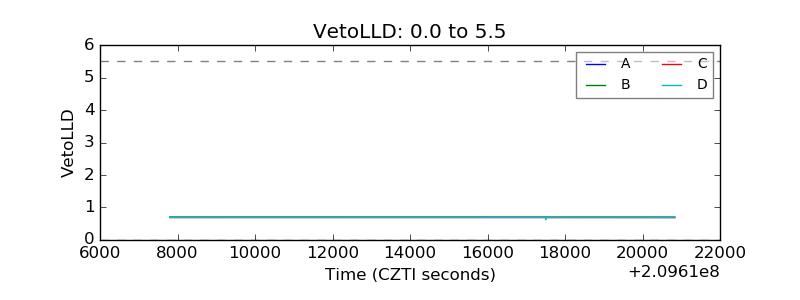 |
| Alpha Counter | 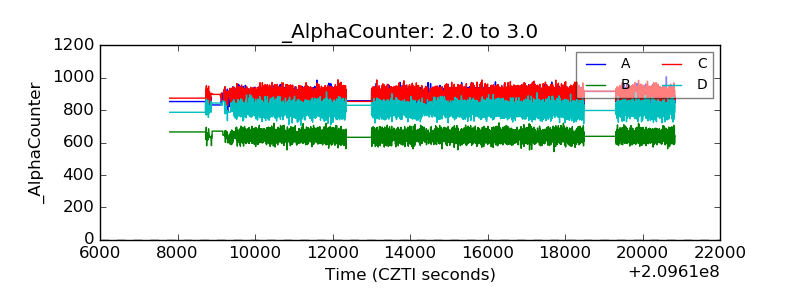 |
| _CPM_Rate | 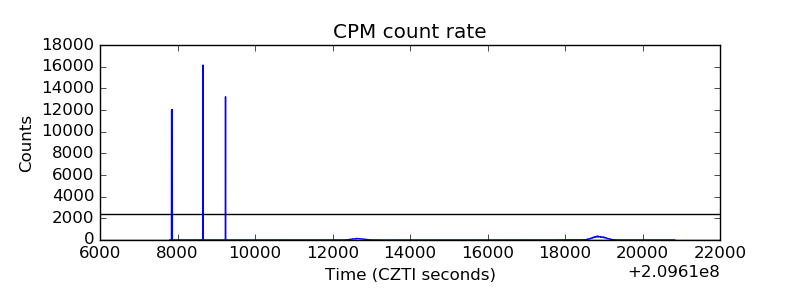 |
| CZT Counter | 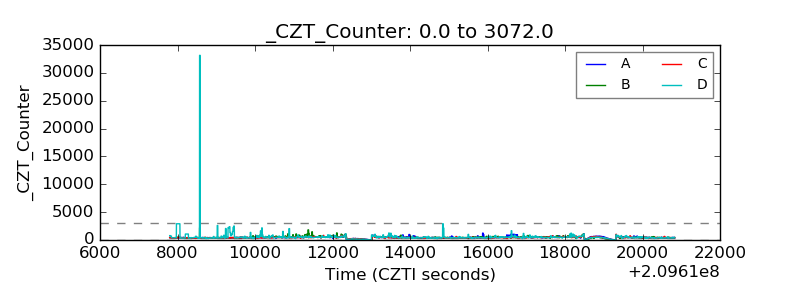 |
| +2.5 Volts monitor |  |
| +5 Volts monitor |  |
| _ROLL_ROT | 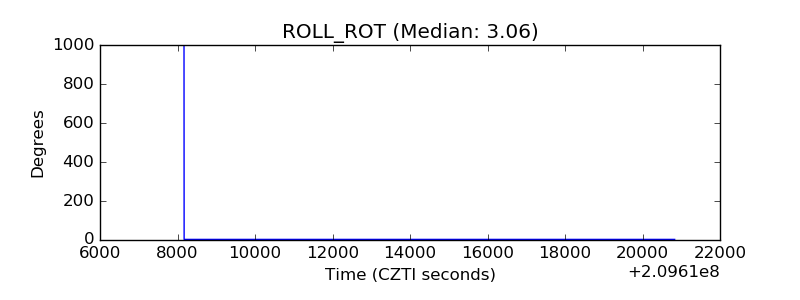 |
| _Roll_DEC | 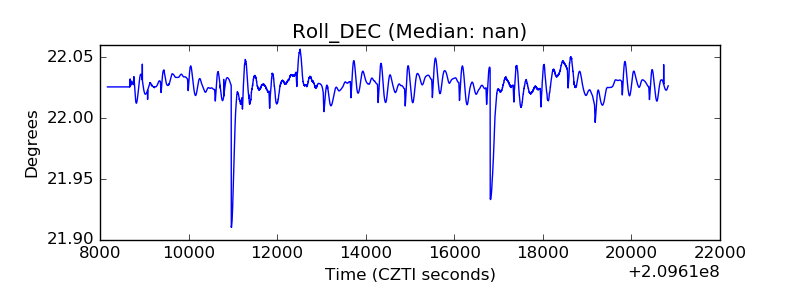 |
| _Roll_RA | 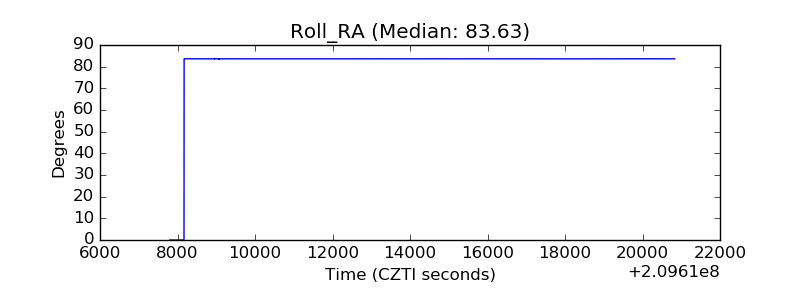 |
| Veto Counter | 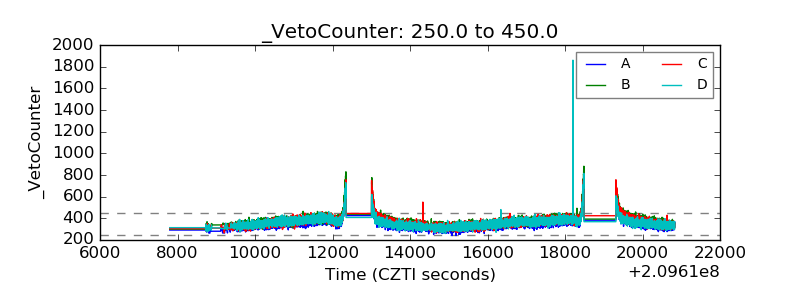 |