| Param | Original file | Final file |
|---|---|---|
| Filename | modeM0/AS1G05_237T01_9000000620_04887cztM0_level2.evt | modeM0/AS1G05_237T01_9000000620_04887cztM0_level2_quad_clean.evt |
| Size (bytes) | 1,075,996,800 | 178,580,160 |
| Size | 1.0 GB | 170.3 MB |
| Events in quadrant A | 7,536,752 | 1,097,512 |
| Events in quadrant B | 7,545,351 | 1,105,602 |
| Events in quadrant C | 6,875,384 | 1,097,726 |
| Events in quadrant D | 9,572,300 | 1,029,994 |
| Mode M9 | |||
|---|---|---|---|
| Quadrant | BADHDUFLAG | Total packets | Discarded packets |
| A | 0 | 15 | 0 |
| B | 0 | 15 | 0 |
| C | 0 | 15 | 0 |
| D | 0 | 15 | 0 |
| Mode SS | |||
|---|---|---|---|
| Quadrant | BADHDUFLAG | Total packets | Discarded packets |
| A | 0 | 314 | 0 |
| B | 0 | 314 | 0 |
| C | 0 | 314 | 0 |
| D | 0 | 314 | 2 |
| Mode M0 | |||
|---|---|---|---|
| Quadrant | BADHDUFLAG | Total packets | Discarded packets |
| A | 0 | 33178 | 21 |
| B | 0 | 32980 | 21 |
| C | 0 | 31669 | 26 |
| D | 0 | 39534 | 36 |
| Quadrant | Total seconds | Saturated seconds | Saturation percentage |
|---|---|---|---|
| A | 15622 | 151 | 0.966586% |
| B | 15622 | 94 | 0.601716% |
| C | 15619 | 35 | 0.224086% |
| D | 15617 | 883 | 5.654095% |
Noise dominated data is calculated using 1-second bins in cleaned event files. If a bin has >2000 counts, and if more than 50% of those come from <1% of pixels, then it is considered to be noise-dominated and hence unusable.
| Quadrant | # 1 sec bins | Bins with >0 counts | Bins with >2000 counts | High rate bins dominated by noise | Noise dominated (total time) | Noise dominated (detector-on time) | Marked lightcurve |
|---|---|---|---|---|---|---|---|
| A | 25664 | 15632 | 103 | 103 | 0.40% | 0.66% | 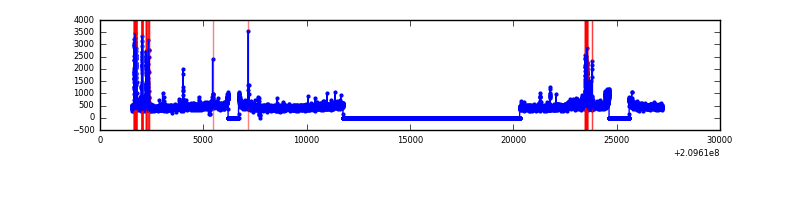 |
| B | 25664 | 15633 | 4 | 4 | 0.02% | 0.03% | 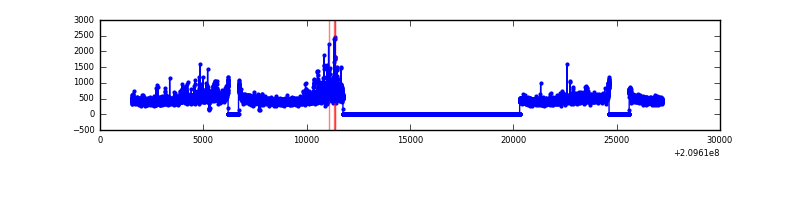 |
| C | 25664 | 15634 | 0 | 0 | 0.00% | 0.00% | 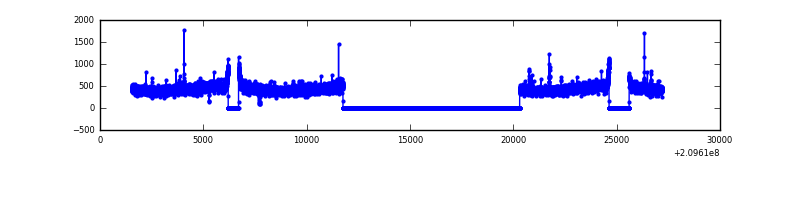 |
| D | 25664 | 15629 | 643 | 643 | 2.51% | 4.11% | 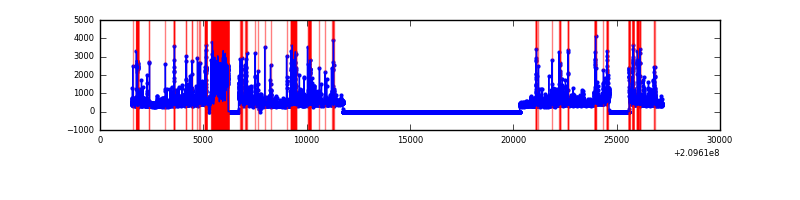 |
Top three noisy pixels from each quadrant. If the there are fewer than three noisy pixels in the level2.evt file, extra rows are filled as -1
| Pixel properties | Quadrant properties | ||||||
|---|---|---|---|---|---|---|---|
| Quadrant | DetID | PixID | Counts | Sigma | Mean | Median | Sigma |
| A | 0 | 50 | 334260 | 901.65 | 1803 | 1768 | 368.8 |
| A | 0 | 31 | 214259 | 576.23 | 1803 | 1768 | 368.8 |
| A | 13 | 14 | 24040 | 60.4 | 1803 | 1768 | 368.8 |
| B | 15 | 204 | 281327 | 803.41 | 1822 | 1782 | 347.9 |
| B | 0 | 219 | 97895 | 276.23 | 1822 | 1782 | 347.9 |
| B | 15 | 54 | 71805 | 201.25 | 1822 | 1782 | 347.9 |
| C | 12 | 4 | 18597 | 42.01 | 1742 | 1759 | 400.8 |
| C | 14 | 67 | 15338 | 33.88 | 1742 | 1759 | 400.8 |
| C | 13 | 61 | 14204 | 31.05 | 1742 | 1759 | 400.8 |
| D | 1 | 52 | 1154332 | 2772.38 | 1690 | 1642 | 415.8 |
| D | 13 | 235 | 900046 | 2160.79 | 1690 | 1642 | 415.8 |
| D | 2 | 136 | 444246 | 1064.52 | 1690 | 1642 | 415.8 |
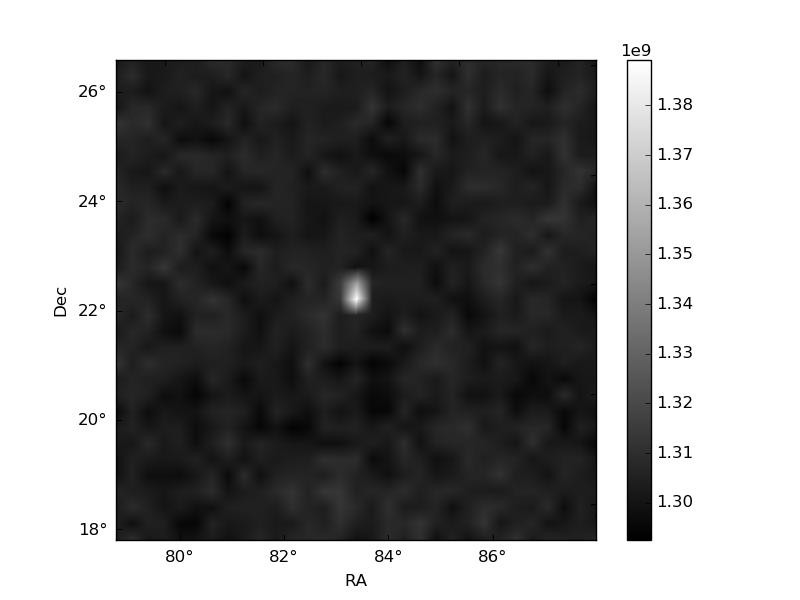
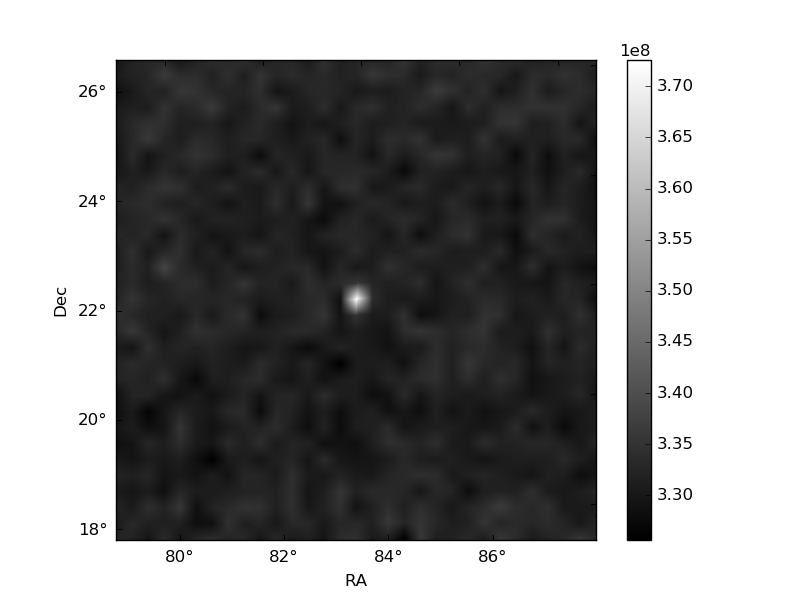
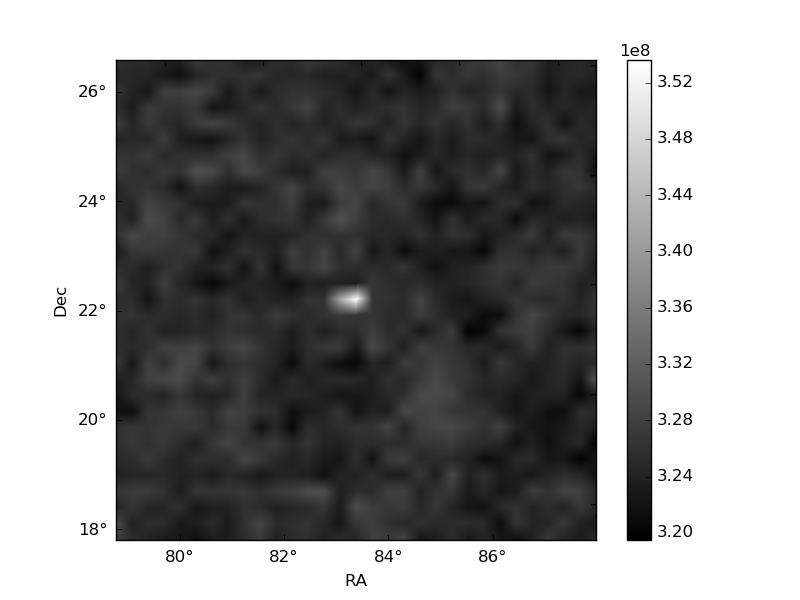
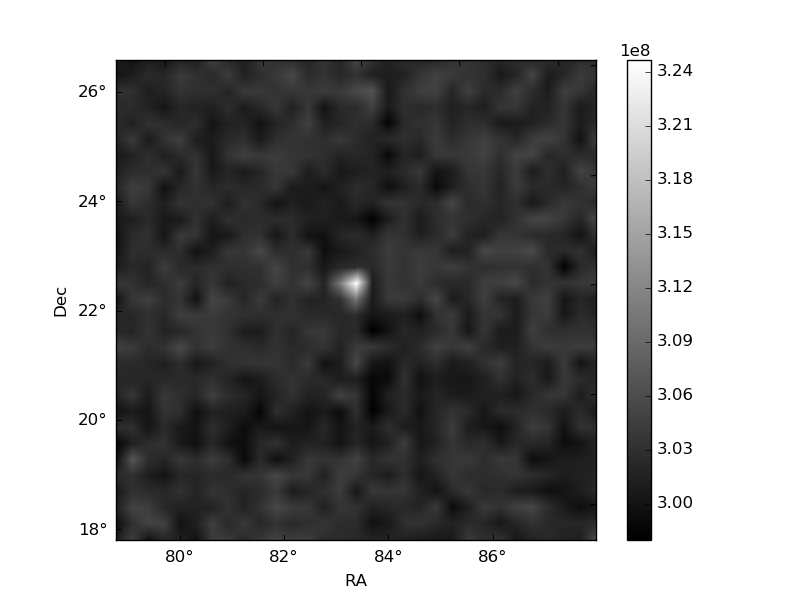
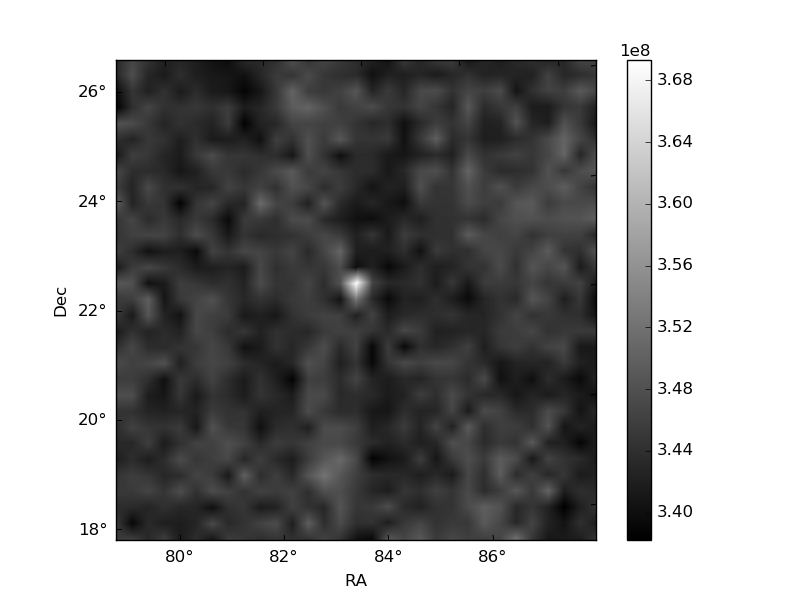
Histogram calculated using DETX and DETY for each event in the final _common_clean file
| Quadrant A | 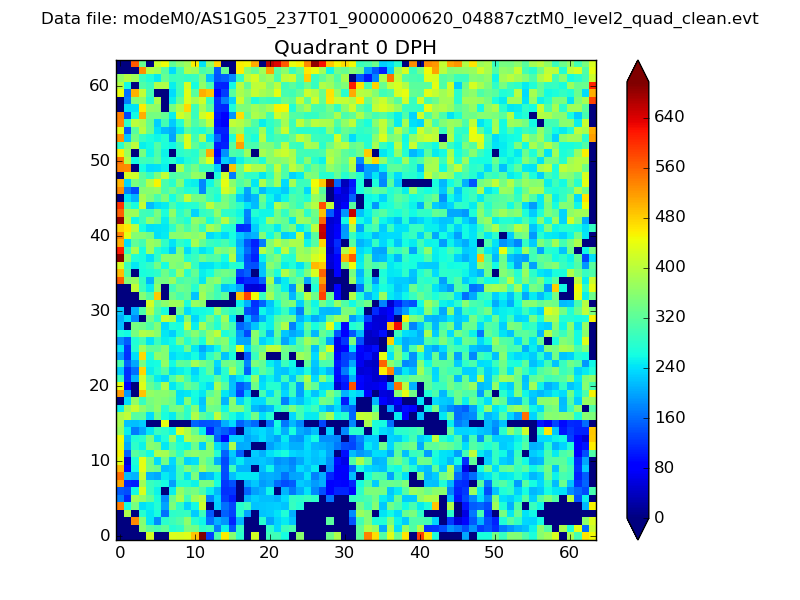 |
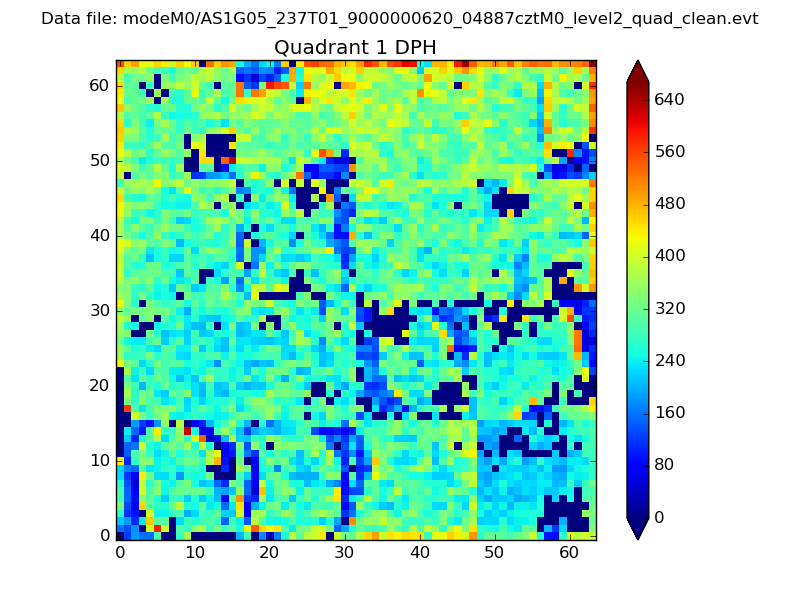 |
Quadrant B |
|---|---|---|---|
| Quadrant D | 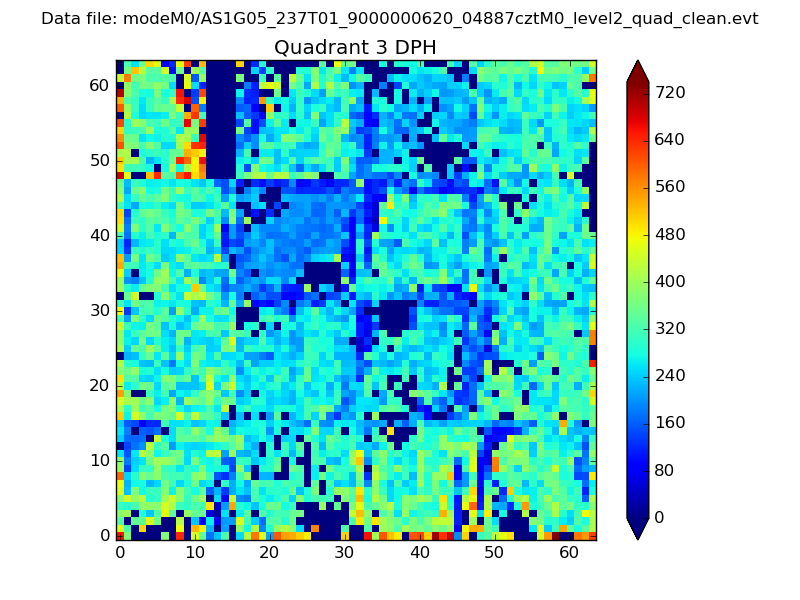 |
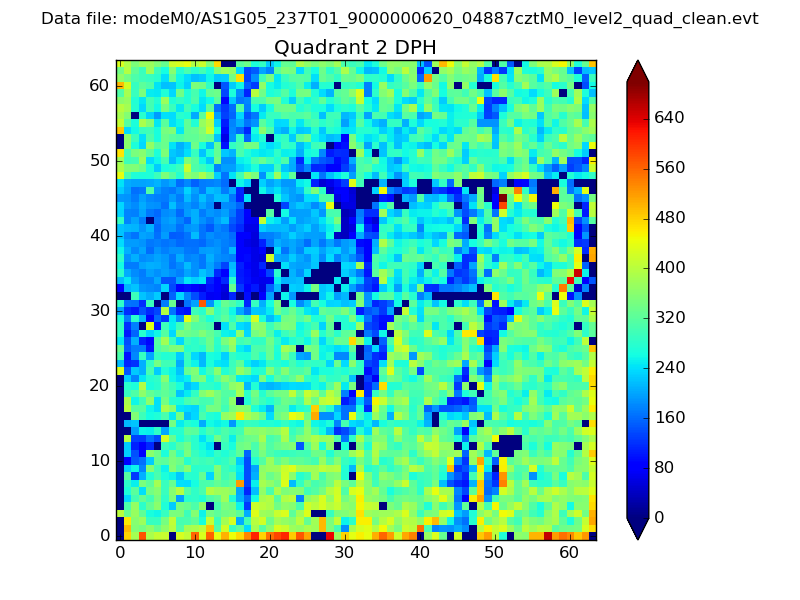 |
Quadrant C |
| Plot type | Count rate plots | Images |
|---|---|---|
| Comparison with Poisson distribution Blue bars denote a histogram of data divided into 1 sec bins. Red curve is a Poisson curve with rate = median count rate of data. |
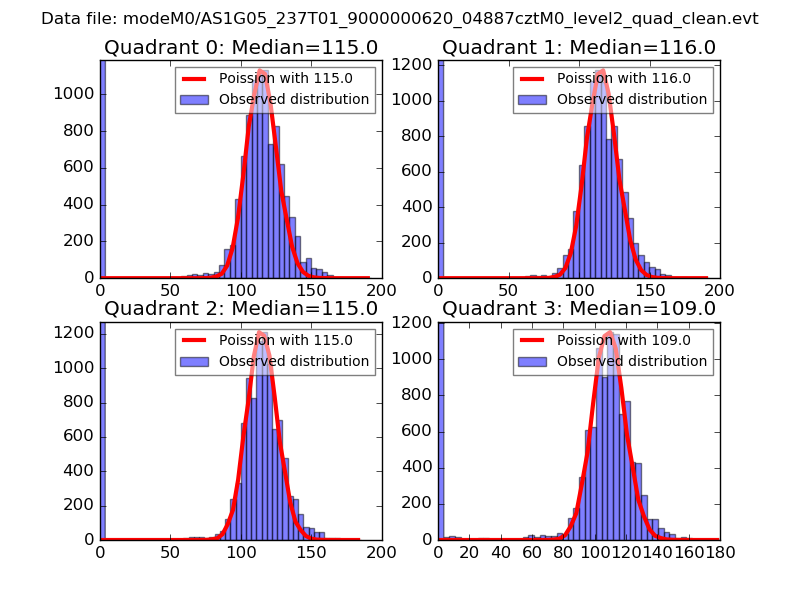 |
 |
| Quadrant-wise count rates Data is divided into 100 sec bins |
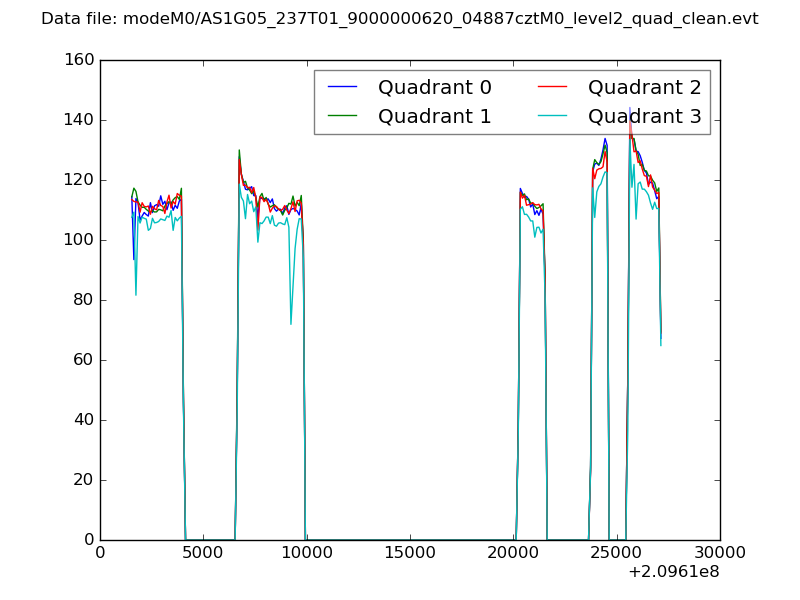 |
|
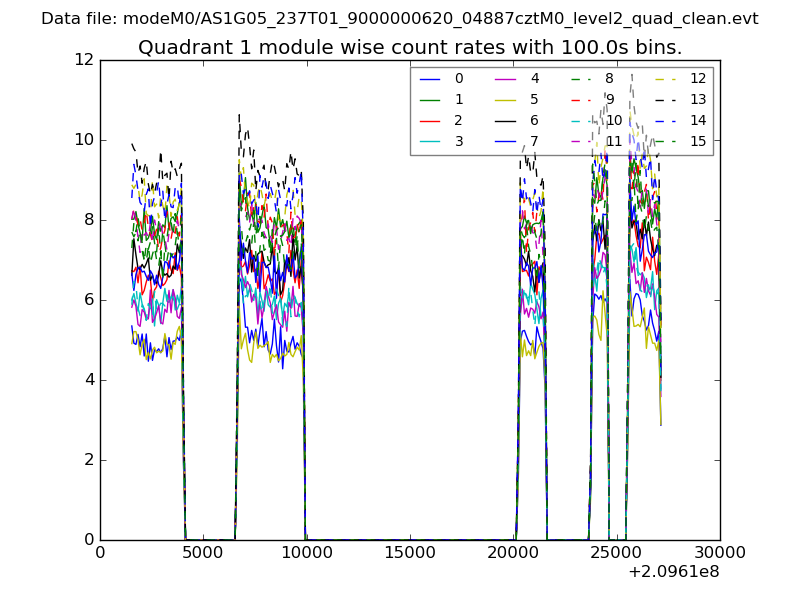
| Module-wise count rates for Quadrant A Data is divided into 100 sec bins |
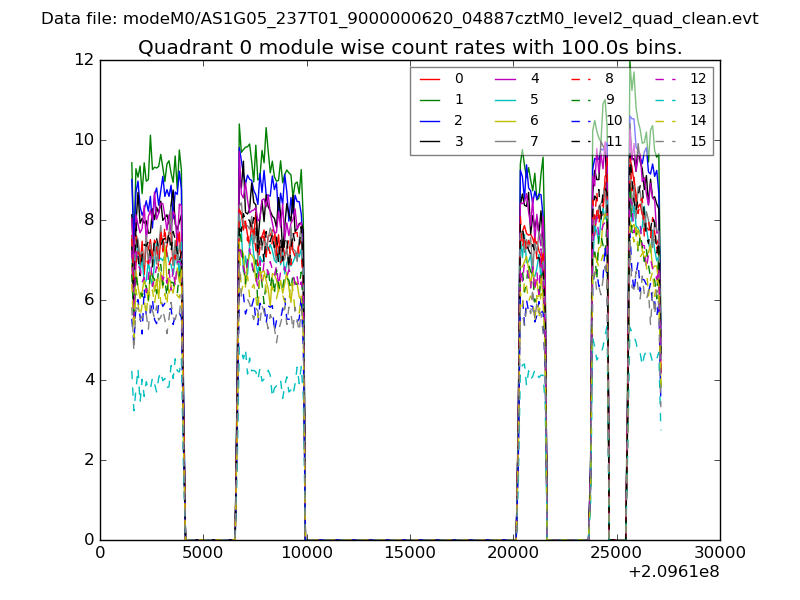 |
 |
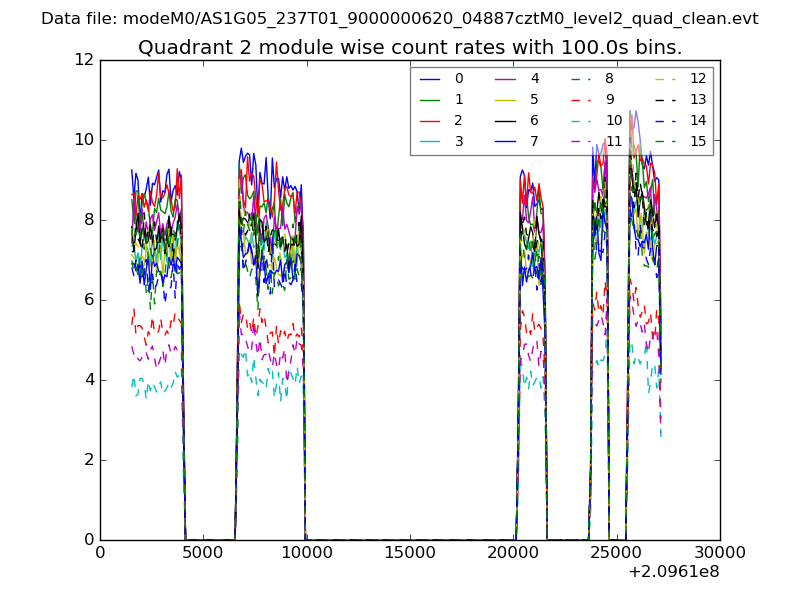
| Module-wise count rates for Quadrant B Data is divided into 100 sec bins |
 |
 |
| Module-wise count rates for Quadrant C Data is divided into 100 sec bins |
 |
 |
| Module-wise count rates for Quadrant D Data is divided into 100 sec bins |
 |
 |
| Parameter | Plot |
|---|---|
| CZT HV Monitor | 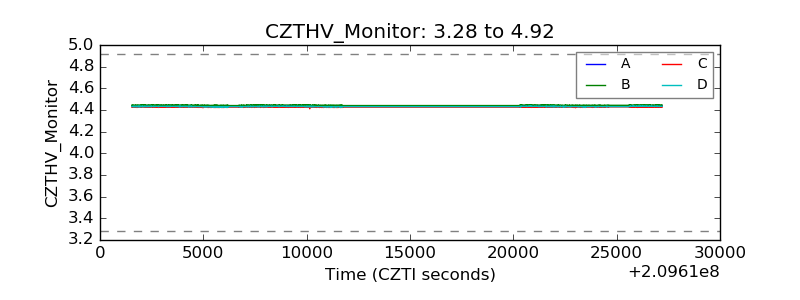 |
| D_VDD | 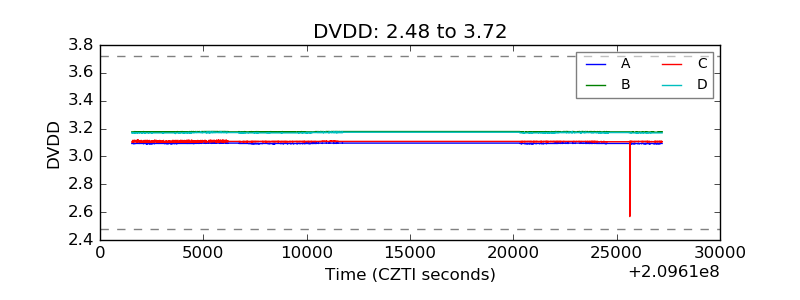 |
| Temperature 1 | 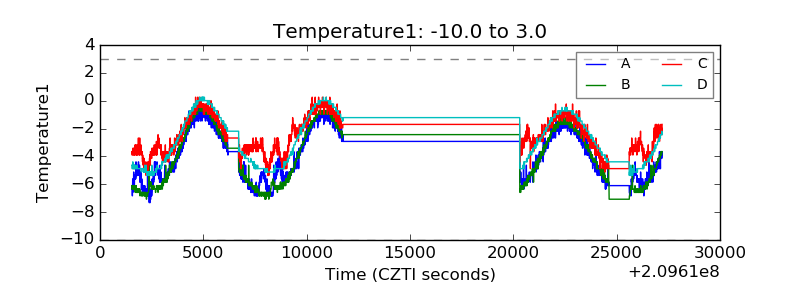 |
| Veto HV Monitor | 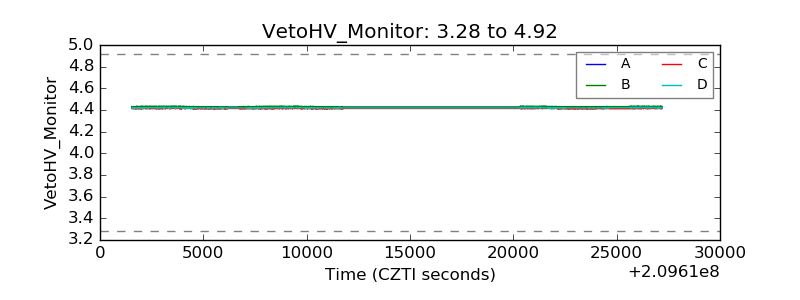 |
| Veto LLD | 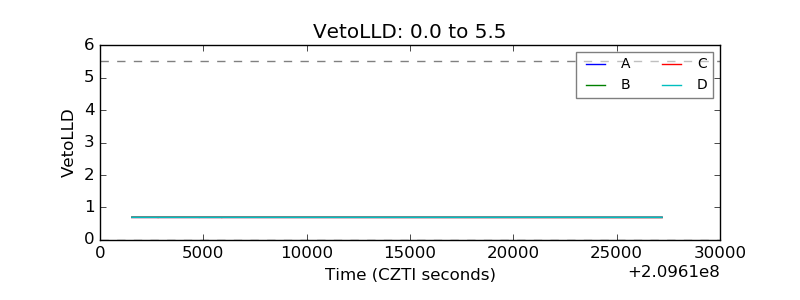 |
| Alpha Counter | 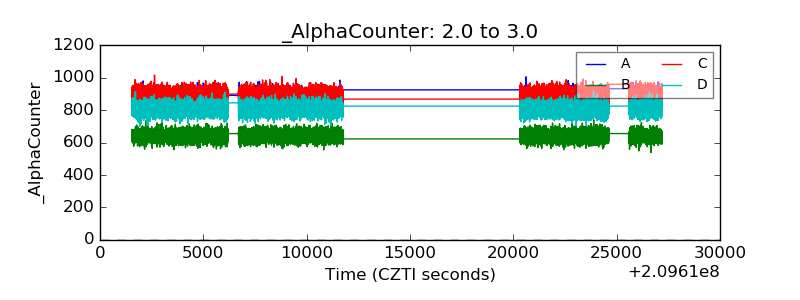 |
| _CPM_Rate | 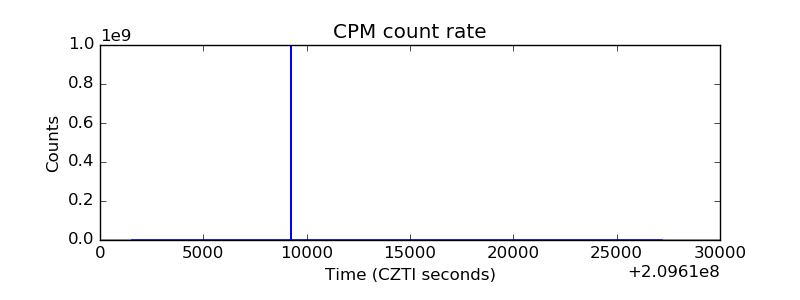 |
| CZT Counter | 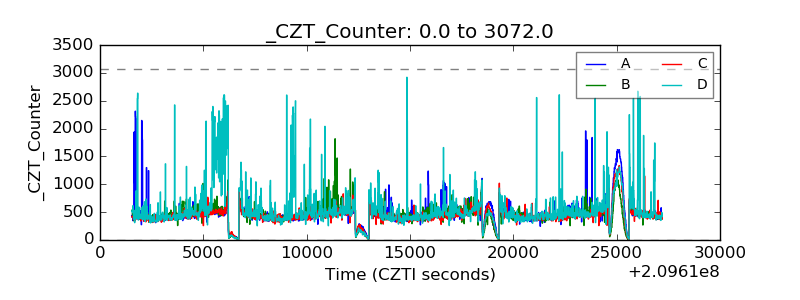 |
| +2.5 Volts monitor |  |
| +5 Volts monitor | 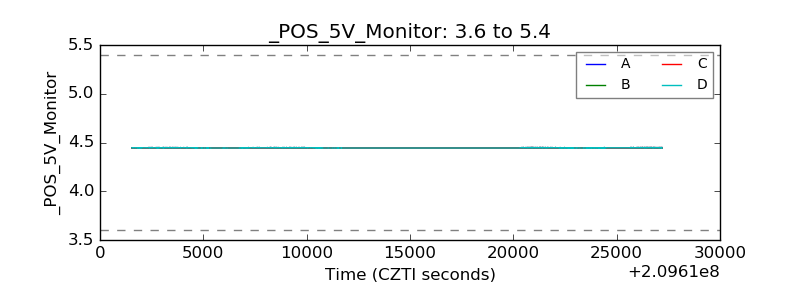 |
| _ROLL_ROT | 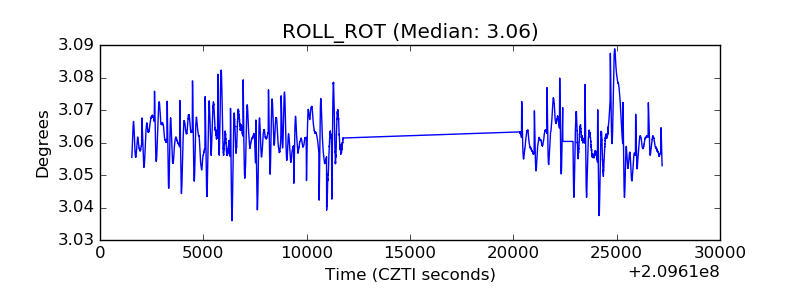 |
| _Roll_DEC | 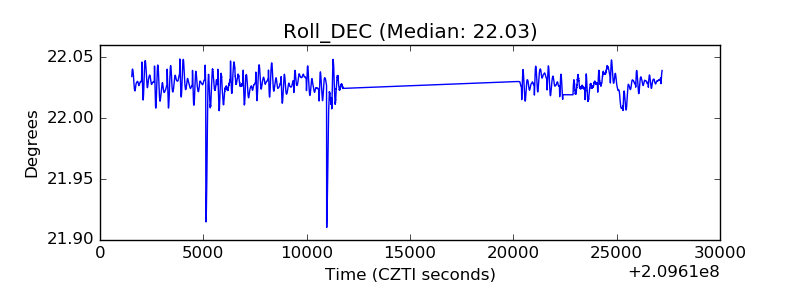 |
| _Roll_RA | 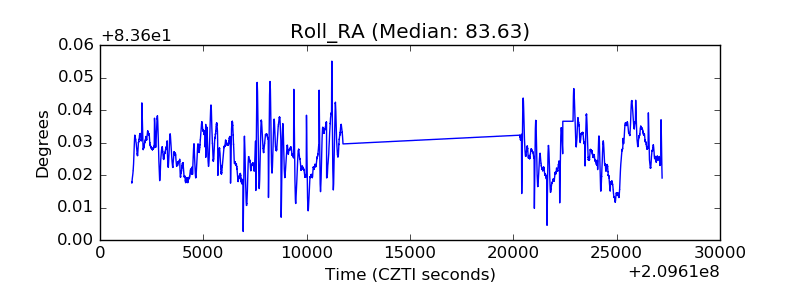 |
| Veto Counter | 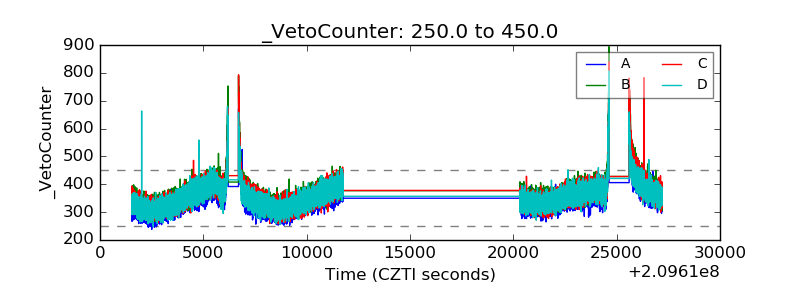 |