| Param | Original file | Final file |
|---|---|---|
| Filename | modeM0/AS1G05_237T01_9000000620_04889cztM0_level2.evt | modeM0/AS1G05_237T01_9000000620_04889cztM0_level2_quad_clean.evt |
| Size (bytes) | 417,677,760 | 76,645,440 |
| Size | 398.3 MB | 73.1 MB |
| Events in quadrant A | 2,977,596 | 480,319 |
| Events in quadrant B | 2,960,692 | 484,244 |
| Events in quadrant C | 2,788,522 | 476,474 |
| Events in quadrant D | 3,506,686 | 452,823 |
| Mode M9 | |||
|---|---|---|---|
| Quadrant | BADHDUFLAG | Total packets | Discarded packets |
| A | 0 | 11 | 0 |
| B | 0 | 11 | 0 |
| C | 0 | 11 | 0 |
| D | 0 | 11 | 0 |
| Mode SS | |||
|---|---|---|---|
| Quadrant | BADHDUFLAG | Total packets | Discarded packets |
| A | 0 | 124 | 0 |
| B | 0 | 124 | 0 |
| C | 0 | 124 | 0 |
| D | 0 | 124 | 0 |
| Mode M0 | |||
|---|---|---|---|
| Quadrant | BADHDUFLAG | Total packets | Discarded packets |
| A | 0 | 12687 | 2 |
| B | 0 | 12554 | 1 |
| C | 0 | 12442 | 1 |
| D | 0 | 14439 | 1 |
| Quadrant | Total seconds | Saturated seconds | Saturation percentage |
|---|---|---|---|
| A | 6117 | 53 | 0.866438% |
| B | 6117 | 44 | 0.719307% |
| C | 6117 | 27 | 0.441393% |
| D | 6117 | 89 | 1.454962% |
Noise dominated data is calculated using 1-second bins in cleaned event files. If a bin has >2000 counts, and if more than 50% of those come from <1% of pixels, then it is considered to be noise-dominated and hence unusable.
| Quadrant | # 1 sec bins | Bins with >0 counts | Bins with >2000 counts | High rate bins dominated by noise | Noise dominated (total time) | Noise dominated (detector-on time) | Marked lightcurve |
|---|---|---|---|---|---|---|---|
| A | 7212 | 6117 | 3 | 3 | 0.04% | 0.05% | 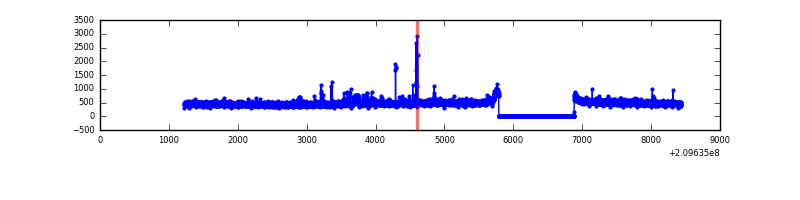 |
| B | 7212 | 6117 | 0 | 0 | 0.00% | 0.00% | 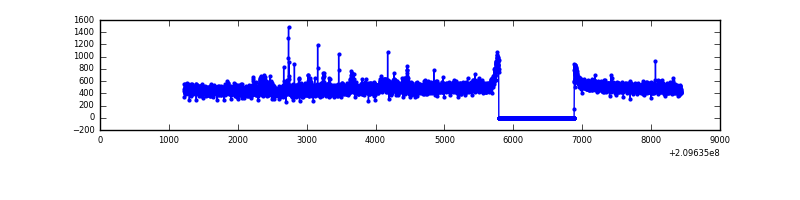 |
| C | 7212 | 6117 | 0 | 0 | 0.00% | 0.00% | 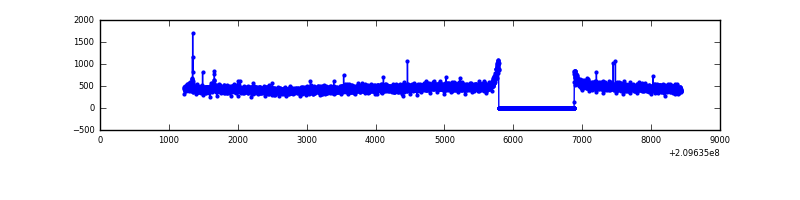 |
| D | 7212 | 6117 | 47 | 47 | 0.65% | 0.77% | 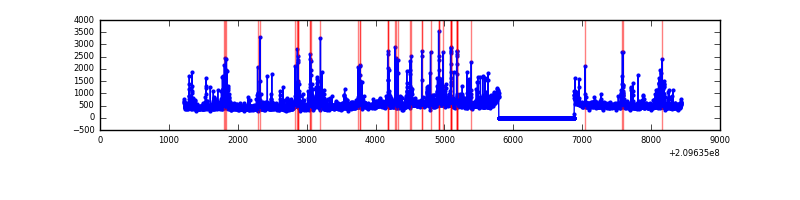 |
Top three noisy pixels from each quadrant. If the there are fewer than three noisy pixels in the level2.evt file, extra rows are filled as -1
| Pixel properties | Quadrant properties | ||||||
|---|---|---|---|---|---|---|---|
| Quadrant | DetID | PixID | Counts | Sigma | Mean | Median | Sigma |
| A | 0 | 31 | 71942 | 468.11 | 737 | 722 | 152.1 |
| A | 13 | 14 | 35751 | 230.24 | 737 | 722 | 152.1 |
| A | 8 | 15 | 18668 | 117.96 | 737 | 722 | 152.1 |
| B | 15 | 204 | 42205 | 291.48 | 740 | 727 | 142.3 |
| B | 15 | 54 | 23726 | 161.62 | 740 | 727 | 142.3 |
| B | 0 | 183 | 13009 | 86.31 | 740 | 727 | 142.3 |
| C | 14 | 67 | 14370 | 83.12 | 707 | 714 | 164.3 |
| C | 1 | 16 | 6815 | 37.13 | 707 | 714 | 164.3 |
| C | 13 | 61 | 5810 | 31.02 | 707 | 714 | 164.3 |
| D | 2 | 136 | 304097 | 1723.29 | 711 | 690 | 176.1 |
| D | 13 | 235 | 129225 | 730.05 | 711 | 690 | 176.1 |
| D | 13 | 105 | 113500 | 640.74 | 711 | 690 | 176.1 |
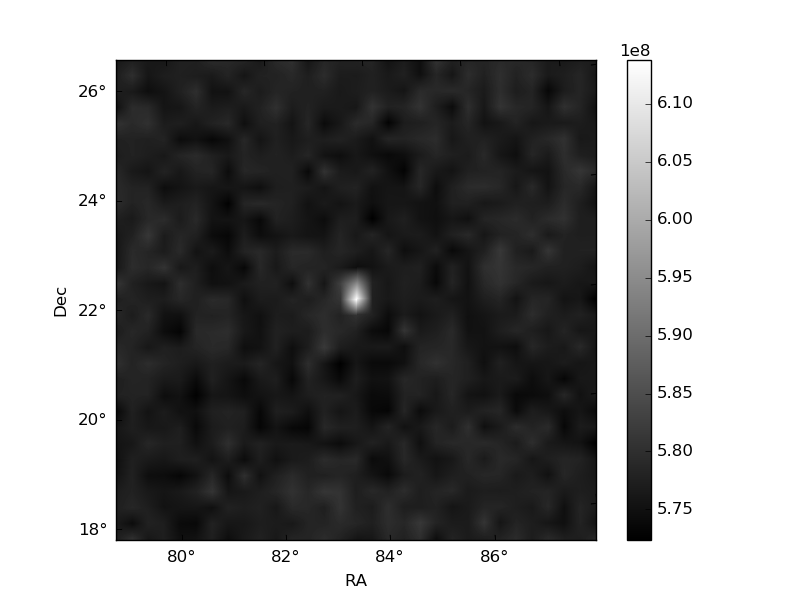
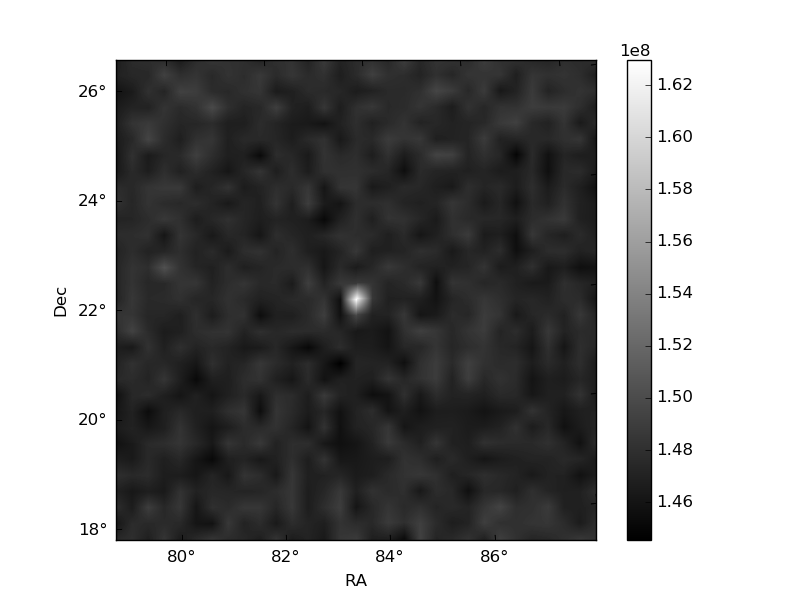
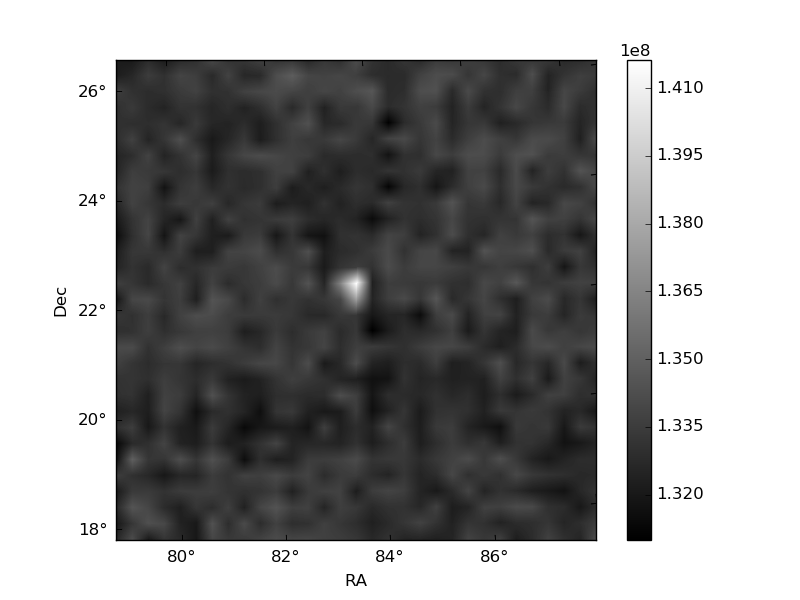
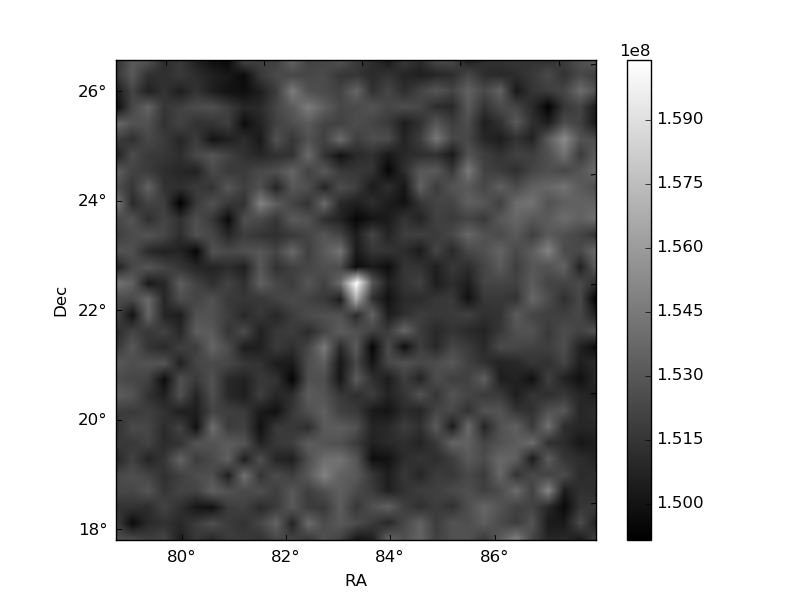
Histogram calculated using DETX and DETY for each event in the final _common_clean file
| Quadrant A | 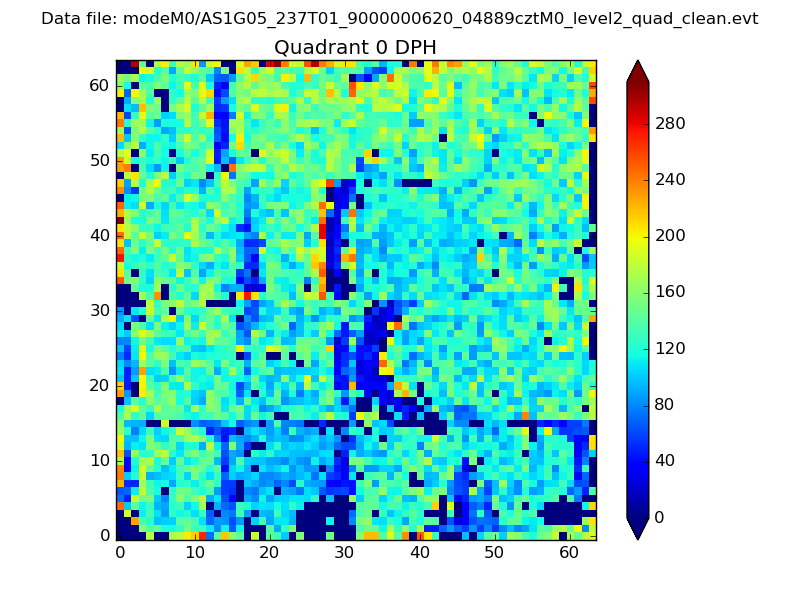 |
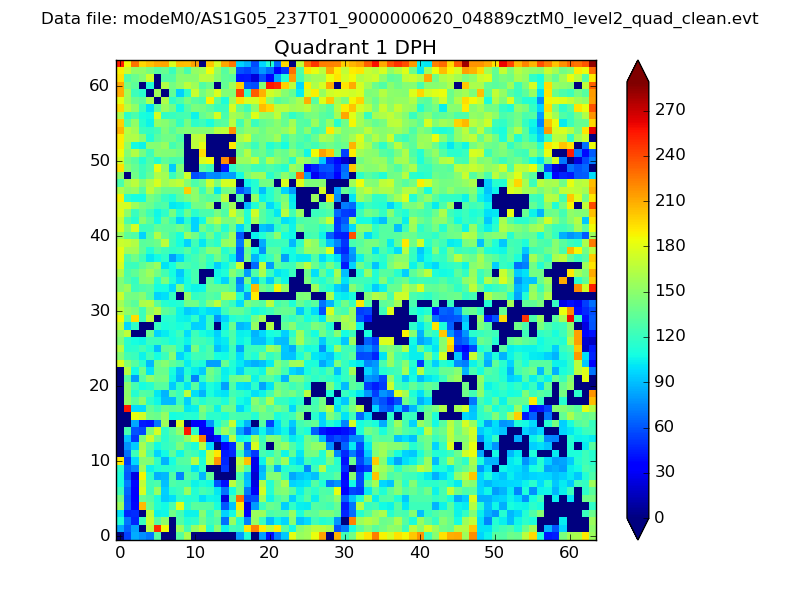 |
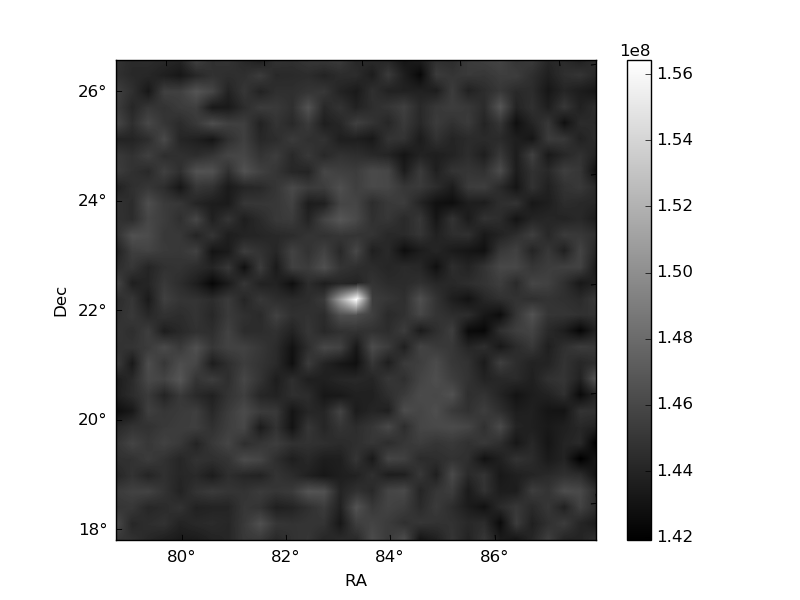
Quadrant B |
|---|---|---|---|
| Quadrant D | 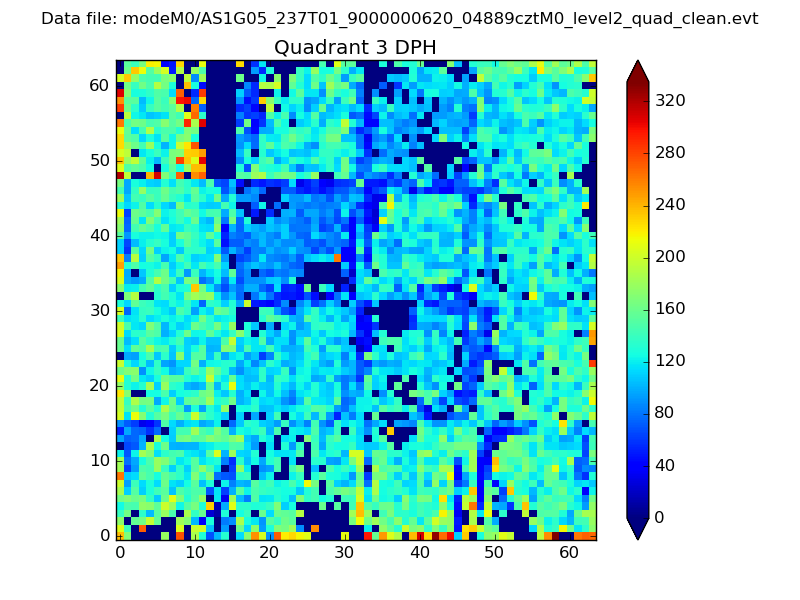 |
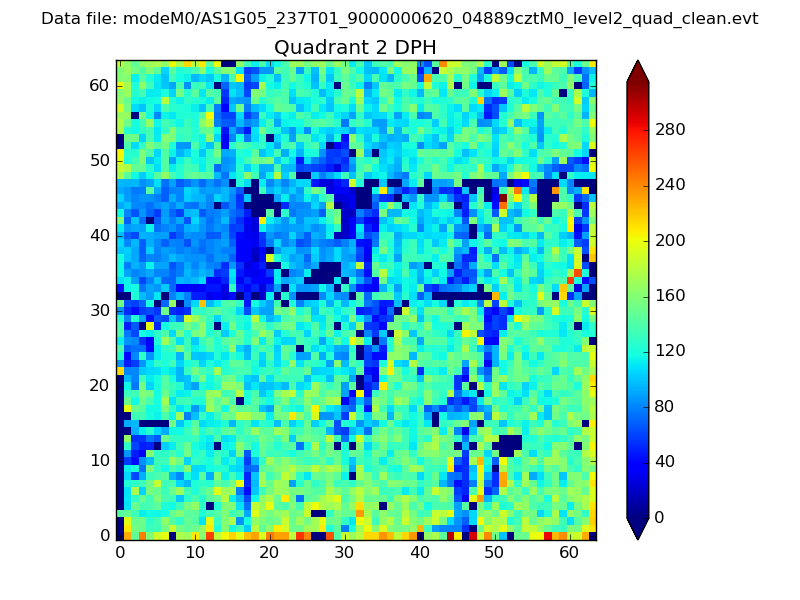 |
Quadrant C |
| Plot type | Count rate plots | Images |
|---|---|---|
| Comparison with Poisson distribution Blue bars denote a histogram of data divided into 1 sec bins. Red curve is a Poisson curve with rate = median count rate of data. |
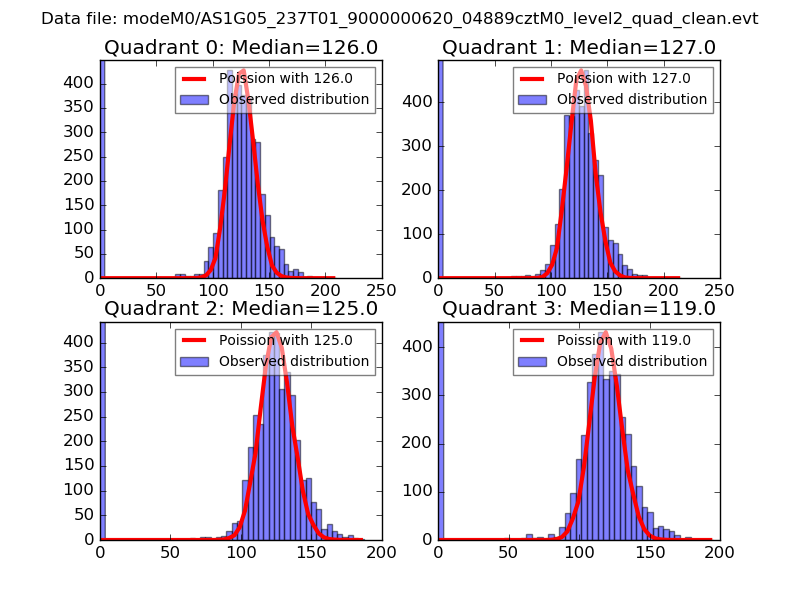 |
 |
| Quadrant-wise count rates Data is divided into 100 sec bins |
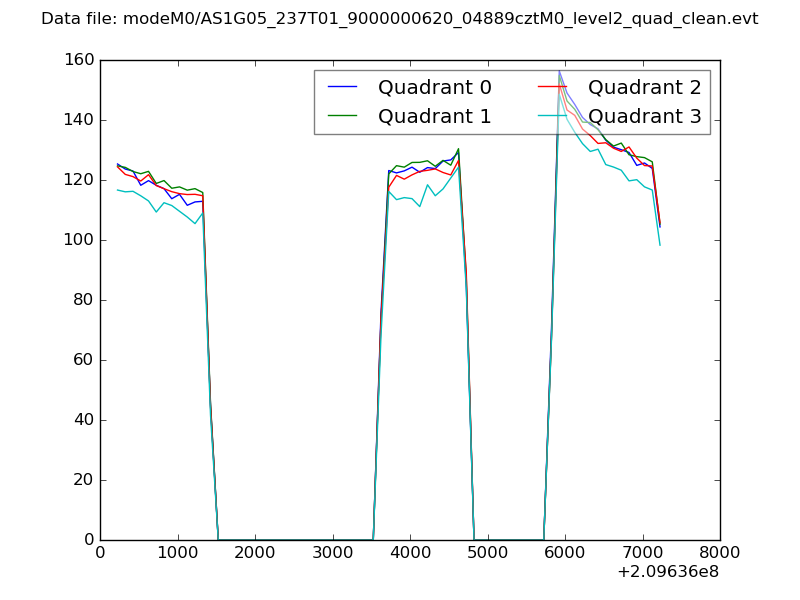 |
|
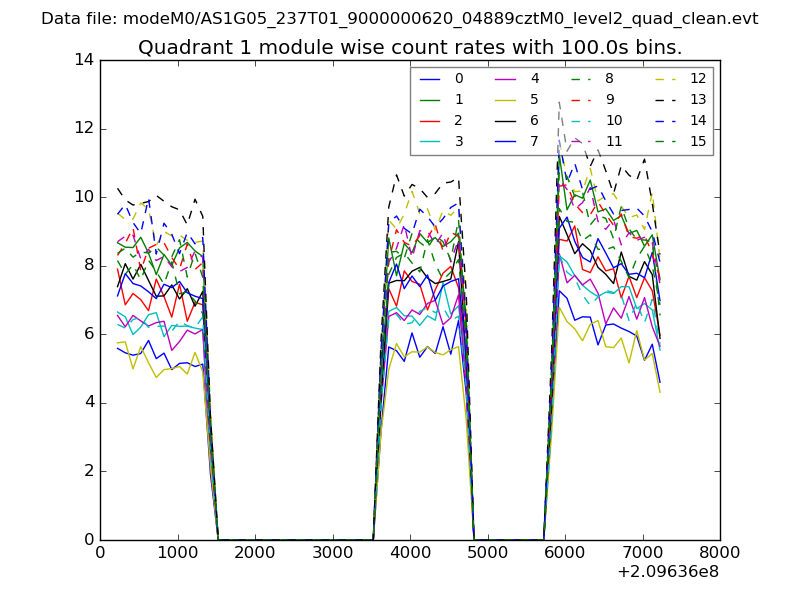
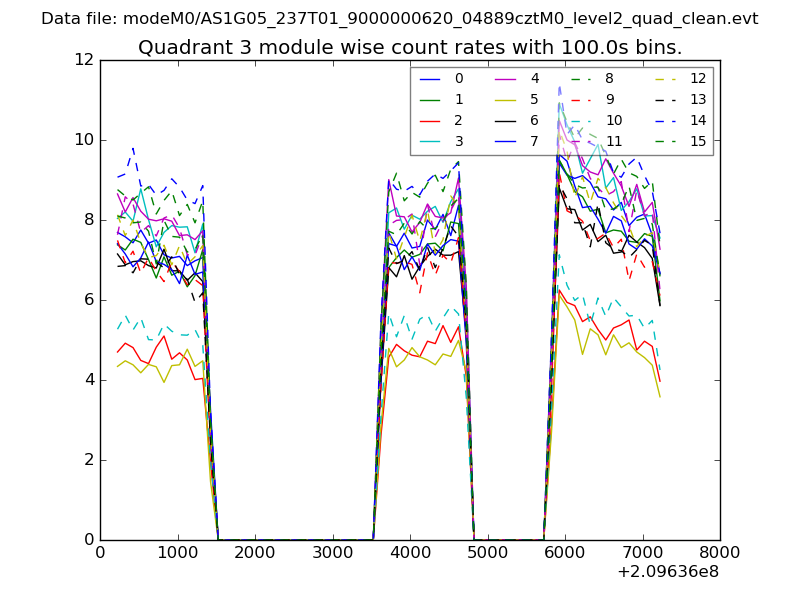
| Module-wise count rates for Quadrant A Data is divided into 100 sec bins |
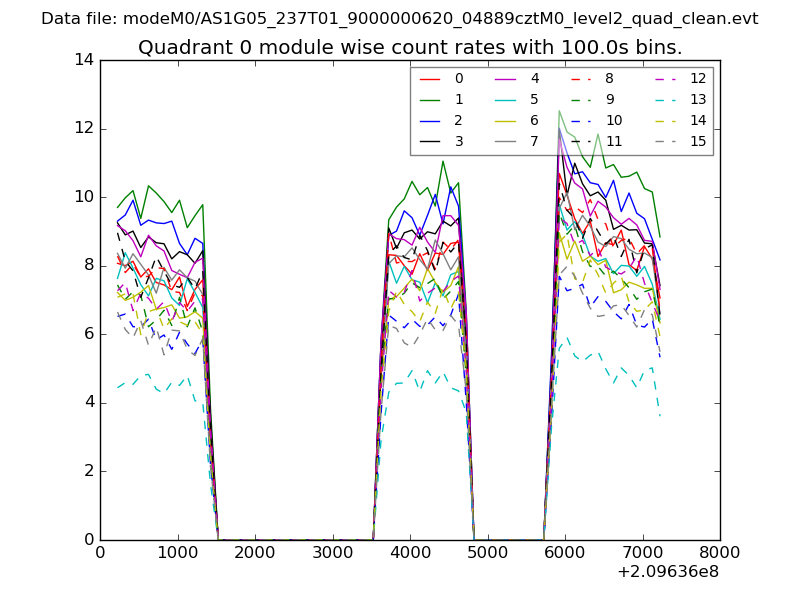 |
 |
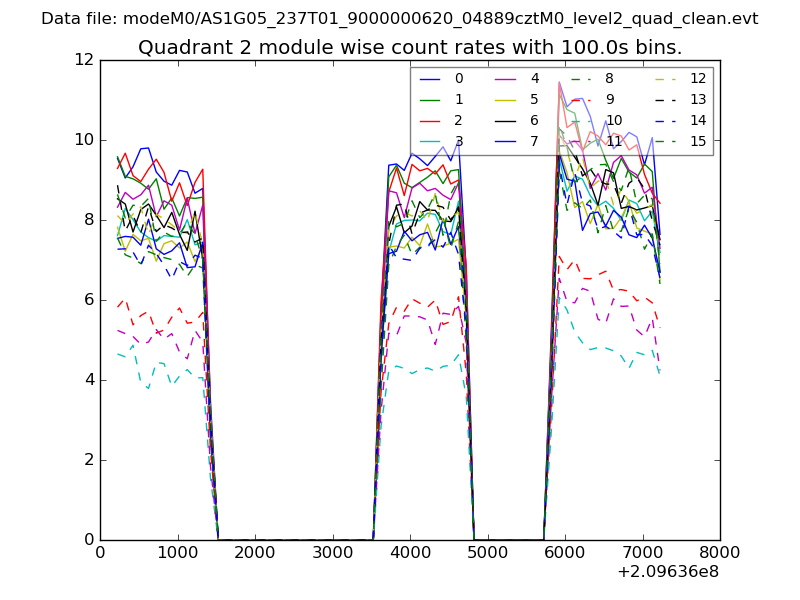
| Module-wise count rates for Quadrant B Data is divided into 100 sec bins |
 |
 |
| Module-wise count rates for Quadrant C Data is divided into 100 sec bins |
 |
 |
| Module-wise count rates for Quadrant D Data is divided into 100 sec bins |
 |
 |
| Parameter | Plot |
|---|---|
| CZT HV Monitor | 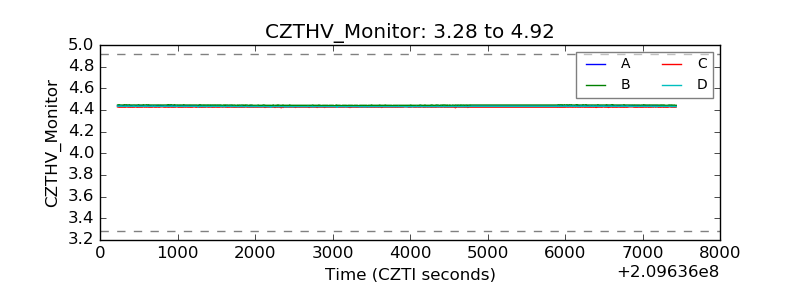 |
| D_VDD | 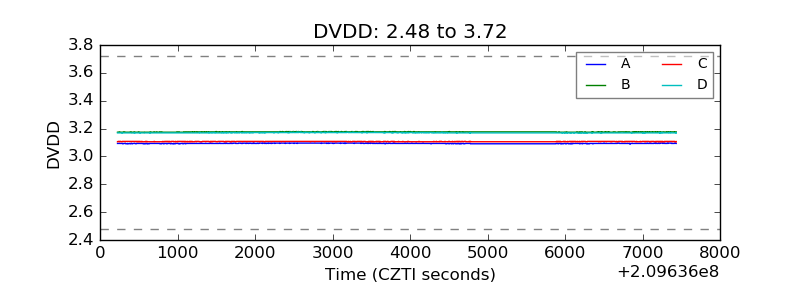 |
| Temperature 1 | 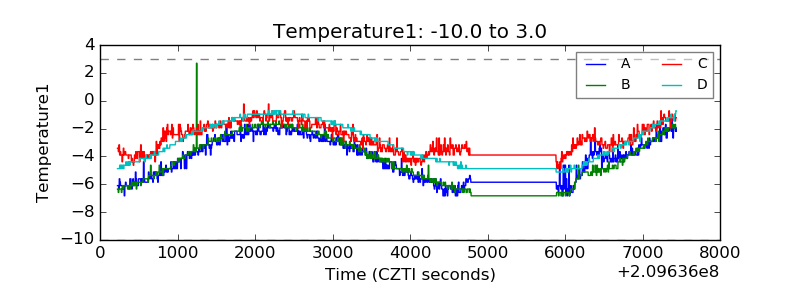 |
| Veto HV Monitor | 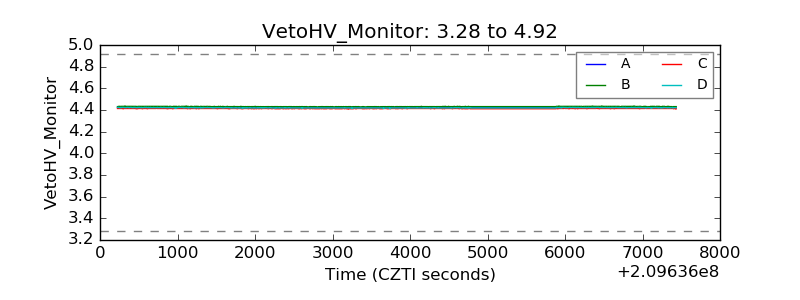 |
| Veto LLD | 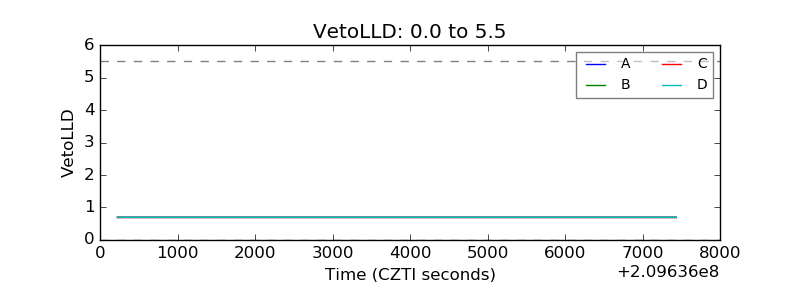 |
| Alpha Counter |  |
| _CPM_Rate | 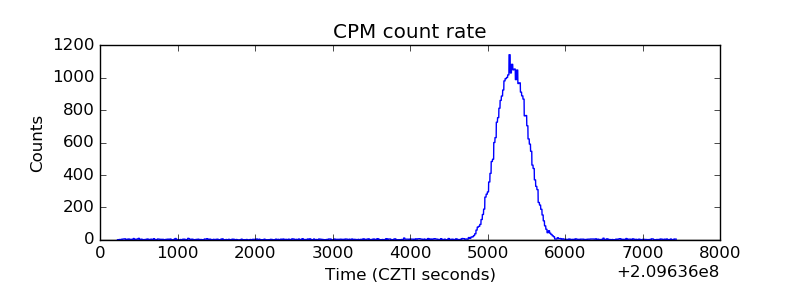 |
| CZT Counter | 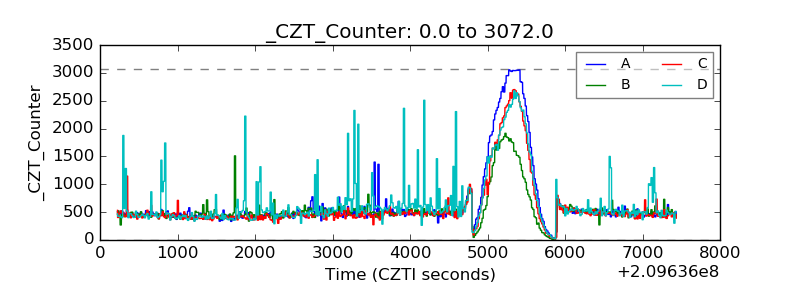 |
| +2.5 Volts monitor |  |
| +5 Volts monitor |  |
| _ROLL_ROT |  |
| _Roll_DEC | 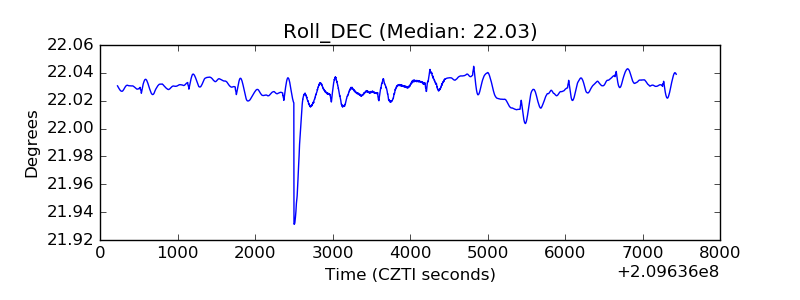 |
| _Roll_RA | 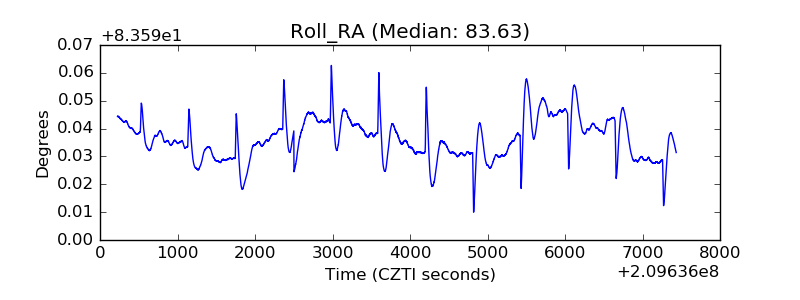 |
| Veto Counter | 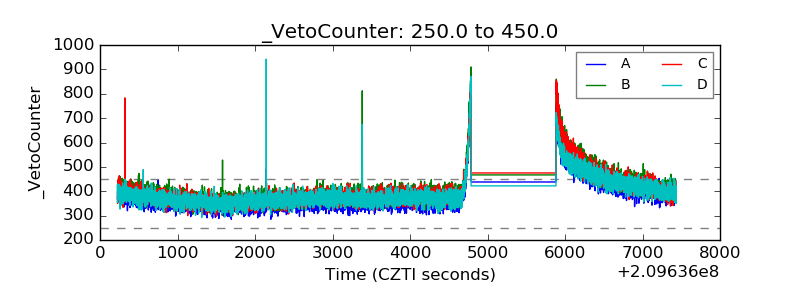 |