| Param | Original file | Final file |
|---|---|---|
| Filename | modeM0/AS1G05_237T01_9000000620_04890cztM0_level2.evt | modeM0/AS1G05_237T01_9000000620_04890cztM0_level2_quad_clean.evt |
| Size (bytes) | 378,008,640 | 63,544,320 |
| Size | 360.5 MB | 60.6 MB |
| Events in quadrant A | 2,692,708 | 394,147 |
| Events in quadrant B | 2,785,863 | 396,079 |
| Events in quadrant C | 2,489,611 | 391,744 |
| Events in quadrant D | 3,119,141 | 370,776 |
| Mode M9 | |||
|---|---|---|---|
| Quadrant | BADHDUFLAG | Total packets | Discarded packets |
| A | 0 | 12 | 0 |
| B | 0 | 12 | 0 |
| C | 0 | 12 | 0 |
| D | 0 | 12 | 0 |
| Mode SS | |||
|---|---|---|---|
| Quadrant | BADHDUFLAG | Total packets | Discarded packets |
| A | 0 | 108 | 0 |
| B | 0 | 108 | 0 |
| C | 0 | 108 | 0 |
| D | 0 | 108 | 0 |
| Mode M0 | |||
|---|---|---|---|
| Quadrant | BADHDUFLAG | Total packets | Discarded packets |
| A | 0 | 11177 | 16 |
| B | 0 | 11474 | 17 |
| C | 0 | 10835 | 11 |
| D | 0 | 12647 | 13 |
| Quadrant | Total seconds | Saturated seconds | Saturation percentage |
|---|---|---|---|
| A | 5300 | 71 | 1.339623% |
| B | 5299 | 54 | 1.019060% |
| C | 5302 | 22 | 0.414938% |
| D | 5301 | 111 | 2.093945% |
Noise dominated data is calculated using 1-second bins in cleaned event files. If a bin has >2000 counts, and if more than 50% of those come from <1% of pixels, then it is considered to be noise-dominated and hence unusable.
| Quadrant | # 1 sec bins | Bins with >0 counts | Bins with >2000 counts | High rate bins dominated by noise | Noise dominated (total time) | Noise dominated (detector-on time) | Marked lightcurve |
|---|---|---|---|---|---|---|---|
| A | 6512 | 5306 | 2 | 2 | 0.03% | 0.04% | 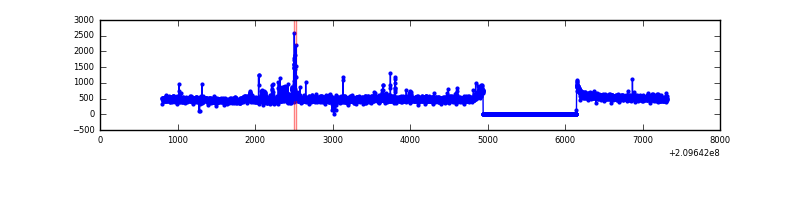 |
| B | 6512 | 5308 | 9 | 9 | 0.14% | 0.17% | 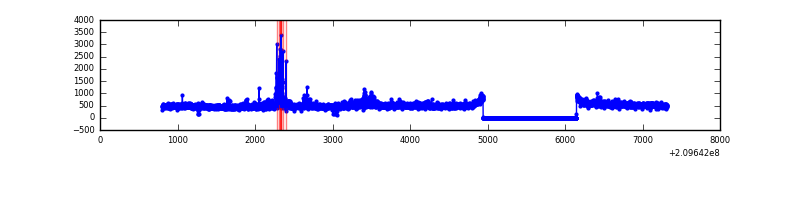 |
| C | 6512 | 5307 | 0 | 0 | 0.00% | 0.00% | 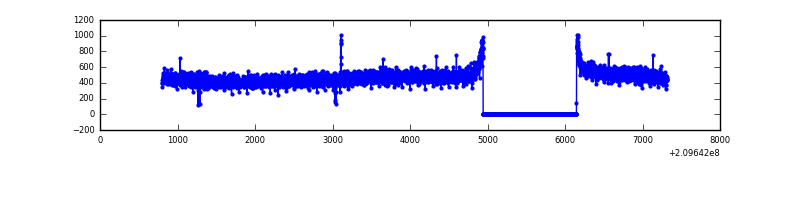 |
| D | 6512 | 5306 | 64 | 64 | 0.98% | 1.21% | 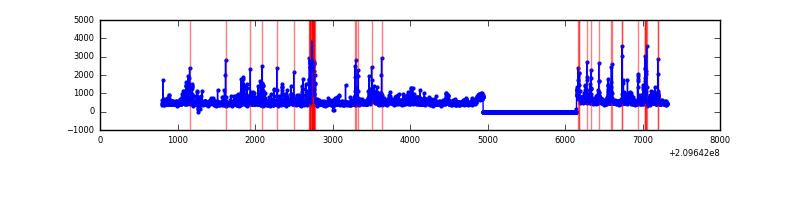 |
Top three noisy pixels from each quadrant. If the there are fewer than three noisy pixels in the level2.evt file, extra rows are filled as -1
| Pixel properties | Quadrant properties | ||||||
|---|---|---|---|---|---|---|---|
| Quadrant | DetID | PixID | Counts | Sigma | Mean | Median | Sigma |
| A | 14 | 111 | 40776 | 295.33 | 662 | 650 | 135.9 |
| A | 0 | 31 | 38159 | 276.07 | 662 | 650 | 135.9 |
| A | 8 | 15 | 38052 | 275.28 | 662 | 650 | 135.9 |
| B | 15 | 204 | 100570 | 789.12 | 663 | 651 | 126.6 |
| B | 4 | 239 | 64616 | 505.17 | 663 | 651 | 126.6 |
| B | 0 | 183 | 14864 | 112.25 | 663 | 651 | 126.6 |
| C | 14 | 67 | 9364 | 59.42 | 634 | 639 | 146.8 |
| C | 13 | 61 | 5199 | 31.06 | 634 | 639 | 146.8 |
| C | 12 | 4 | 5185 | 30.96 | 634 | 639 | 146.8 |
| D | 2 | 136 | 214230 | 1364.28 | 637 | 619 | 156.6 |
| D | 10 | 15 | 175468 | 1116.72 | 637 | 619 | 156.6 |
| D | 13 | 235 | 92132 | 584.47 | 637 | 619 | 156.6 |
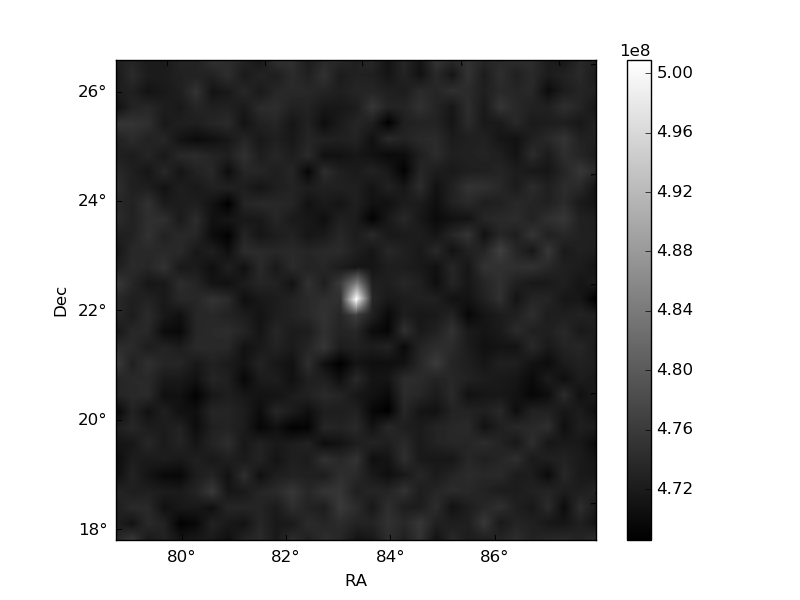
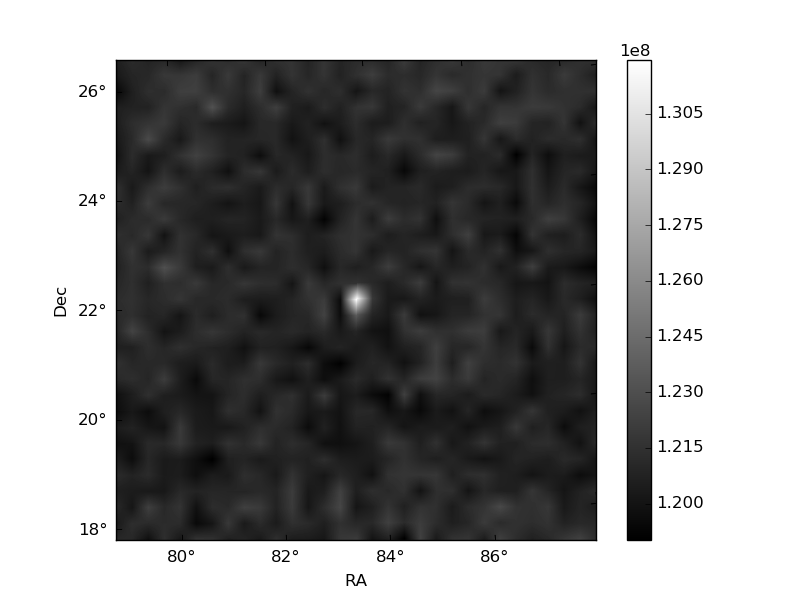
Histogram calculated using DETX and DETY for each event in the final _common_clean file
| Quadrant A | 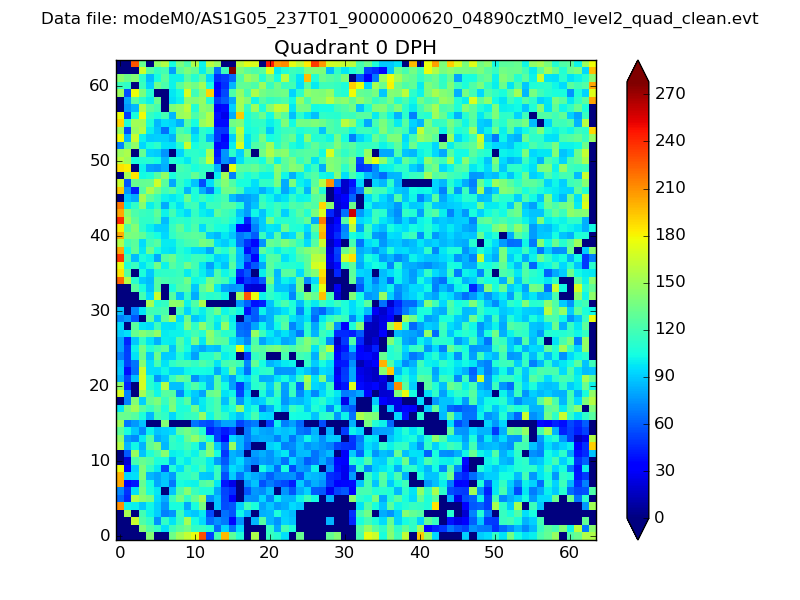 |
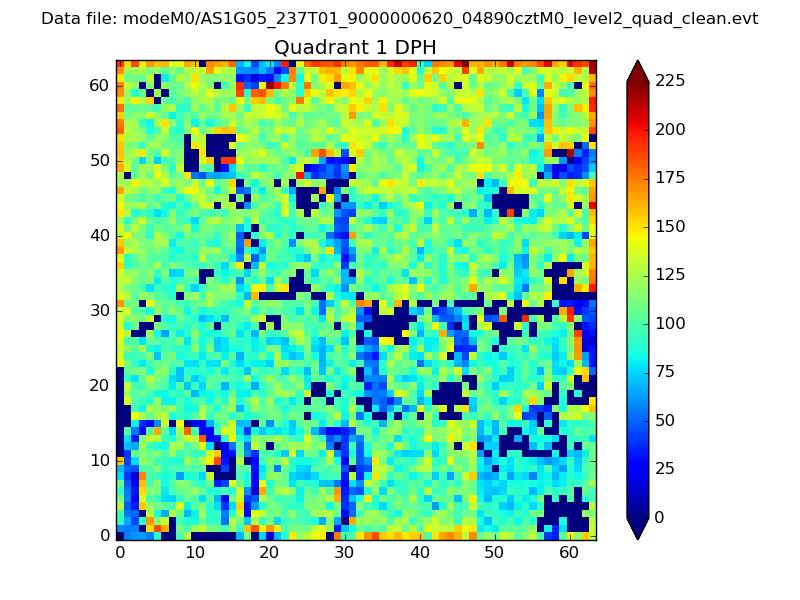 |
Quadrant B |
|---|---|---|---|
| Quadrant D | 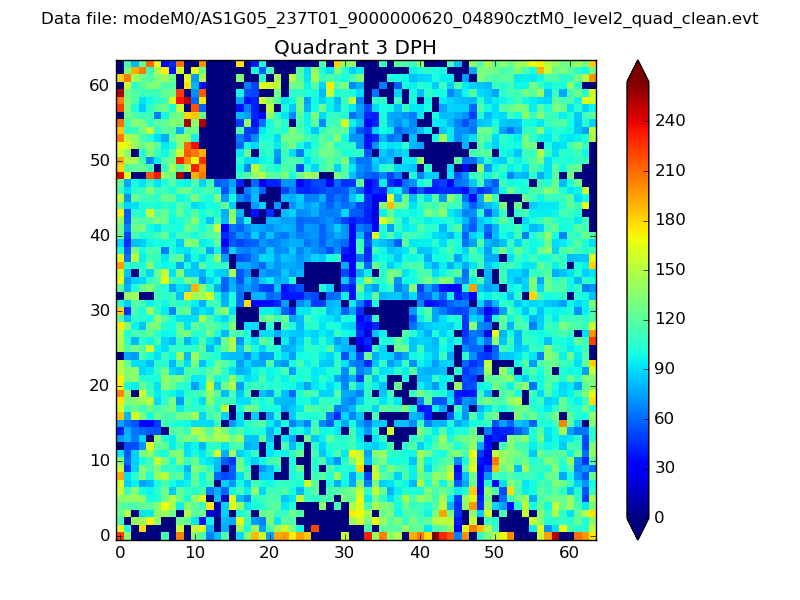 |
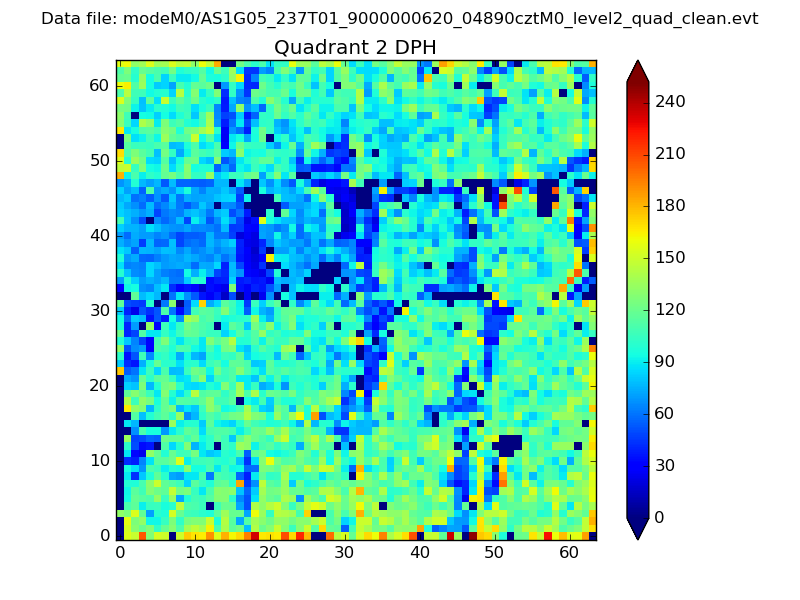 |
Quadrant C |
| Plot type | Count rate plots | Images |
|---|---|---|
| Comparison with Poisson distribution Blue bars denote a histogram of data divided into 1 sec bins. Red curve is a Poisson curve with rate = median count rate of data. |
 |
 |
| Quadrant-wise count rates Data is divided into 100 sec bins |
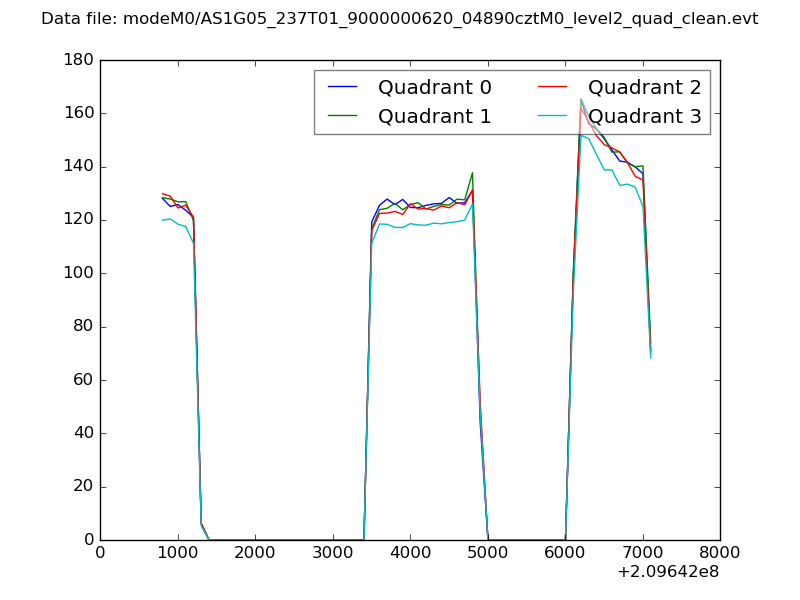 |
|
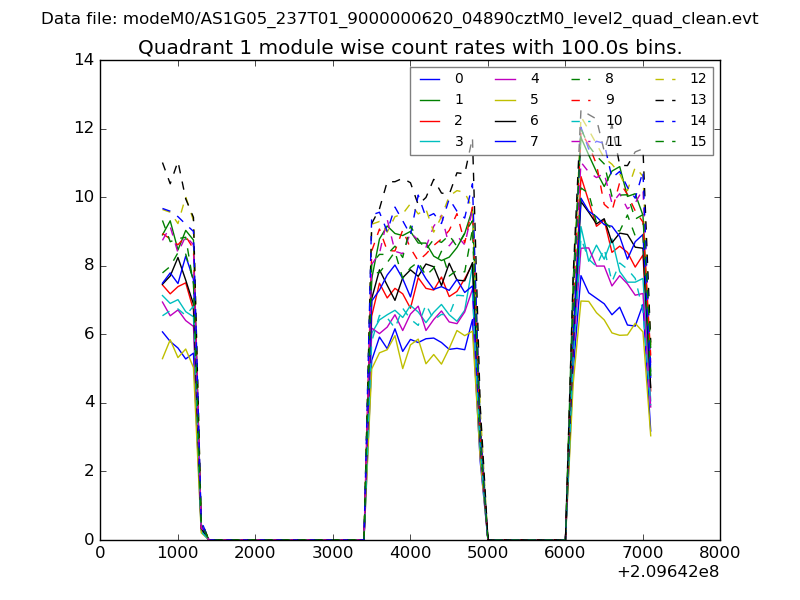
| Module-wise count rates for Quadrant A Data is divided into 100 sec bins |
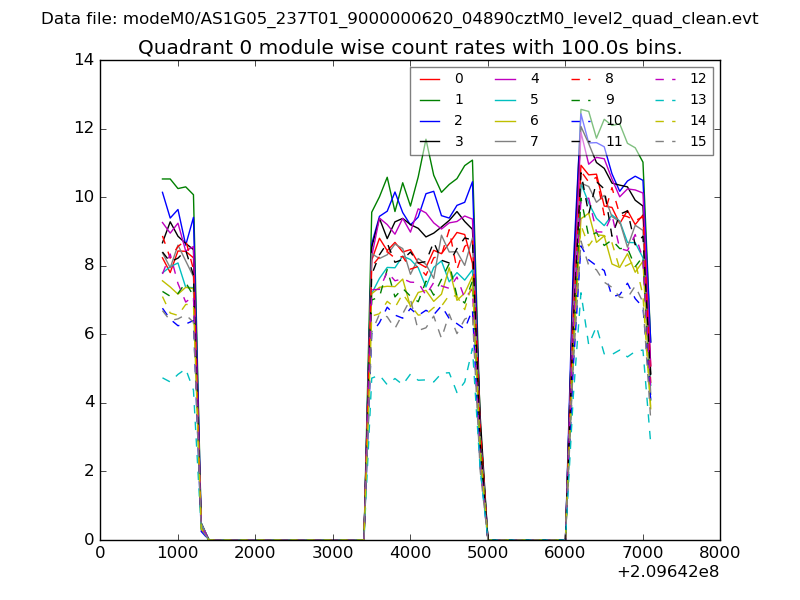 |
 |
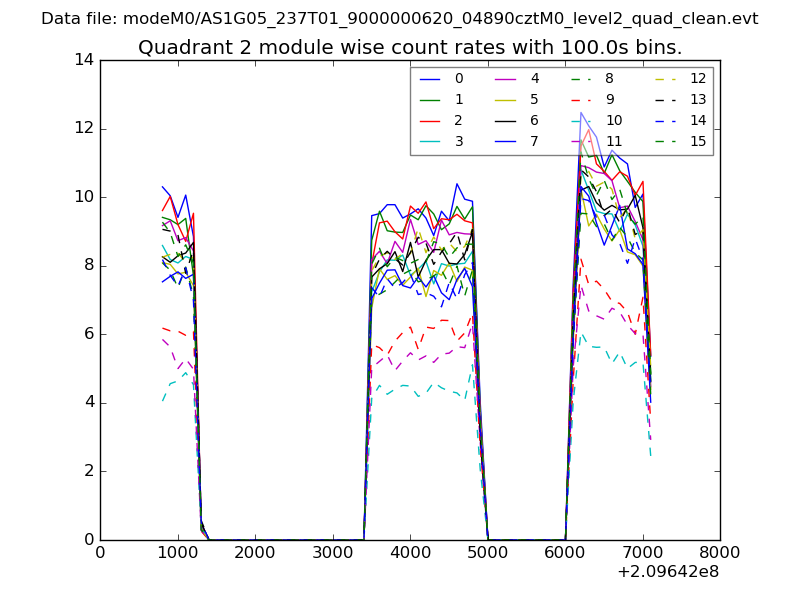
| Module-wise count rates for Quadrant B Data is divided into 100 sec bins |
 |
 |
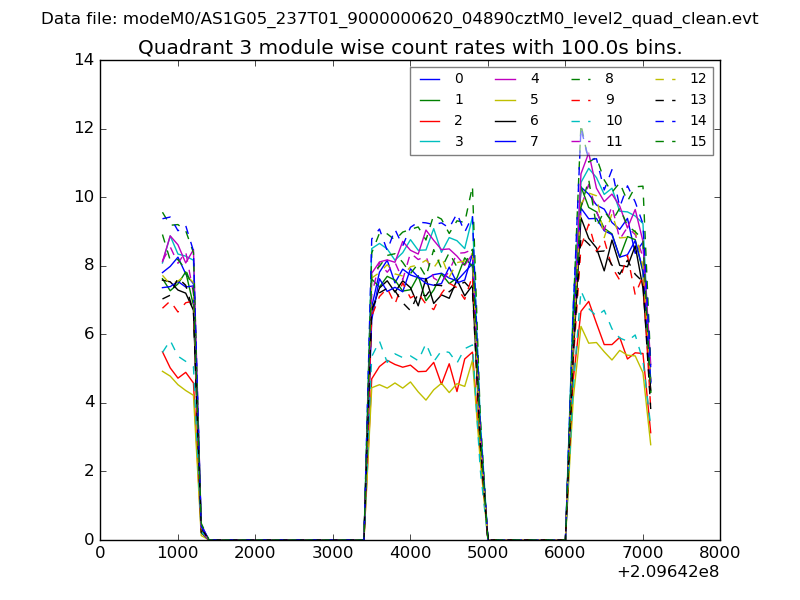
| Module-wise count rates for Quadrant C Data is divided into 100 sec bins |
 |
 |
| Module-wise count rates for Quadrant D Data is divided into 100 sec bins |
 |
 |
| Parameter | Plot |
|---|---|
| CZT HV Monitor |  |
| D_VDD | 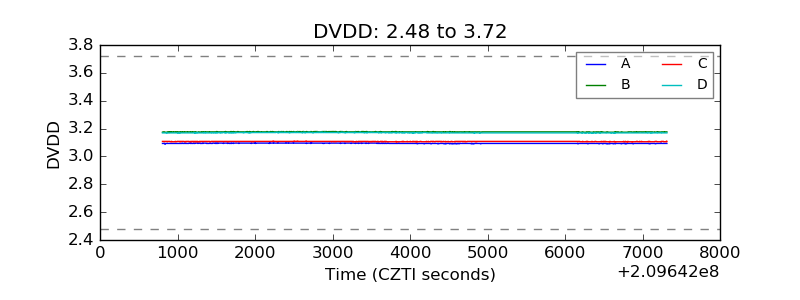 |
| Temperature 1 | 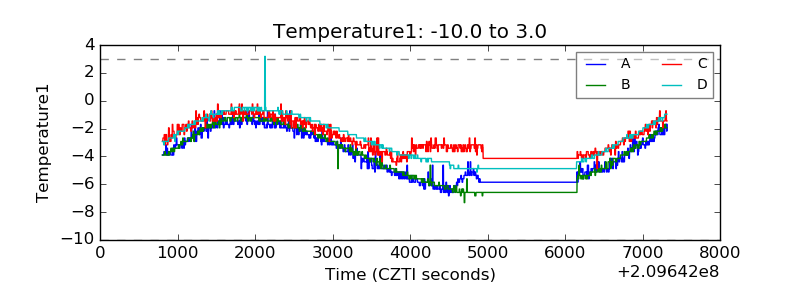 |
| Veto HV Monitor | 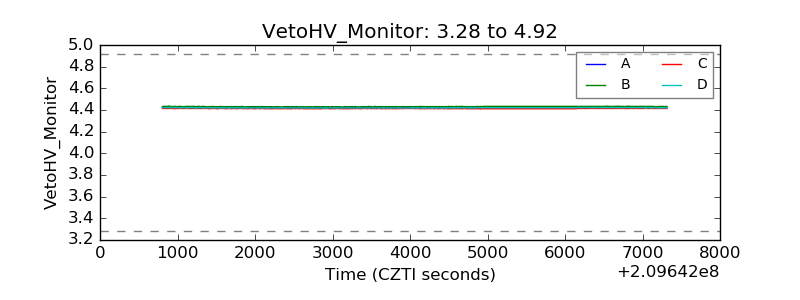 |
| Veto LLD | 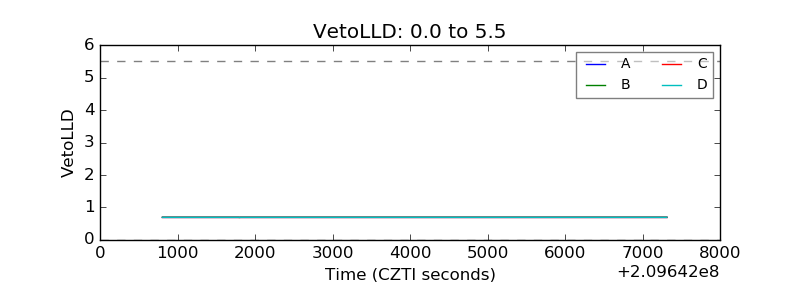 |
| Alpha Counter | 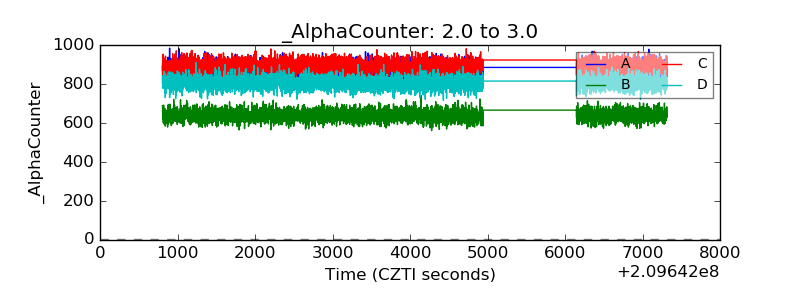 |
| _CPM_Rate | 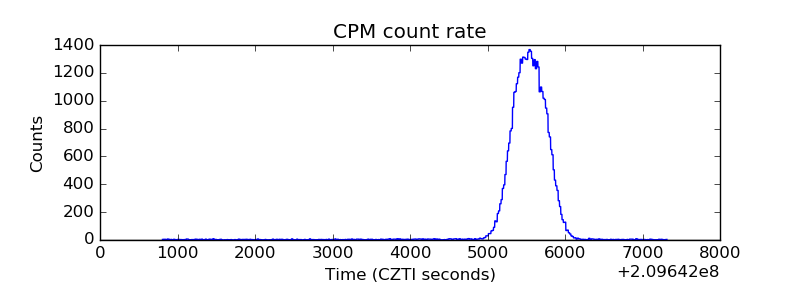 |
| CZT Counter | 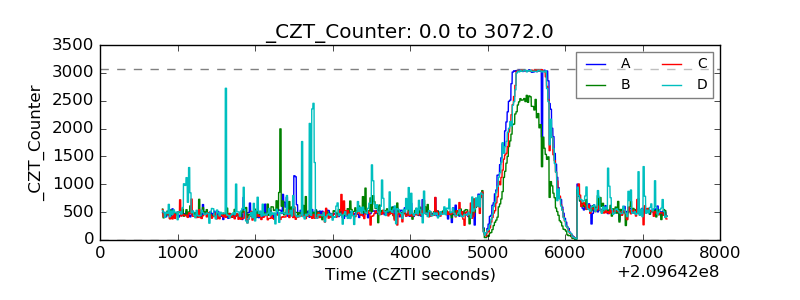 |
| +2.5 Volts monitor |  |
| +5 Volts monitor | 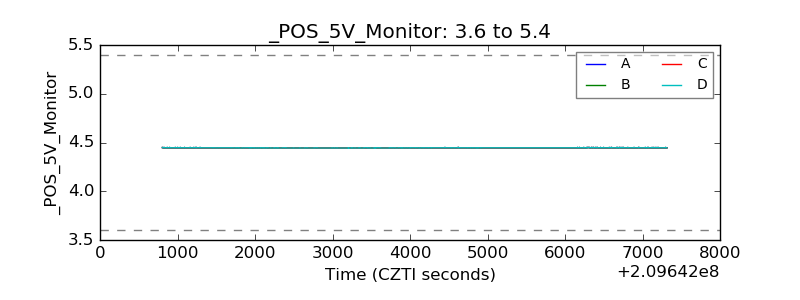 |
| _ROLL_ROT | 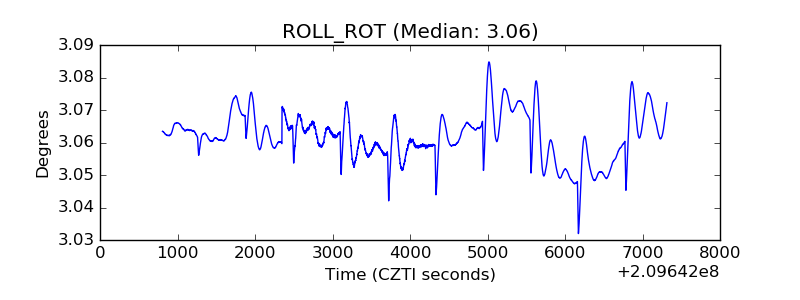 |
| _Roll_DEC | 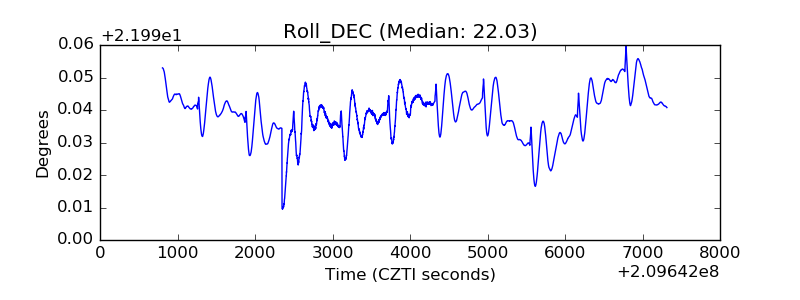 |
| _Roll_RA | 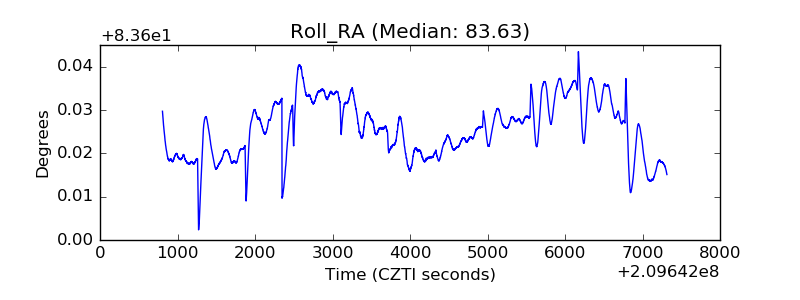 |
| Veto Counter | 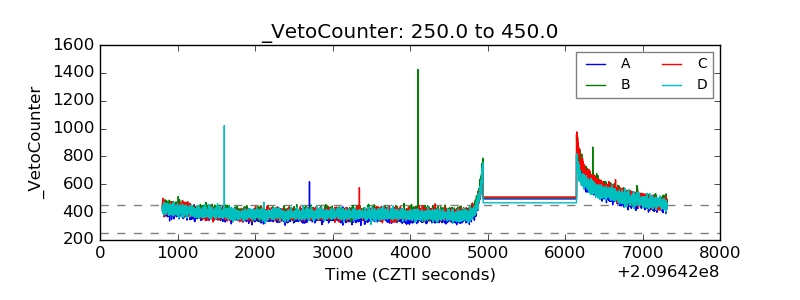 |