| Param | Original file | Final file |
|---|---|---|
| Filename | modeM0/AS1G05_237T01_9000000620_04891cztM0_level2.evt | modeM0/AS1G05_237T01_9000000620_04891cztM0_level2_quad_clean.evt |
| Size (bytes) | 446,826,240 | 71,064,000 |
| Size | 426.1 MB | 67.8 MB |
| Events in quadrant A | 3,109,466 | 437,663 |
| Events in quadrant B | 3,490,124 | 439,174 |
| Events in quadrant C | 2,970,301 | 435,442 |
| Events in quadrant D | 3,547,945 | 413,646 |
| Mode M9 | |||
|---|---|---|---|
| Quadrant | BADHDUFLAG | Total packets | Discarded packets |
| A | 0 | 12 | 0 |
| B | 0 | 12 | 0 |
| C | 0 | 12 | 0 |
| D | 0 | 12 | 0 |
| Mode SS | |||
|---|---|---|---|
| Quadrant | BADHDUFLAG | Total packets | Discarded packets |
| A | 0 | 126 | 0 |
| B | 0 | 126 | 0 |
| C | 0 | 126 | 0 |
| D | 0 | 126 | 0 |
| Mode M0 | |||
|---|---|---|---|
| Quadrant | BADHDUFLAG | Total packets | Discarded packets |
| A | 0 | 12803 | 2 |
| B | 0 | 13947 | 1 |
| C | 0 | 12585 | 1 |
| D | 0 | 14439 | 1 |
| Quadrant | Total seconds | Saturated seconds | Saturation percentage |
|---|---|---|---|
| A | 6091 | 92 | 1.510425% |
| B | 6091 | 95 | 1.559678% |
| C | 6091 | 47 | 0.771630% |
| D | 6091 | 120 | 1.970120% |
Noise dominated data is calculated using 1-second bins in cleaned event files. If a bin has >2000 counts, and if more than 50% of those come from <1% of pixels, then it is considered to be noise-dominated and hence unusable.
| Quadrant | # 1 sec bins | Bins with >0 counts | Bins with >2000 counts | High rate bins dominated by noise | Noise dominated (total time) | Noise dominated (detector-on time) | Marked lightcurve |
|---|---|---|---|---|---|---|---|
| A | 7321 | 6091 | 1 | 1 | 0.01% | 0.02% | 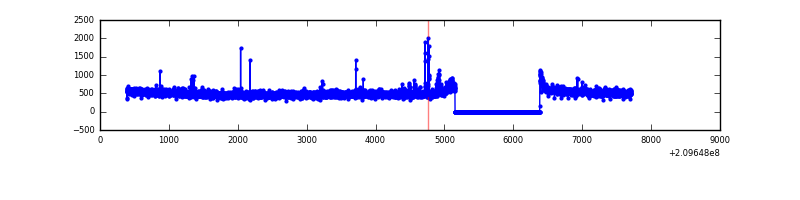 |
| B | 7321 | 6091 | 22 | 22 | 0.30% | 0.36% | 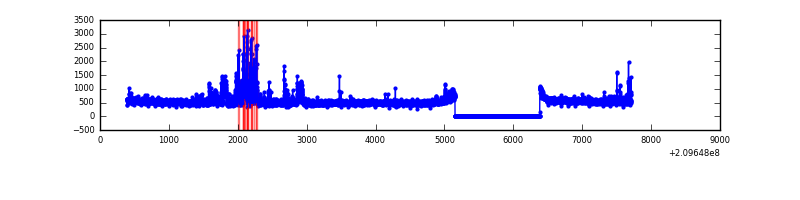 |
| C | 7321 | 6091 | 0 | 0 | 0.00% | 0.00% | 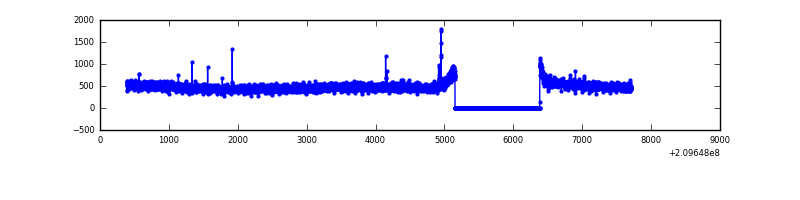 |
| D | 7321 | 6091 | 44 | 44 | 0.60% | 0.72% | 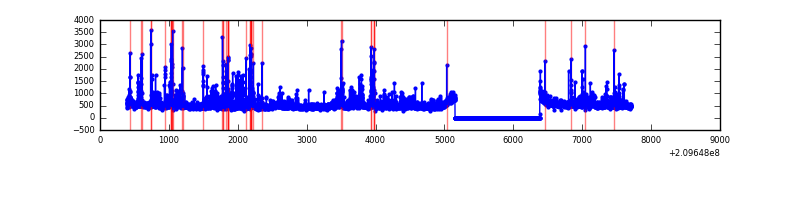 |
Top three noisy pixels from each quadrant. If the there are fewer than three noisy pixels in the level2.evt file, extra rows are filled as -1
| Pixel properties | Quadrant properties | ||||||
|---|---|---|---|---|---|---|---|
| Quadrant | DetID | PixID | Counts | Sigma | Mean | Median | Sigma |
| A | 0 | 50 | 39529 | 242.77 | 791 | 779 | 159.6 |
| A | 8 | 15 | 23192 | 140.42 | 791 | 779 | 159.6 |
| A | 12 | 194 | 7983 | 45.13 | 791 | 779 | 159.6 |
| B | 15 | 204 | 252492 | 1688.5 | 787 | 771 | 149.1 |
| B | 10 | 245 | 87620 | 582.56 | 787 | 771 | 149.1 |
| B | 15 | 54 | 44426 | 292.83 | 787 | 771 | 149.1 |
| C | 12 | 4 | 15438 | 83.94 | 756 | 762 | 174.8 |
| C | 13 | 61 | 6212 | 31.17 | 756 | 762 | 174.8 |
| C | 8 | 222 | 2695 | 11.06 | 756 | 762 | 174.8 |
| D | 2 | 136 | 268829 | 1429.13 | 762 | 738 | 187.6 |
| D | 10 | 15 | 148564 | 788.03 | 762 | 738 | 187.6 |
| D | 13 | 235 | 85913 | 454.05 | 762 | 738 | 187.6 |
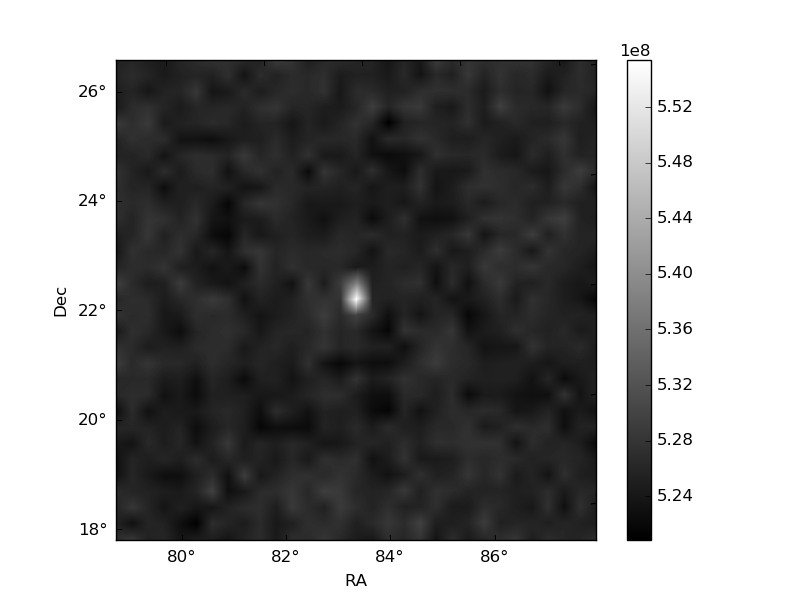
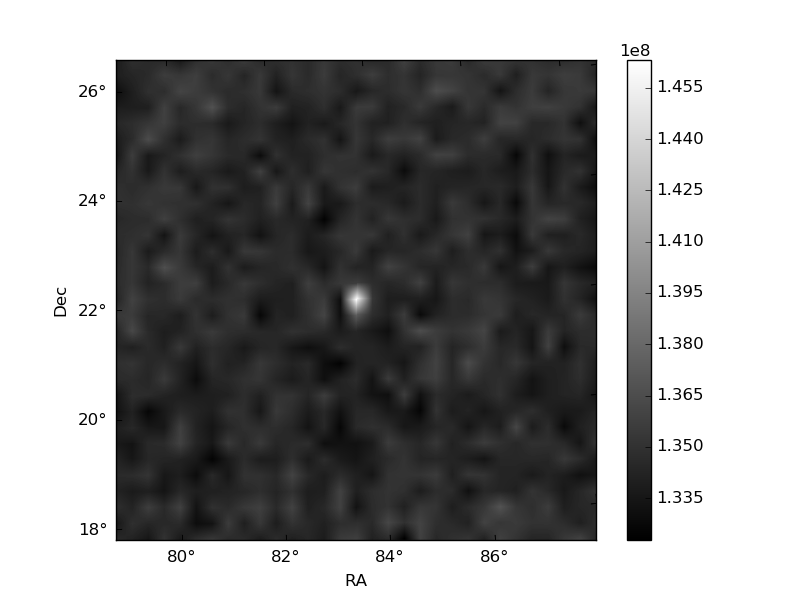
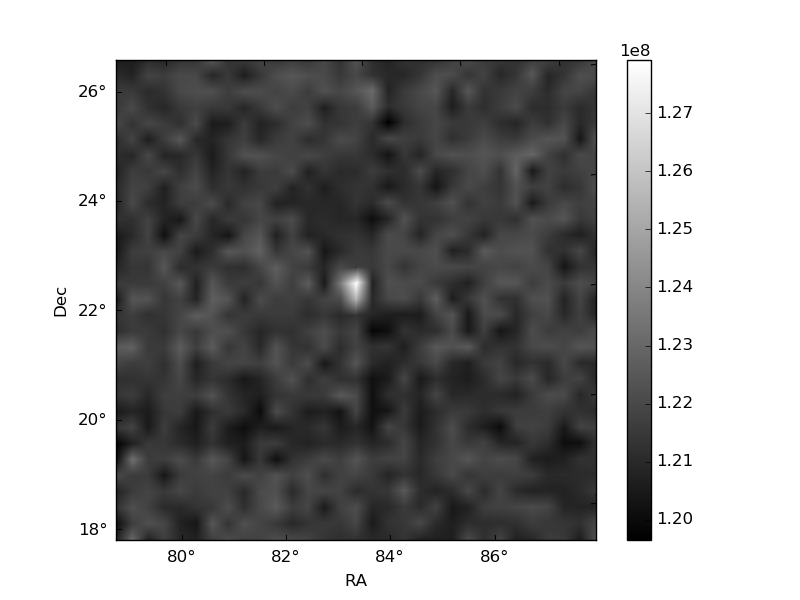
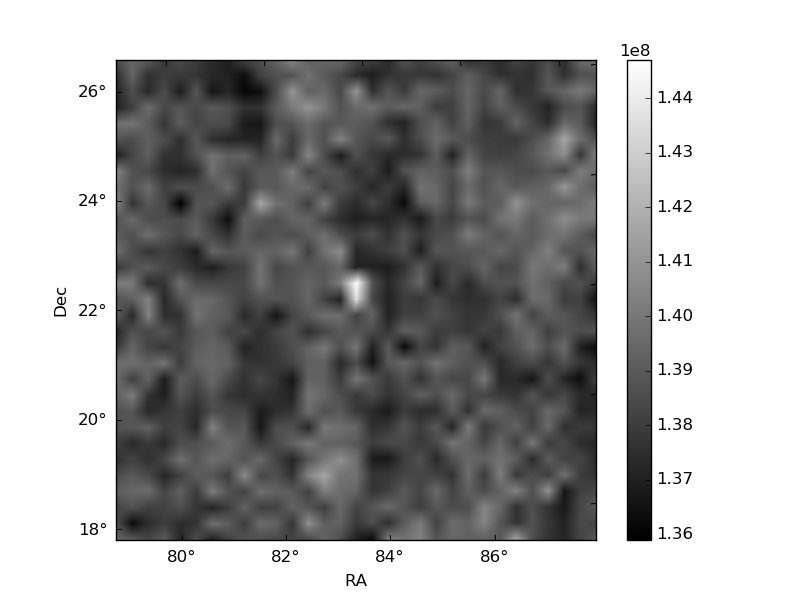
Histogram calculated using DETX and DETY for each event in the final _common_clean file
| Quadrant A | 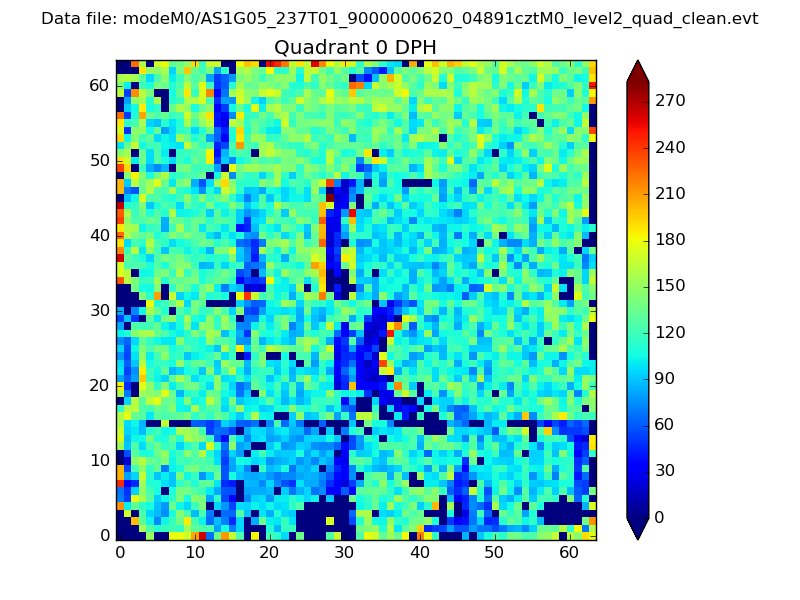 |
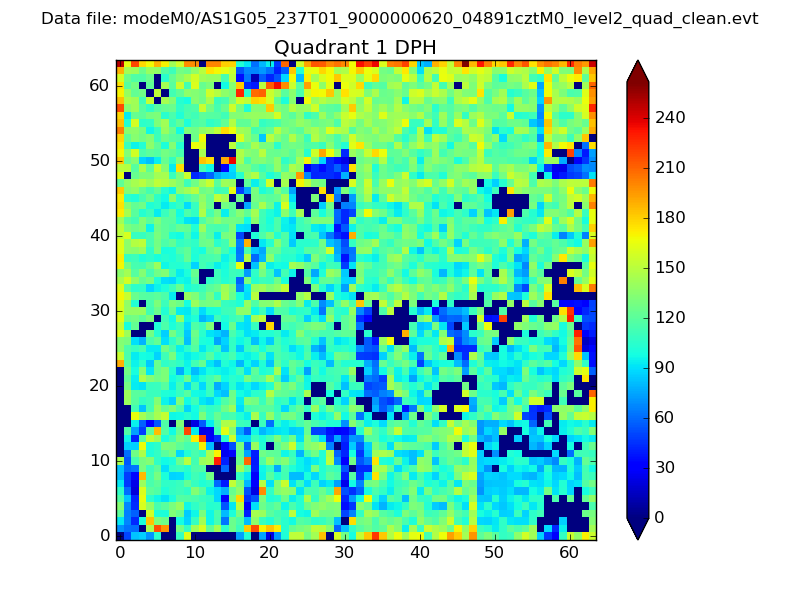 |
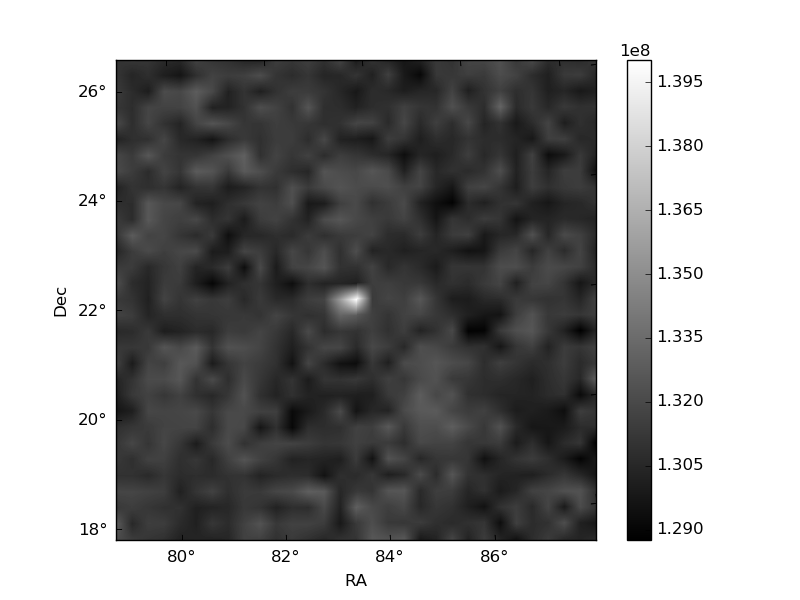
Quadrant B |
|---|---|---|---|
| Quadrant D | 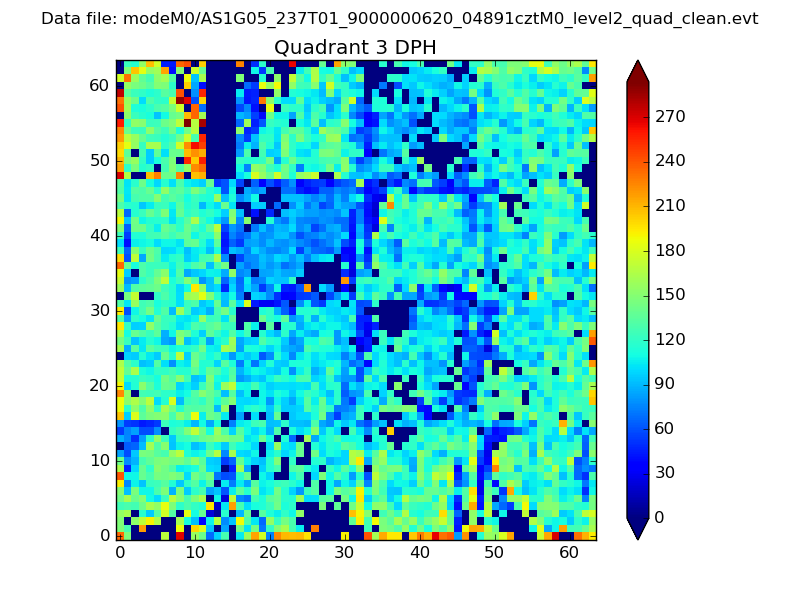 |
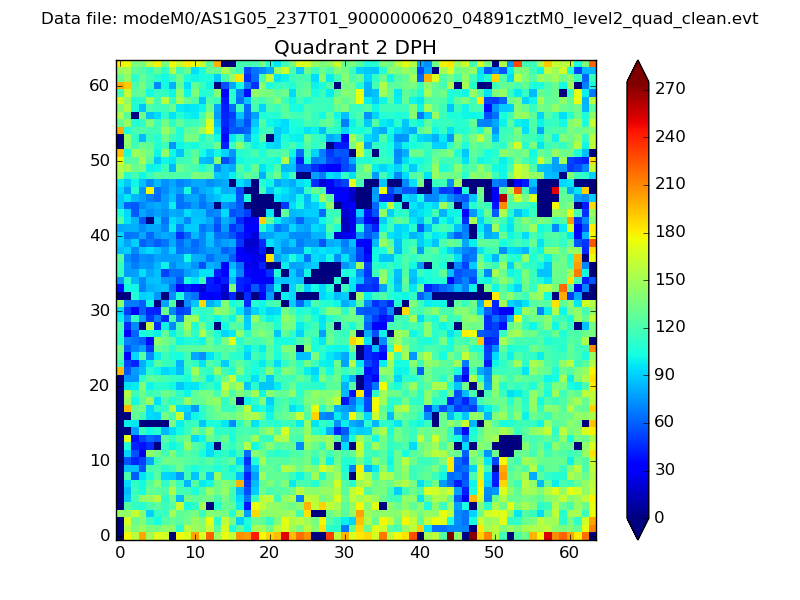 |
Quadrant C |
| Plot type | Count rate plots | Images |
|---|---|---|
| Comparison with Poisson distribution Blue bars denote a histogram of data divided into 1 sec bins. Red curve is a Poisson curve with rate = median count rate of data. |
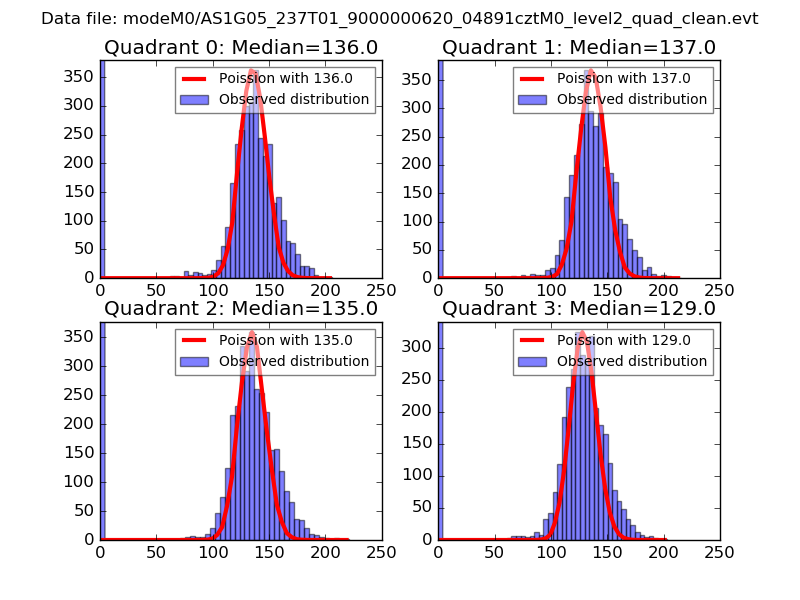 |
 |
| Quadrant-wise count rates Data is divided into 100 sec bins |
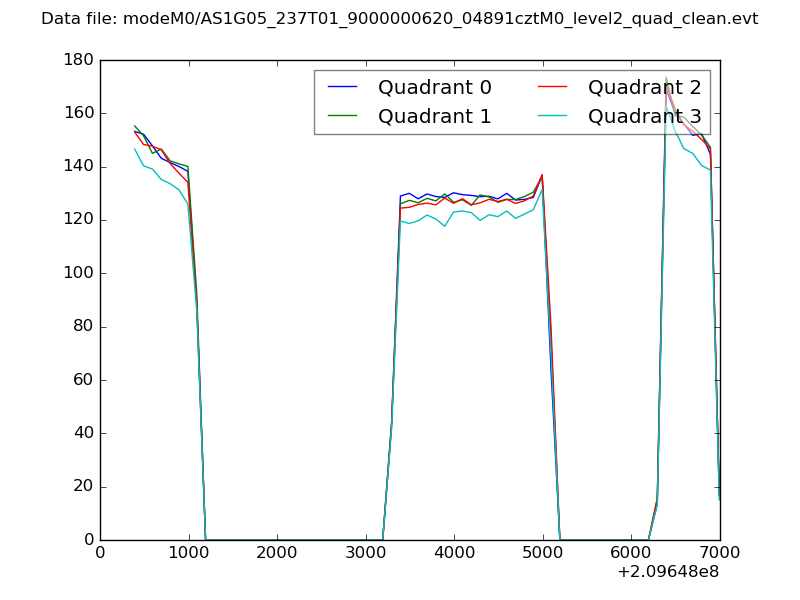 |
|
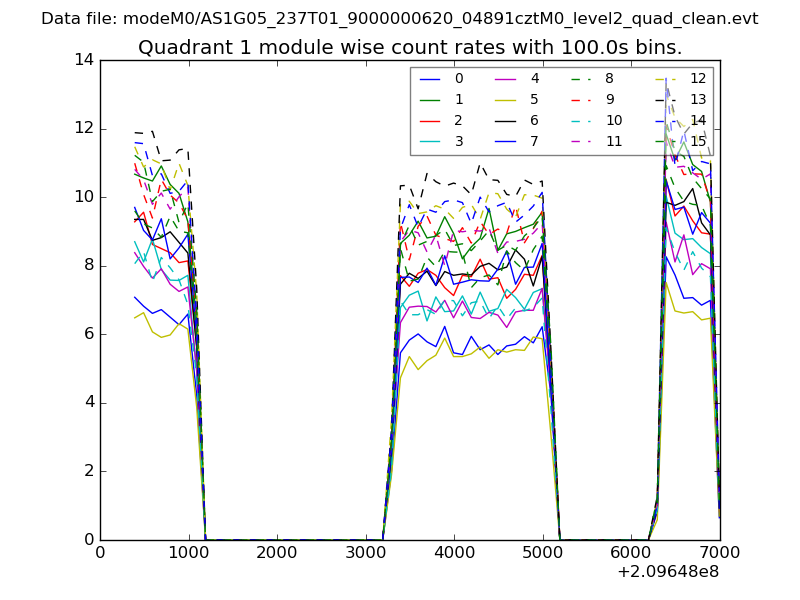
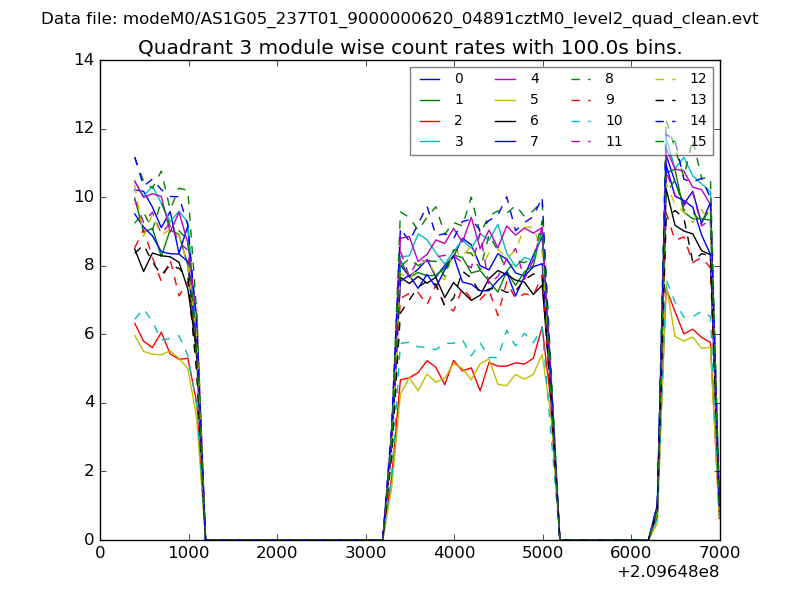
| Module-wise count rates for Quadrant A Data is divided into 100 sec bins |
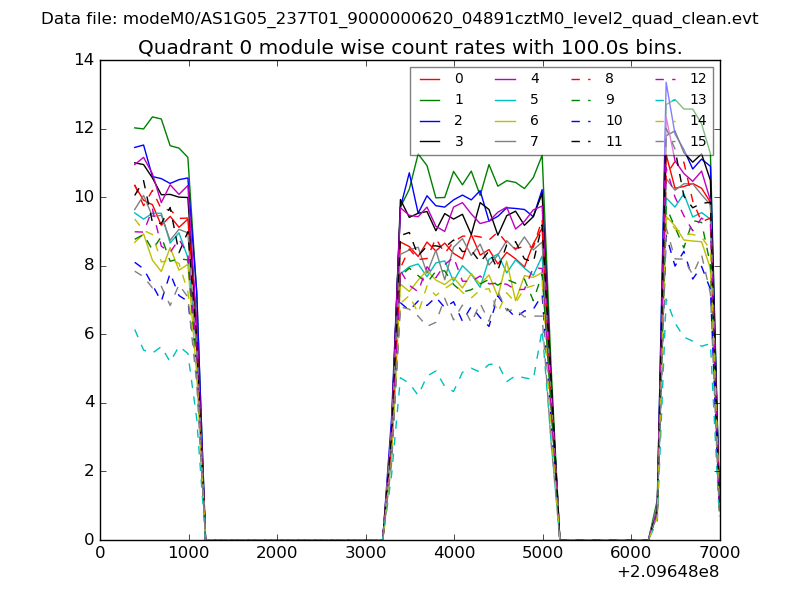 |
 |
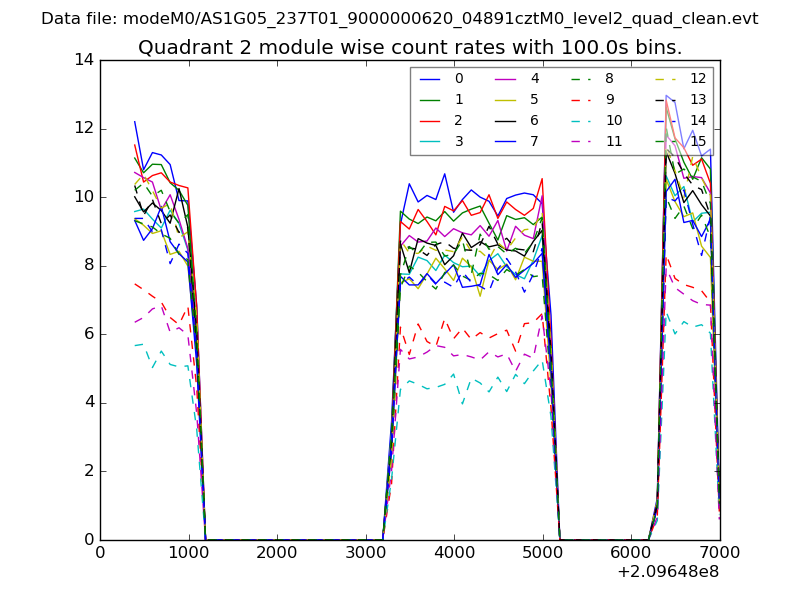
| Module-wise count rates for Quadrant B Data is divided into 100 sec bins |
 |
 |
| Module-wise count rates for Quadrant C Data is divided into 100 sec bins |
 |
 |
| Module-wise count rates for Quadrant D Data is divided into 100 sec bins |
 |
 |
| Parameter | Plot |
|---|---|
| CZT HV Monitor | 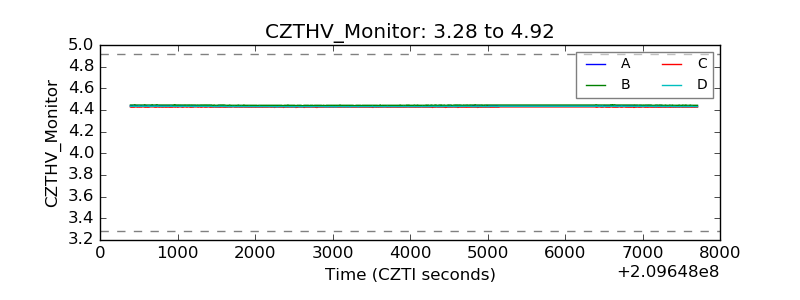 |
| D_VDD | 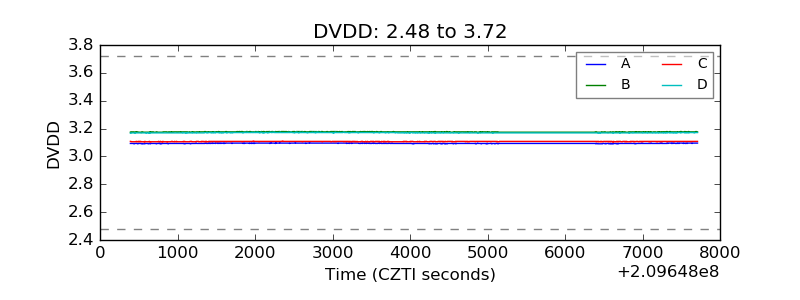 |
| Temperature 1 | 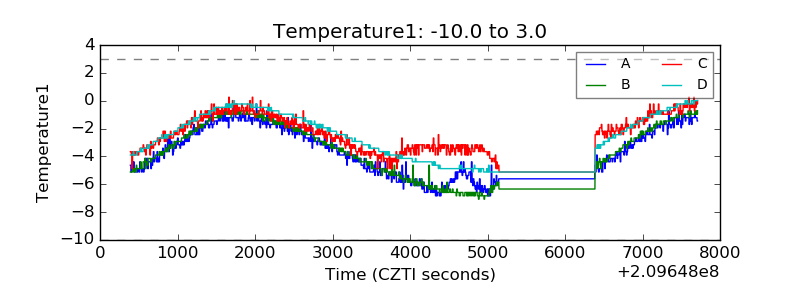 |
| Veto HV Monitor | 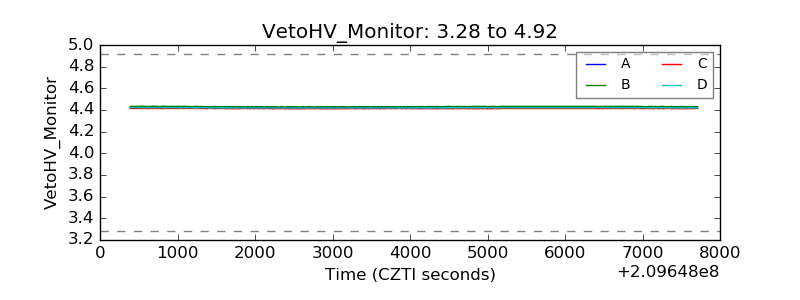 |
| Veto LLD | 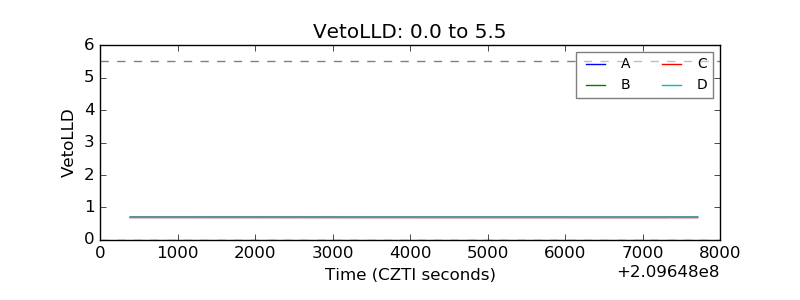 |
| Alpha Counter | 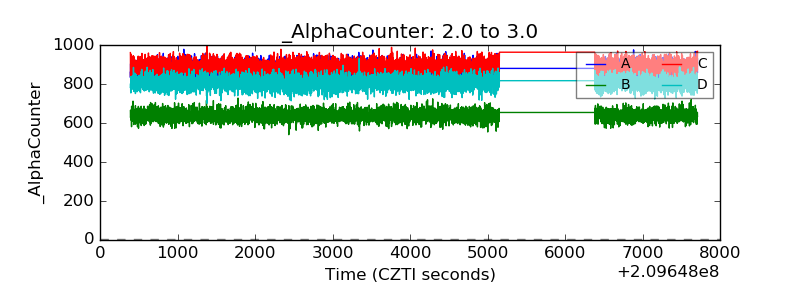 |
| _CPM_Rate | 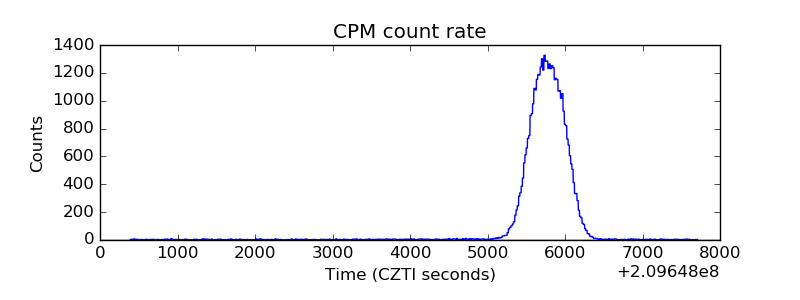 |
| CZT Counter | 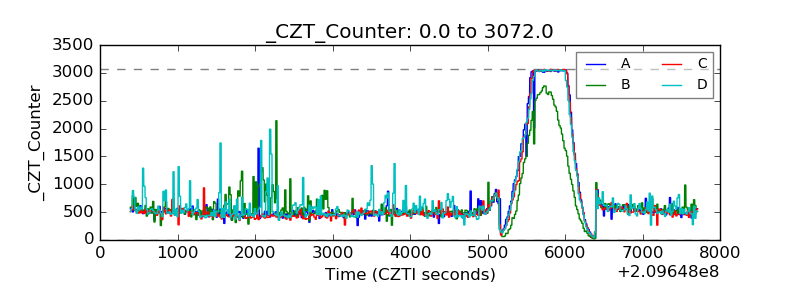 |
| +2.5 Volts monitor | 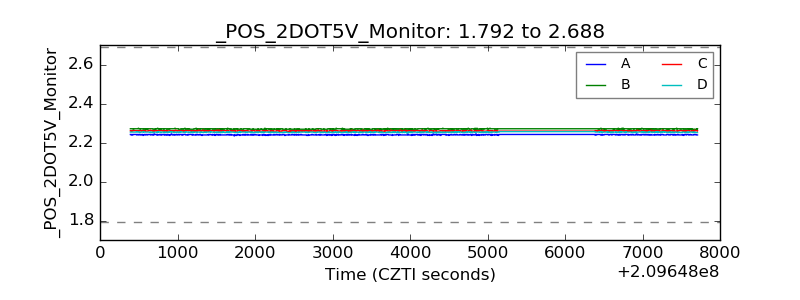 |
| +5 Volts monitor |  |
| _ROLL_ROT | 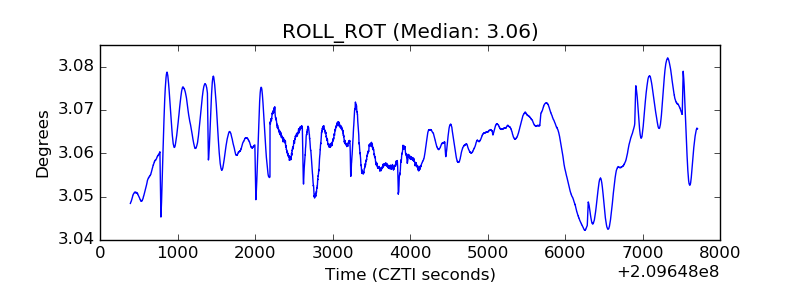 |
| _Roll_DEC | 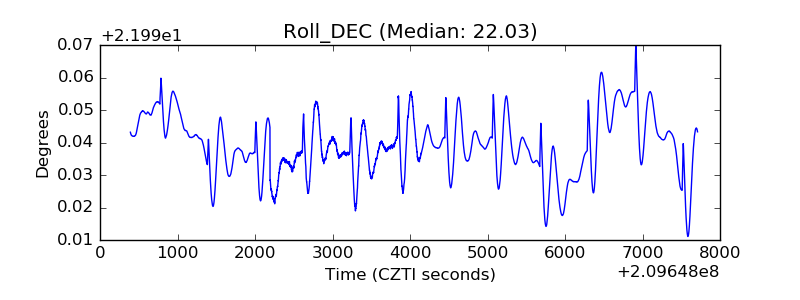 |
| _Roll_RA | 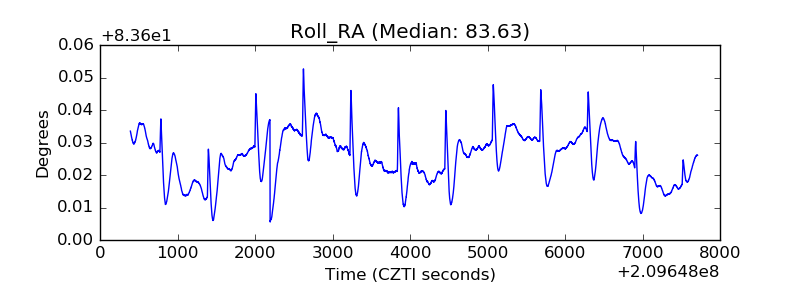 |
| Veto Counter | 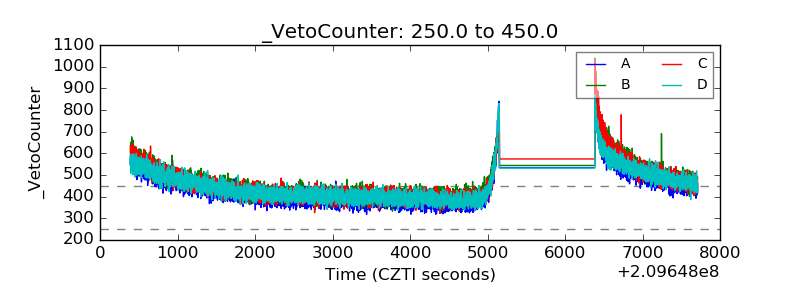 |