| Param | Original file | Final file |
|---|---|---|
| Filename | modeM0/AS1G05_237T01_9000000620_04892cztM0_level2.evt | modeM0/AS1G05_237T01_9000000620_04892cztM0_level2_quad_clean.evt |
| Size (bytes) | 485,959,680 | 67,282,560 |
| Size | 463.4 MB | 64.2 MB |
| Events in quadrant A | 3,458,009 | 400,520 |
| Events in quadrant B | 3,649,270 | 402,432 |
| Events in quadrant C | 3,230,379 | 399,173 |
| Events in quadrant D | 3,935,354 | 378,515 |
| Mode M9 | |||
|---|---|---|---|
| Quadrant | BADHDUFLAG | Total packets | Discarded packets |
| A | 0 | 13 | 0 |
| B | 0 | 13 | 0 |
| C | 0 | 13 | 0 |
| D | 0 | 13 | 0 |
| Mode SS | |||
|---|---|---|---|
| Quadrant | BADHDUFLAG | Total packets | Discarded packets |
| A | 0 | 132 | 0 |
| B | 0 | 132 | 0 |
| C | 0 | 132 | 0 |
| D | 0 | 132 | 0 |
| Mode M0 | |||
|---|---|---|---|
| Quadrant | BADHDUFLAG | Total packets | Discarded packets |
| A | 0 | 14101 | 2 |
| B | 0 | 14781 | 1 |
| C | 0 | 13583 | 1 |
| D | 0 | 15857 | 1 |
| Quadrant | Total seconds | Saturated seconds | Saturation percentage |
|---|---|---|---|
| A | 6548 | 139 | 2.122786% |
| B | 6548 | 111 | 1.695174% |
| C | 6548 | 86 | 1.313378% |
| D | 6548 | 152 | 2.321319% |
Noise dominated data is calculated using 1-second bins in cleaned event files. If a bin has >2000 counts, and if more than 50% of those come from <1% of pixels, then it is considered to be noise-dominated and hence unusable.
| Quadrant | # 1 sec bins | Bins with >0 counts | Bins with >2000 counts | High rate bins dominated by noise | Noise dominated (total time) | Noise dominated (detector-on time) | Marked lightcurve |
|---|---|---|---|---|---|---|---|
| A | 7778 | 6548 | 19 | 19 | 0.24% | 0.29% | 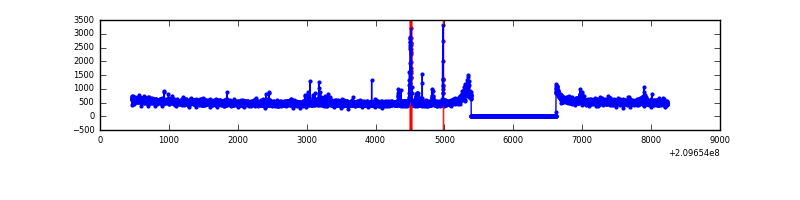 |
| B | 7778 | 6548 | 4 | 4 | 0.05% | 0.06% | 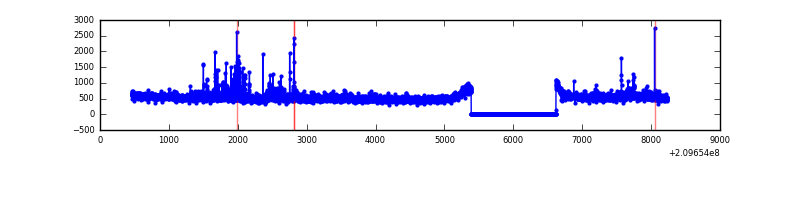 |
| C | 7778 | 6548 | 0 | 0 | 0.00% | 0.00% | 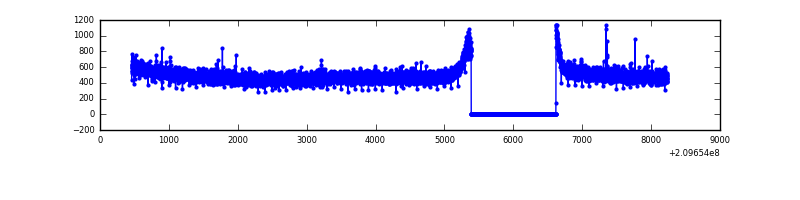 |
| D | 7778 | 6548 | 44 | 44 | 0.57% | 0.67% | 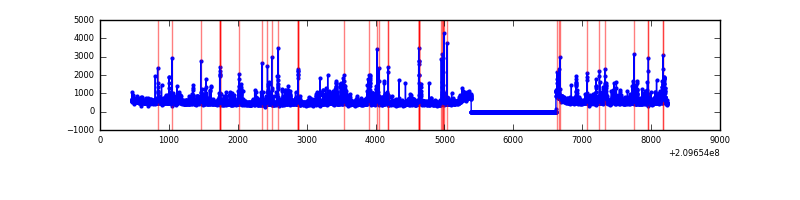 |
Top three noisy pixels from each quadrant. If the there are fewer than three noisy pixels in the level2.evt file, extra rows are filled as -1
| Pixel properties | Quadrant properties | ||||||
|---|---|---|---|---|---|---|---|
| Quadrant | DetID | PixID | Counts | Sigma | Mean | Median | Sigma |
| A | 0 | 50 | 113655 | 650.87 | 855 | 839 | 173.3 |
| A | 8 | 15 | 45756 | 259.14 | 855 | 839 | 173.3 |
| A | 12 | 194 | 8584 | 44.68 | 855 | 839 | 173.3 |
| B | 15 | 54 | 80081 | 492.06 | 855 | 839 | 161.0 |
| B | 15 | 204 | 75127 | 461.3 | 855 | 839 | 161.0 |
| B | 5 | 6 | 60221 | 368.74 | 855 | 839 | 161.0 |
| C | 12 | 4 | 9976 | 48.38 | 824 | 832 | 189.0 |
| C | 13 | 61 | 6820 | 31.68 | 824 | 832 | 189.0 |
| C | 8 | 222 | 3236 | 12.72 | 824 | 832 | 189.0 |
| D | 2 | 136 | 288628 | 1418.55 | 827 | 804 | 202.9 |
| D | 13 | 235 | 160887 | 788.97 | 827 | 804 | 202.9 |
| D | 1 | 31 | 138989 | 681.05 | 827 | 804 | 202.9 |
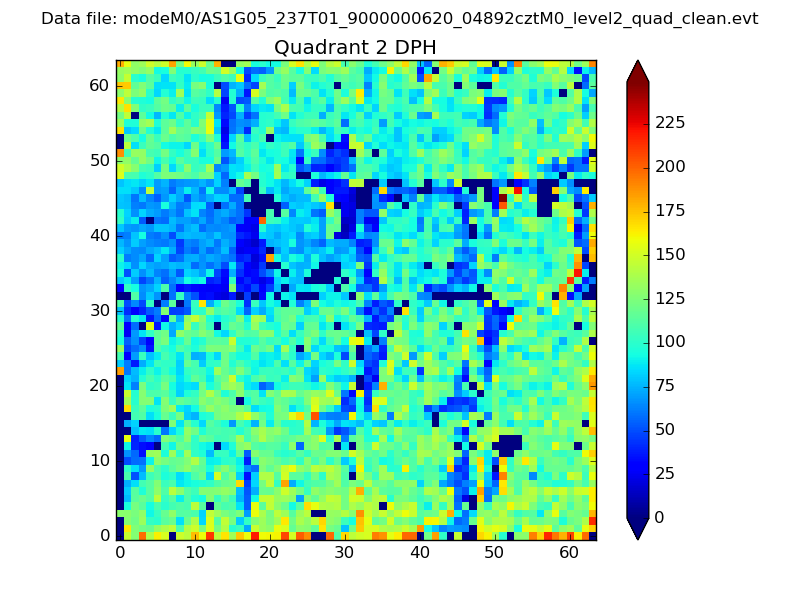
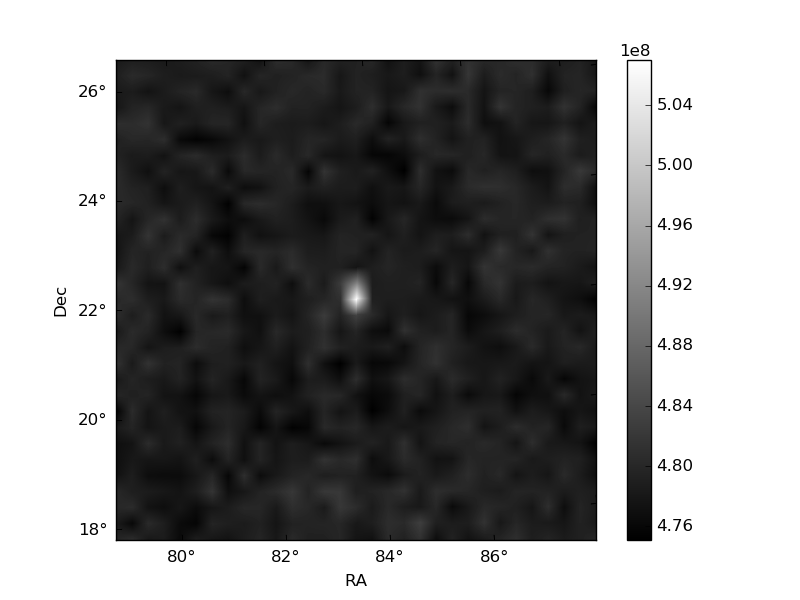
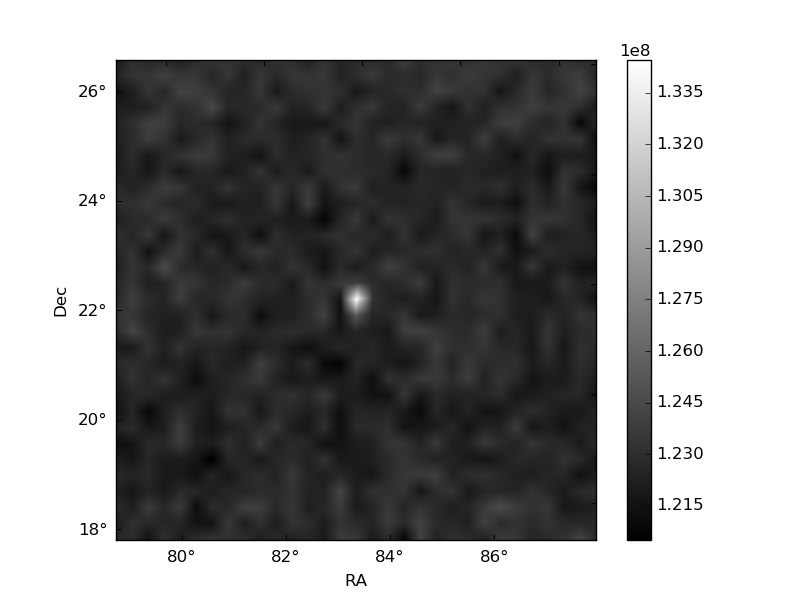
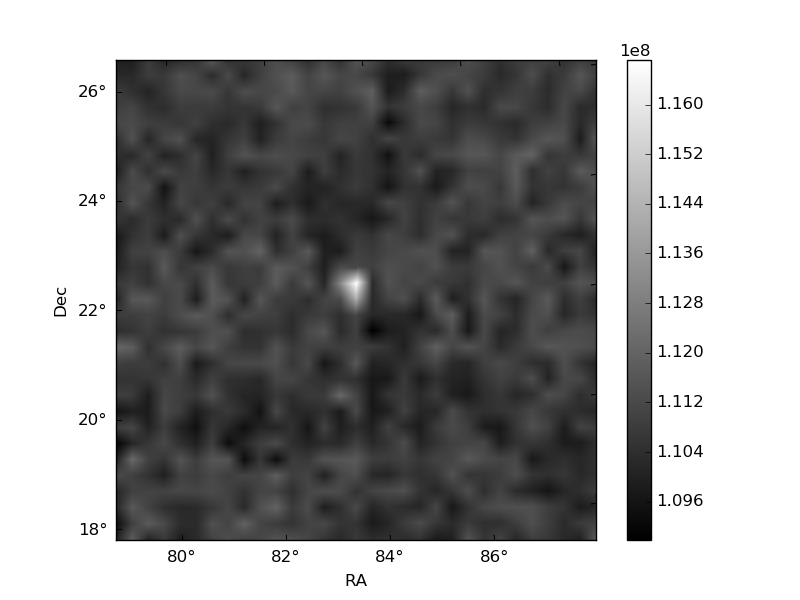
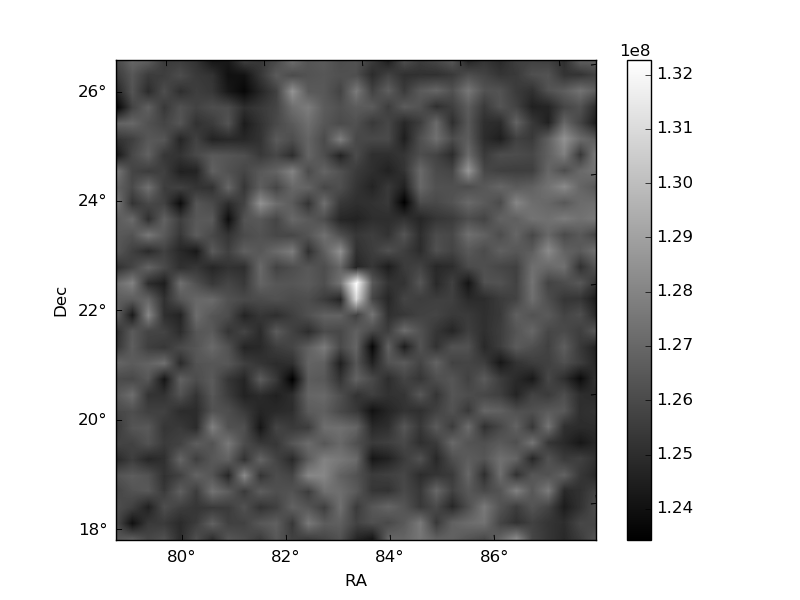
Histogram calculated using DETX and DETY for each event in the final _common_clean file
| Quadrant A | 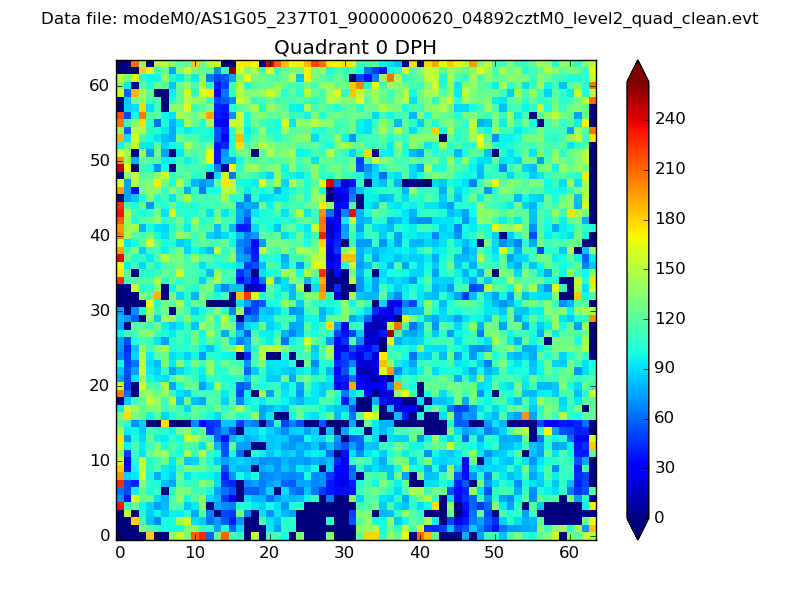 |
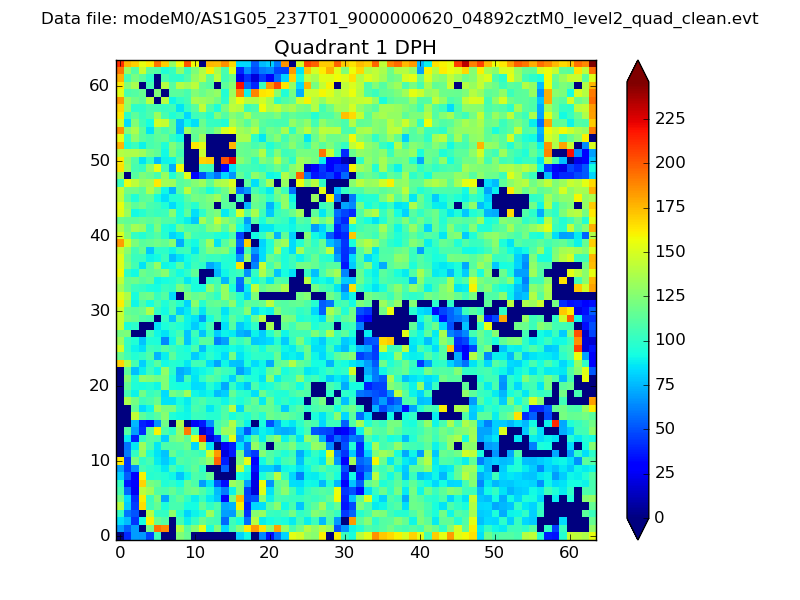 |
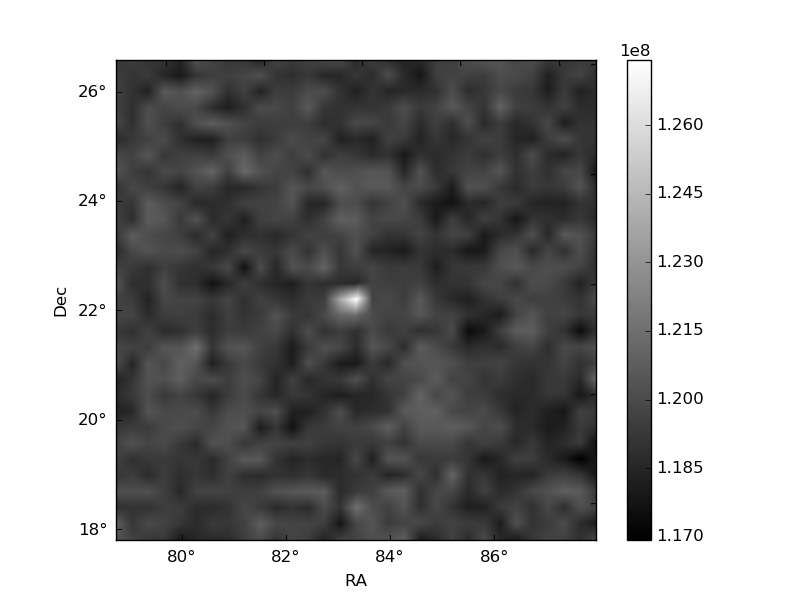
Quadrant B |
|---|---|---|---|
| Quadrant D | 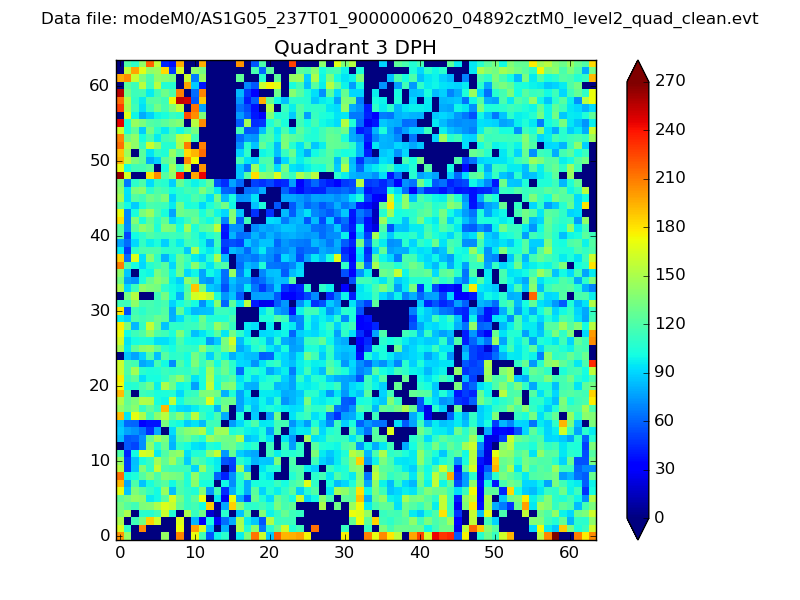 |
 |
Quadrant C |
| Plot type | Count rate plots | Images |
|---|---|---|
| Comparison with Poisson distribution Blue bars denote a histogram of data divided into 1 sec bins. Red curve is a Poisson curve with rate = median count rate of data. |
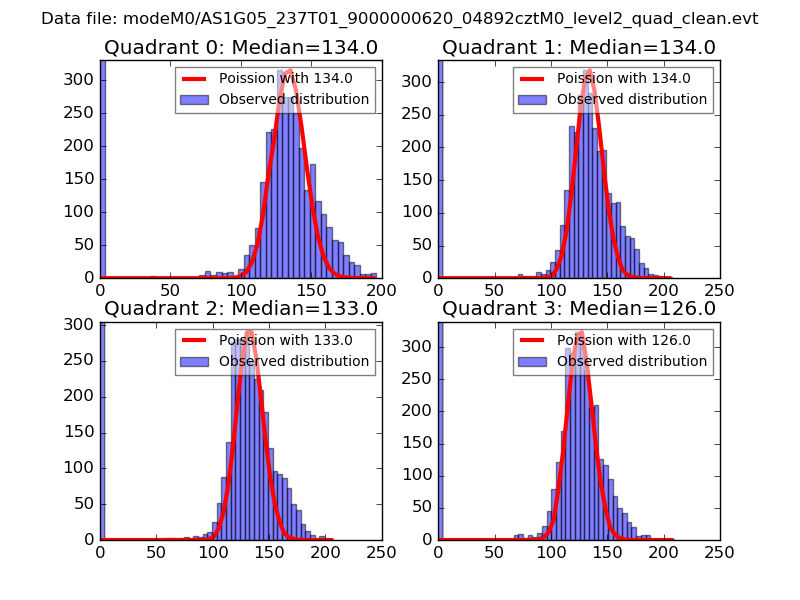 |
 |
| Quadrant-wise count rates Data is divided into 100 sec bins |
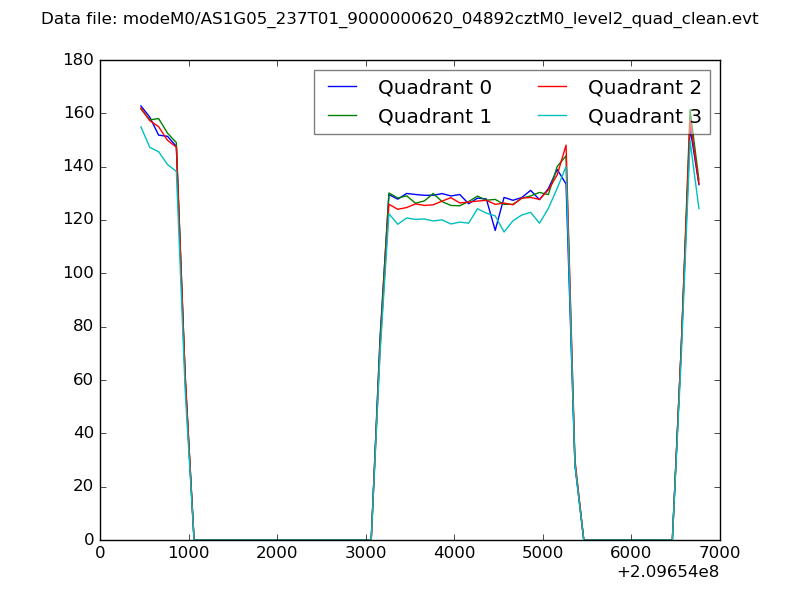 |
|
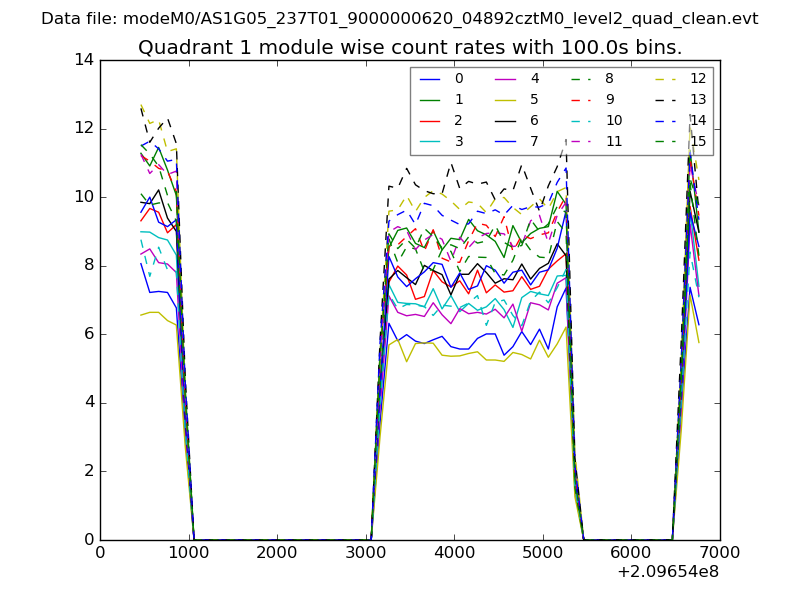
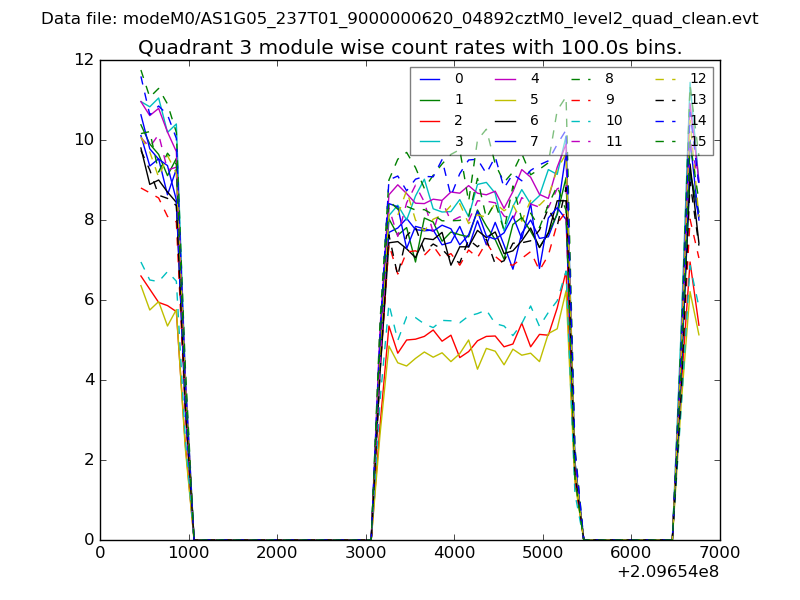
| Module-wise count rates for Quadrant A Data is divided into 100 sec bins |
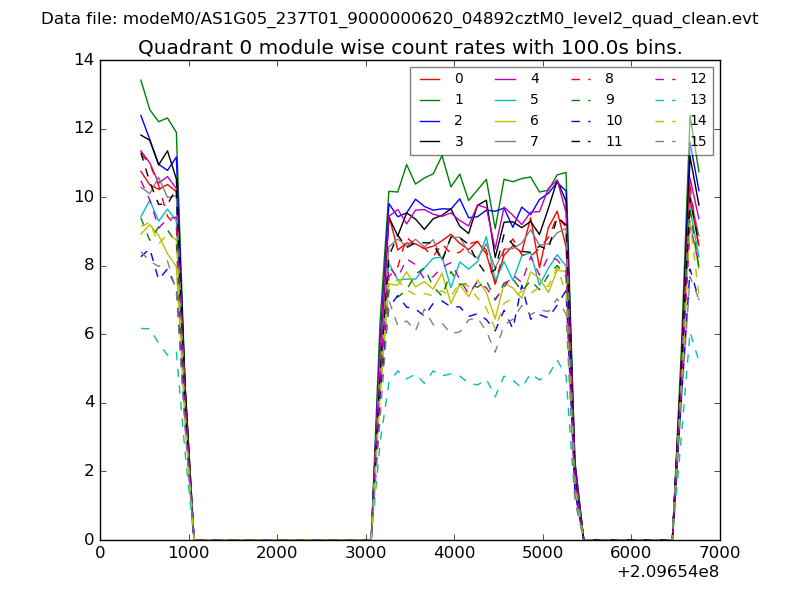 |
 |
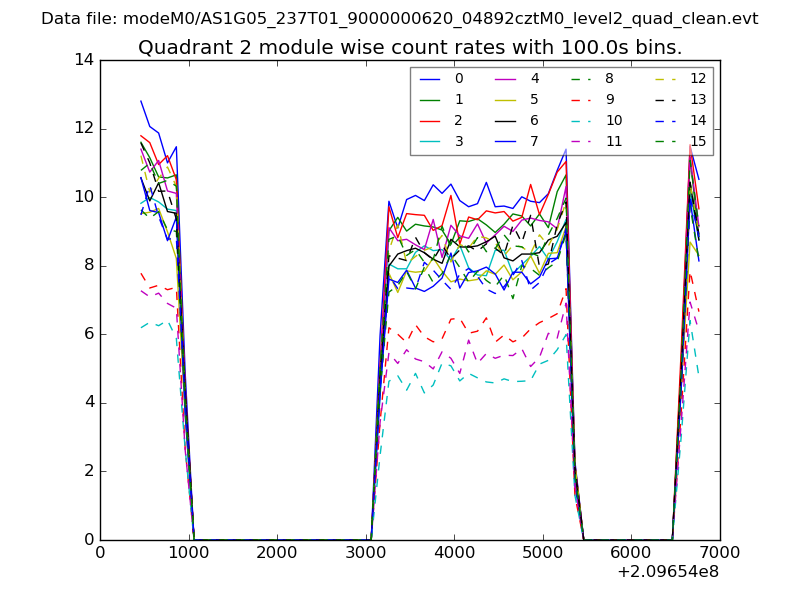
| Module-wise count rates for Quadrant B Data is divided into 100 sec bins |
 |
 |
| Module-wise count rates for Quadrant C Data is divided into 100 sec bins |
 |
 |
| Module-wise count rates for Quadrant D Data is divided into 100 sec bins |
 |
 |
| Parameter | Plot |
|---|---|
| CZT HV Monitor | 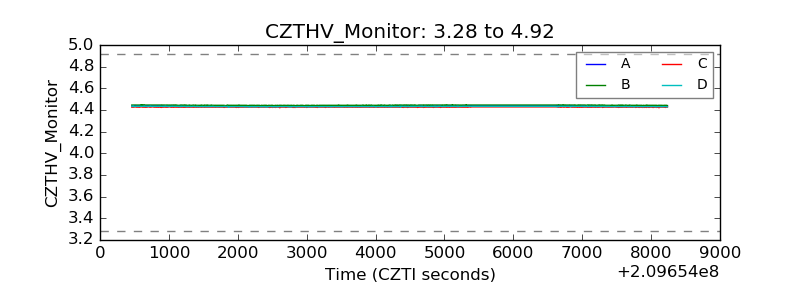 |
| D_VDD | 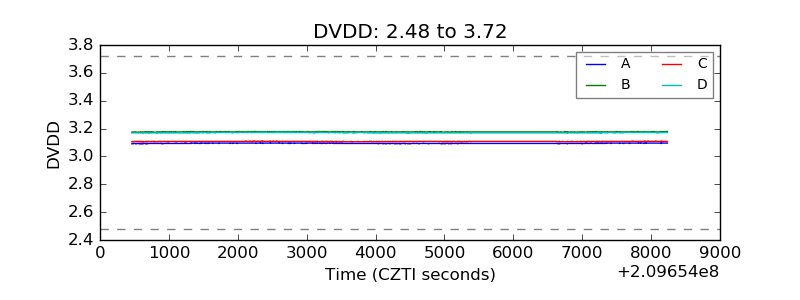 |
| Temperature 1 | 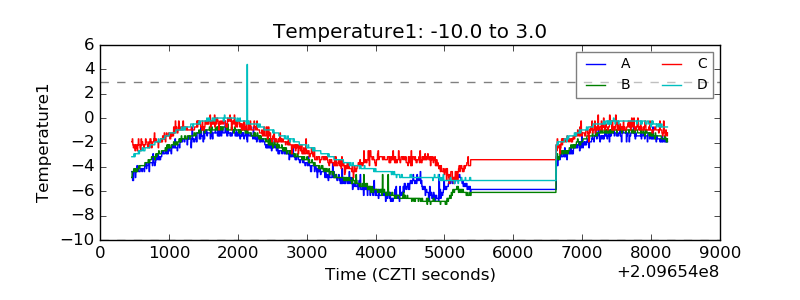 |
| Veto HV Monitor | 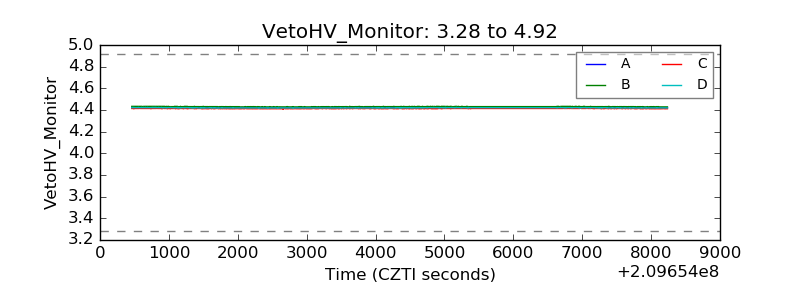 |
| Veto LLD | 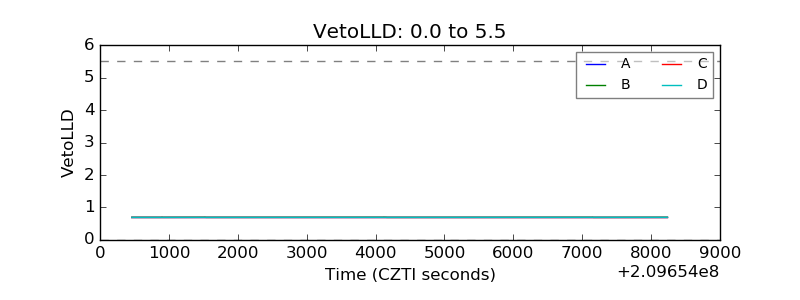 |
| Alpha Counter | 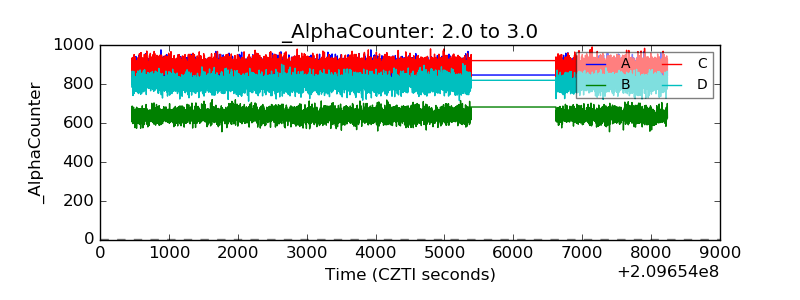 |
| _CPM_Rate | 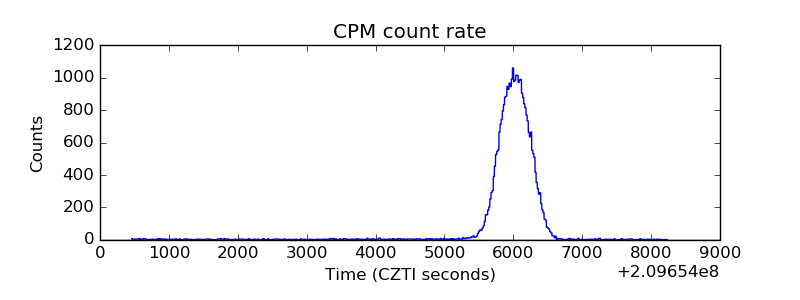 |
| CZT Counter | 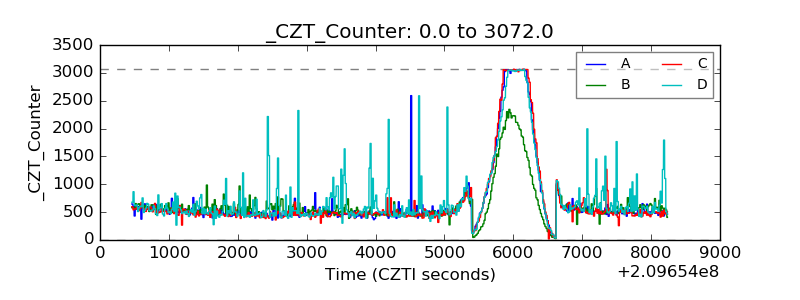 |
| +2.5 Volts monitor |  |
| +5 Volts monitor |  |
| _ROLL_ROT | 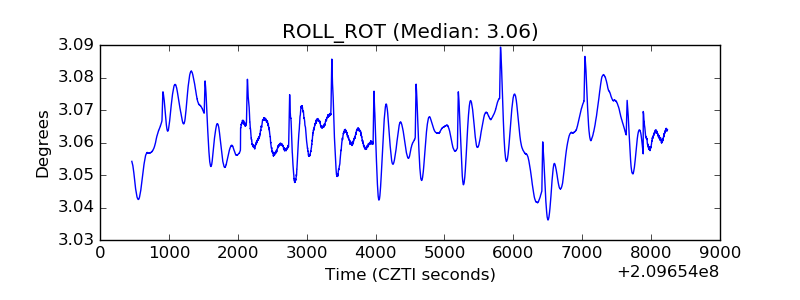 |
| _Roll_DEC | 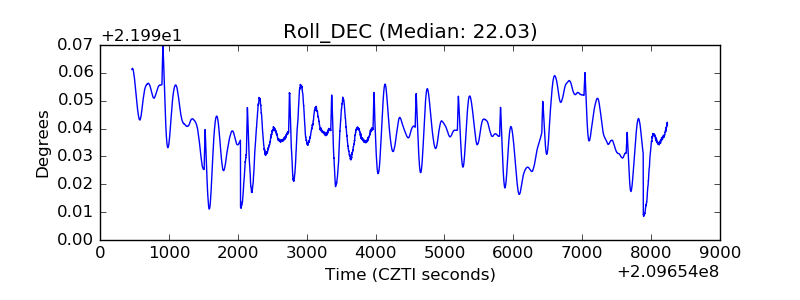 |
| _Roll_RA | 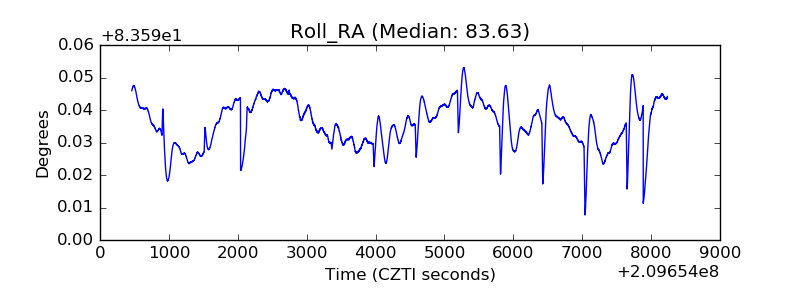 |
| Veto Counter | 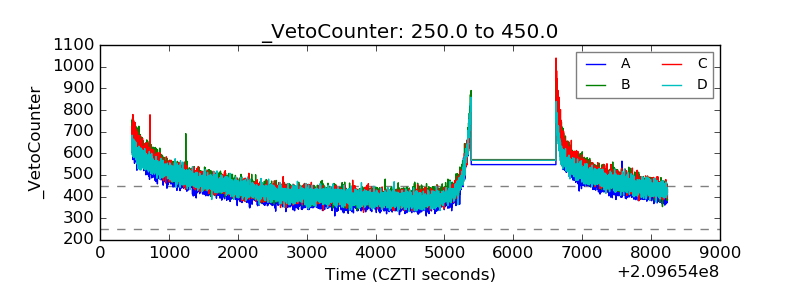 |