| Param | Original file | Final file |
|---|---|---|
| Filename | modeM0/AS1G05_237T01_9000000620_04893cztM0_level2.evt | modeM0/AS1G05_237T01_9000000620_04893cztM0_level2_quad_clean.evt |
| Size (bytes) | 504,362,880 | 64,068,480 |
| Size | 481.0 MB | 61.1 MB |
| Events in quadrant A | 3,491,282 | 374,010 |
| Events in quadrant B | 3,744,738 | 374,876 |
| Events in quadrant C | 3,272,004 | 371,133 |
| Events in quadrant D | 4,313,542 | 354,392 |
| Mode M9 | |||
|---|---|---|---|
| Quadrant | BADHDUFLAG | Total packets | Discarded packets |
| A | 0 | 12 | 0 |
| B | 0 | 12 | 0 |
| C | 0 | 12 | 0 |
| D | 0 | 13 | 0 |
| Mode SS | |||
|---|---|---|---|
| Quadrant | BADHDUFLAG | Total packets | Discarded packets |
| A | 0 | 136 | 0 |
| B | 0 | 136 | 0 |
| C | 0 | 136 | 0 |
| D | 0 | 136 | 0 |
| Mode M0 | |||
|---|---|---|---|
| Quadrant | BADHDUFLAG | Total packets | Discarded packets |
| A | 0 | 14453 | 3 |
| B | 0 | 15260 | 2 |
| C | 0 | 13922 | 2 |
| D | 0 | 17124 | 2 |
| Quadrant | Total seconds | Saturated seconds | Saturation percentage |
|---|---|---|---|
| A | 6673 | 175 | 2.622509% |
| B | 6673 | 160 | 2.397722% |
| C | 6673 | 106 | 1.588491% |
| D | 6673 | 268 | 4.016185% |
Noise dominated data is calculated using 1-second bins in cleaned event files. If a bin has >2000 counts, and if more than 50% of those come from <1% of pixels, then it is considered to be noise-dominated and hence unusable.
| Quadrant | # 1 sec bins | Bins with >0 counts | Bins with >2000 counts | High rate bins dominated by noise | Noise dominated (total time) | Noise dominated (detector-on time) | Marked lightcurve |
|---|---|---|---|---|---|---|---|
| A | 7838 | 6673 | 17 | 17 | 0.22% | 0.25% | 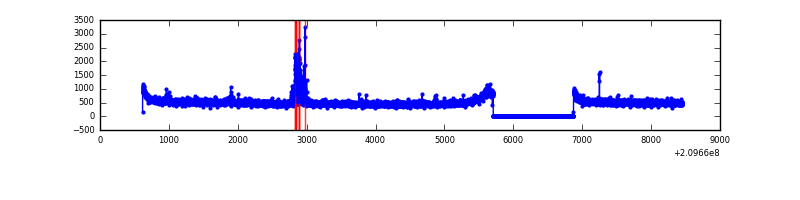 |
| B | 7838 | 6673 | 10 | 10 | 0.13% | 0.15% | 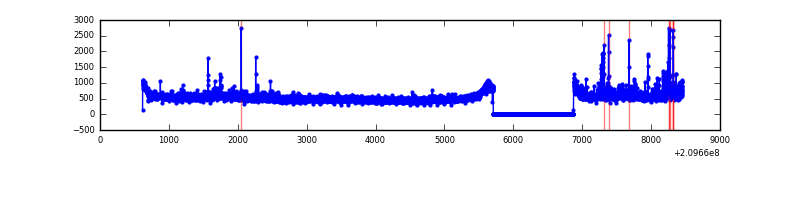 |
| C | 7838 | 6673 | 0 | 0 | 0.00% | 0.00% | 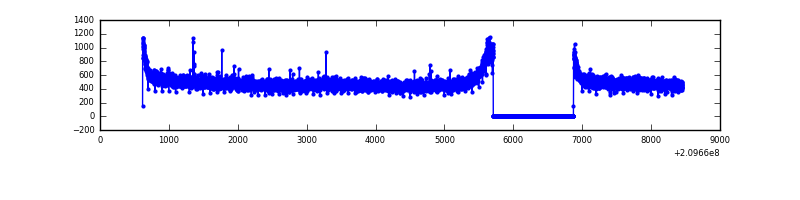 |
| D | 7838 | 6673 | 114 | 114 | 1.45% | 1.71% | 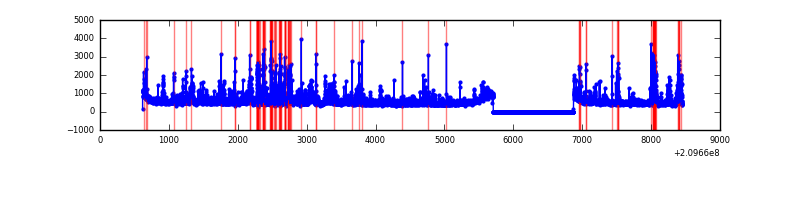 |
Top three noisy pixels from each quadrant. If the there are fewer than three noisy pixels in the level2.evt file, extra rows are filled as -1
| Pixel properties | Quadrant properties | ||||||
|---|---|---|---|---|---|---|---|
| Quadrant | DetID | PixID | Counts | Sigma | Mean | Median | Sigma |
| A | 0 | 50 | 125246 | 710.88 | 862 | 845 | 175.0 |
| A | 8 | 15 | 29609 | 164.37 | 862 | 845 | 175.0 |
| A | 13 | 251 | 12618 | 67.27 | 862 | 845 | 175.0 |
| B | 15 | 204 | 144950 | 870.81 | 865 | 847 | 165.5 |
| B | 0 | 219 | 58584 | 348.9 | 865 | 847 | 165.5 |
| B | 4 | 48 | 46647 | 276.77 | 865 | 847 | 165.5 |
| C | 12 | 4 | 7393 | 34.04 | 835 | 841 | 192.5 |
| C | 13 | 61 | 6989 | 31.94 | 835 | 841 | 192.5 |
| C | 14 | 67 | 5104 | 22.15 | 835 | 841 | 192.5 |
| D | 2 | 136 | 338061 | 1639.25 | 834 | 809 | 205.7 |
| D | 13 | 235 | 283956 | 1376.26 | 834 | 809 | 205.7 |
| D | 2 | 33 | 150957 | 729.81 | 834 | 809 | 205.7 |
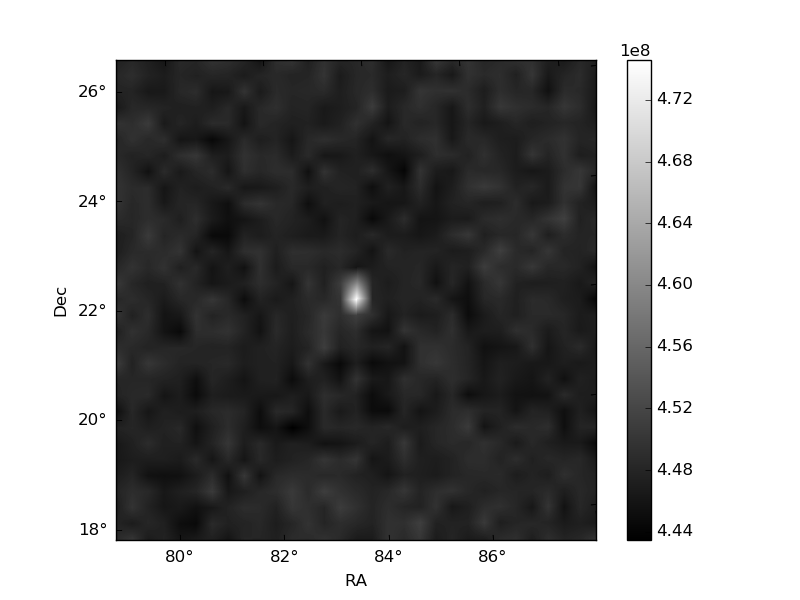
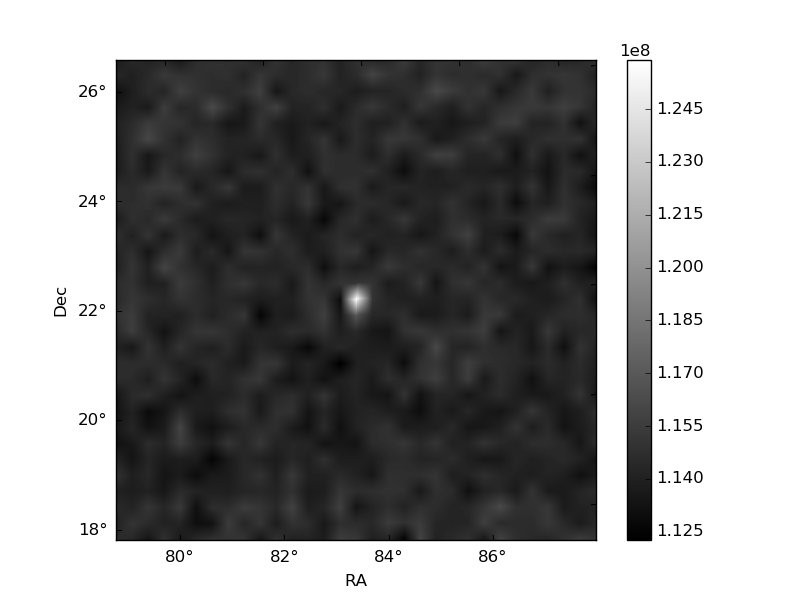
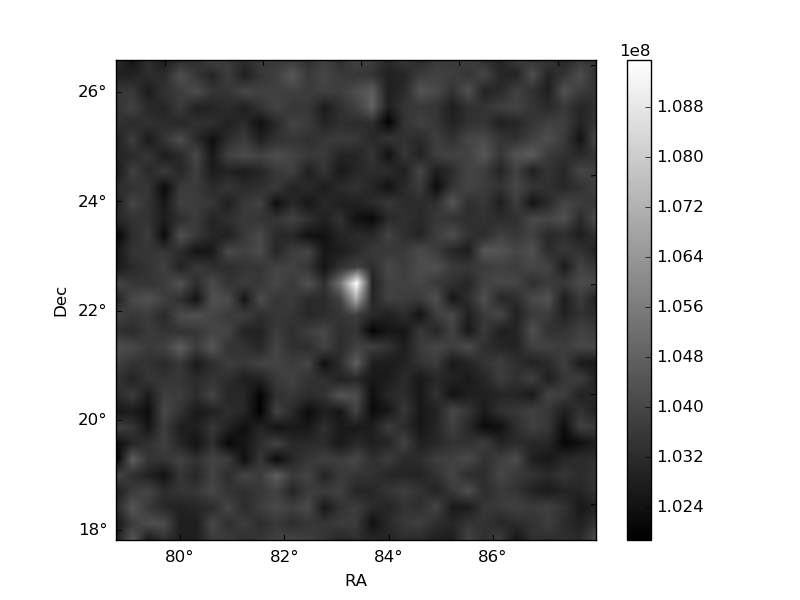
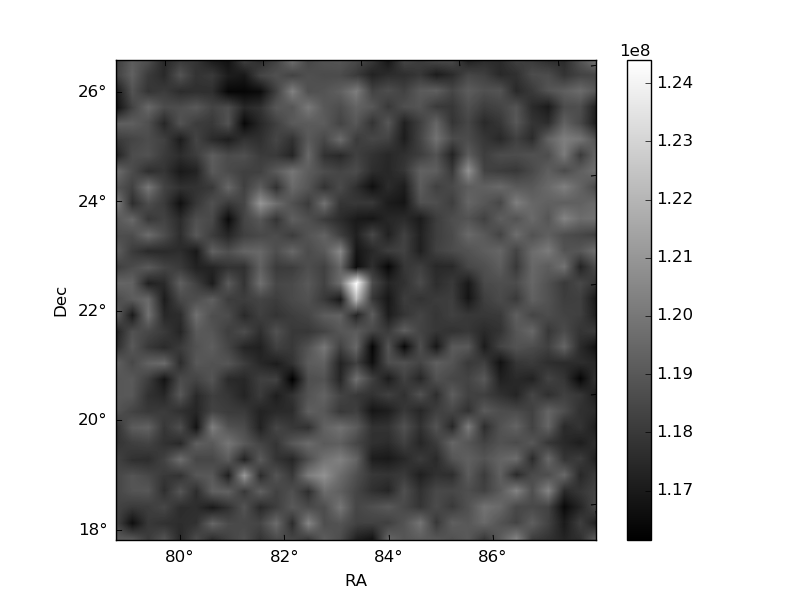
Histogram calculated using DETX and DETY for each event in the final _common_clean file
| Quadrant A | 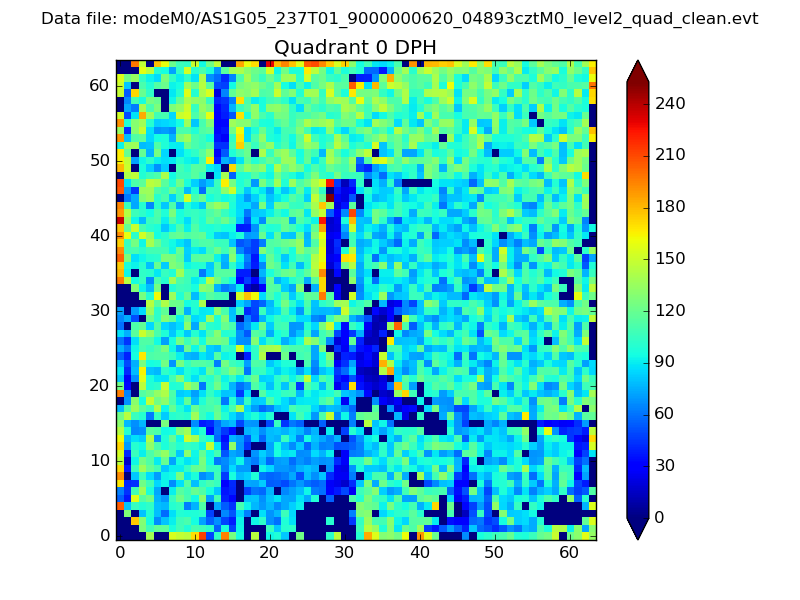 |
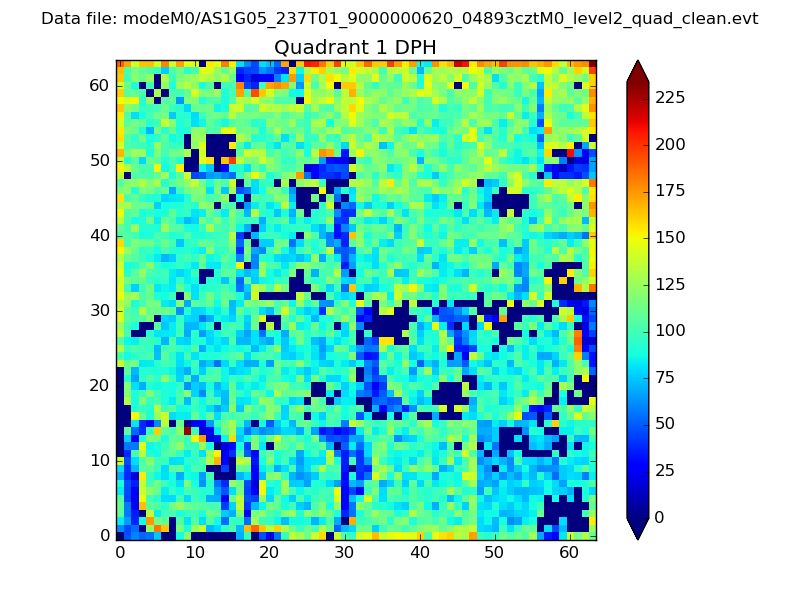 |
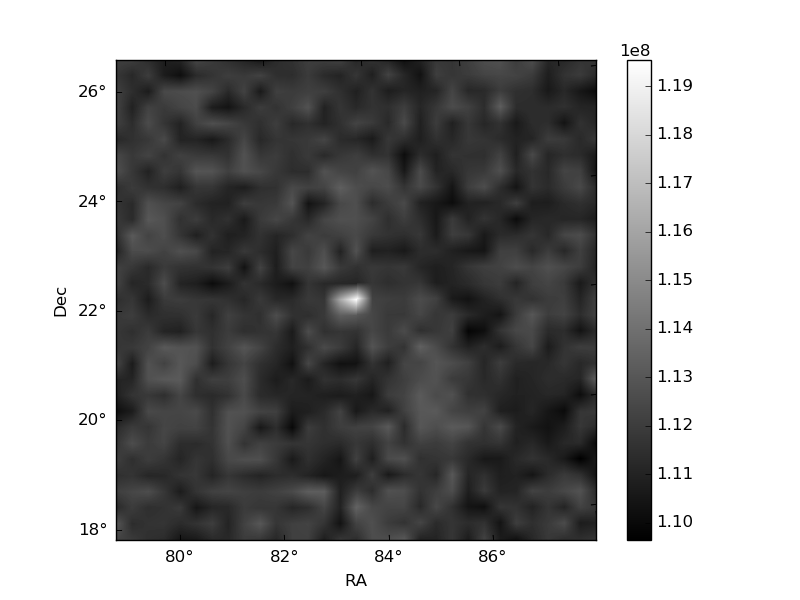
Quadrant B |
|---|---|---|---|
| Quadrant D | 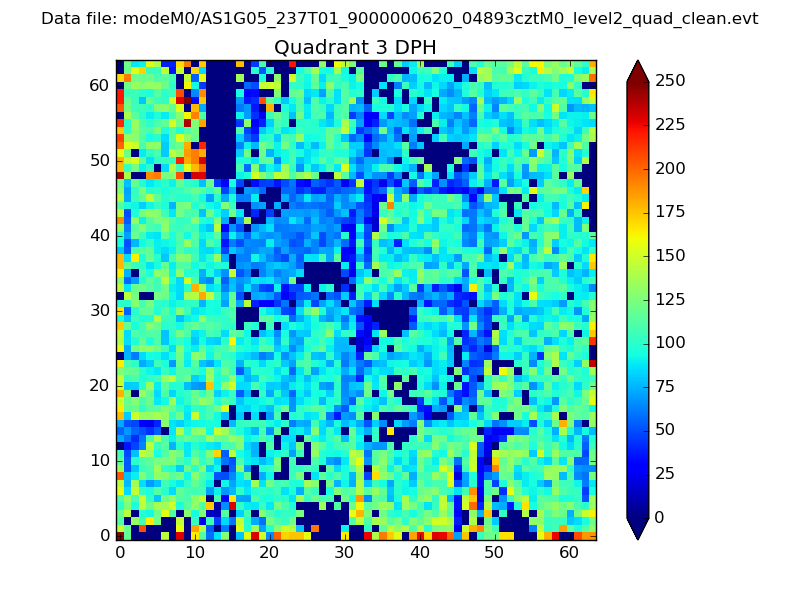 |
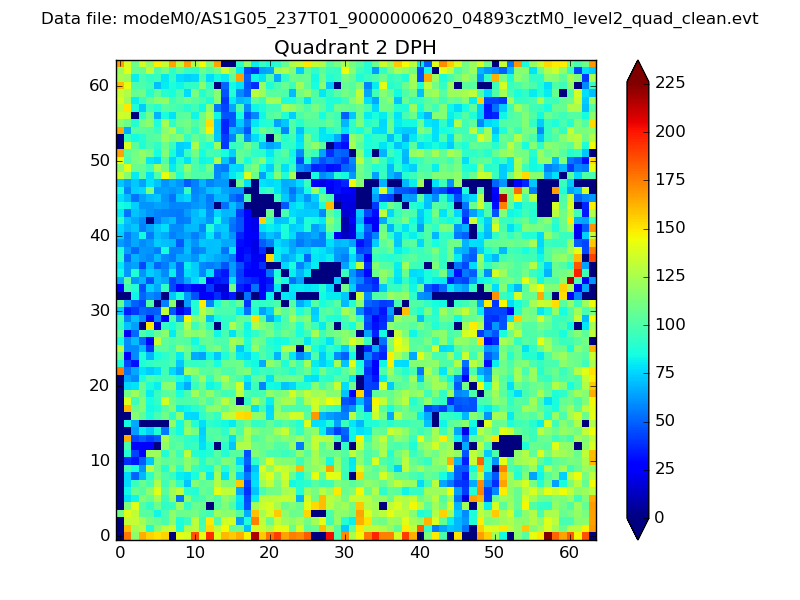 |
Quadrant C |
| Plot type | Count rate plots | Images |
|---|---|---|
| Comparison with Poisson distribution Blue bars denote a histogram of data divided into 1 sec bins. Red curve is a Poisson curve with rate = median count rate of data. |
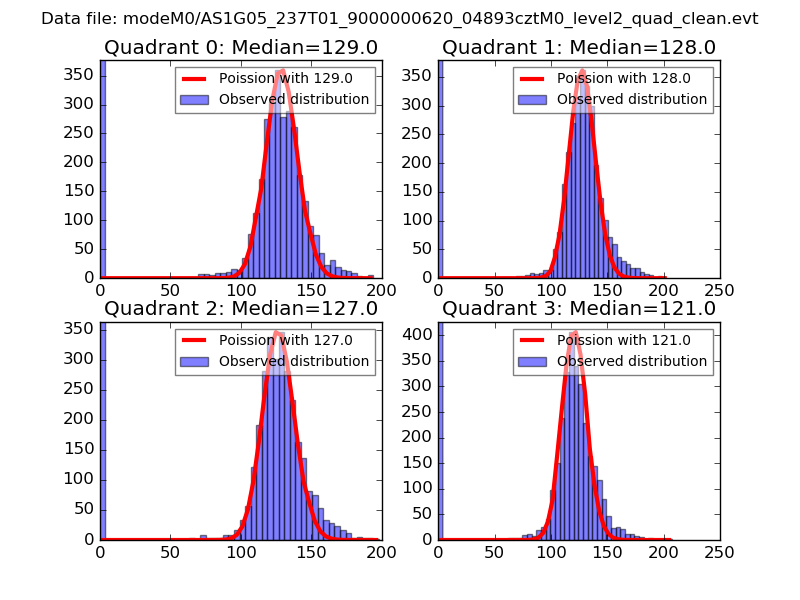 |
 |
| Quadrant-wise count rates Data is divided into 100 sec bins |
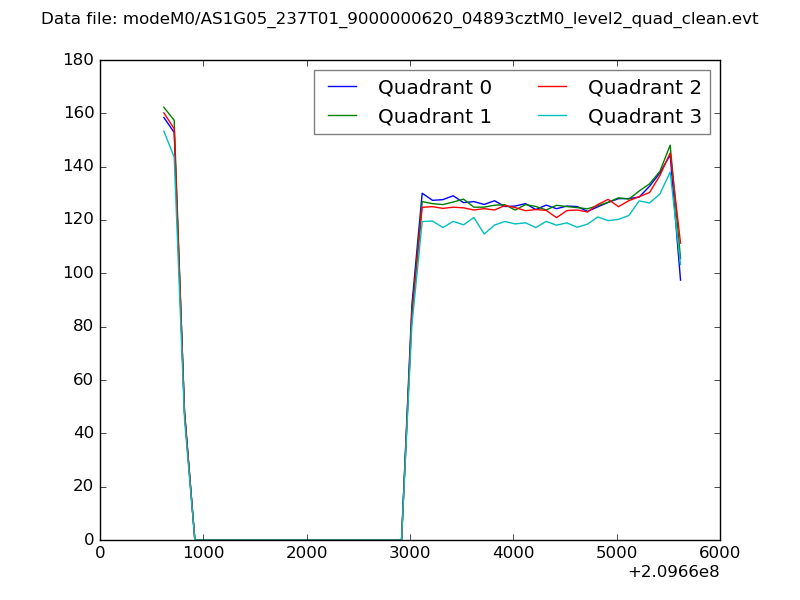 |
|
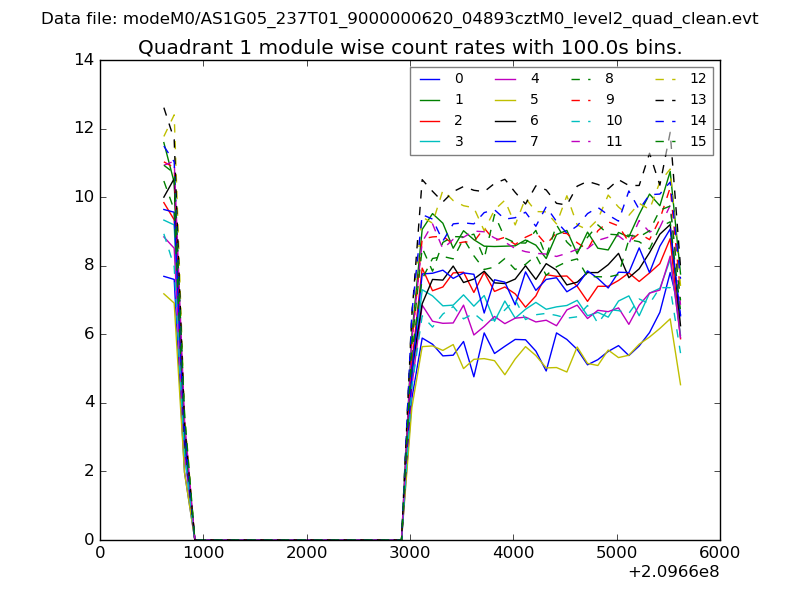
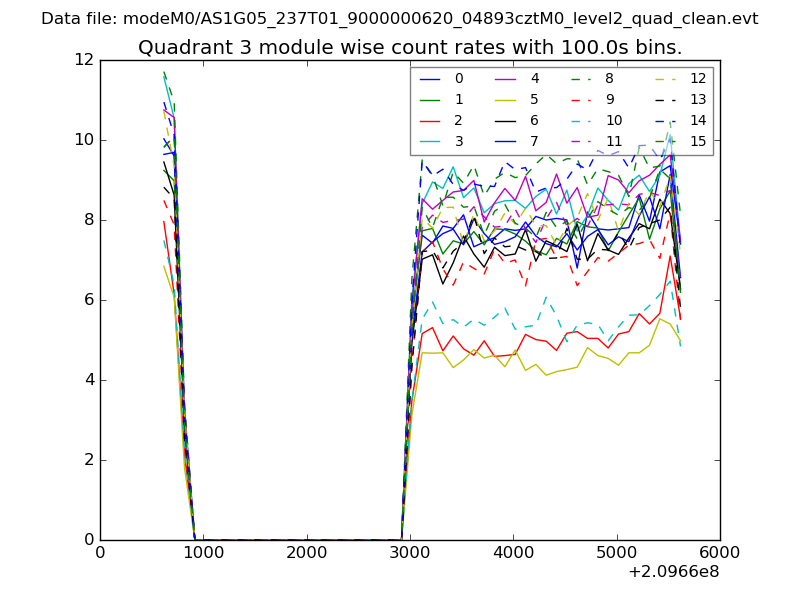
| Module-wise count rates for Quadrant A Data is divided into 100 sec bins |
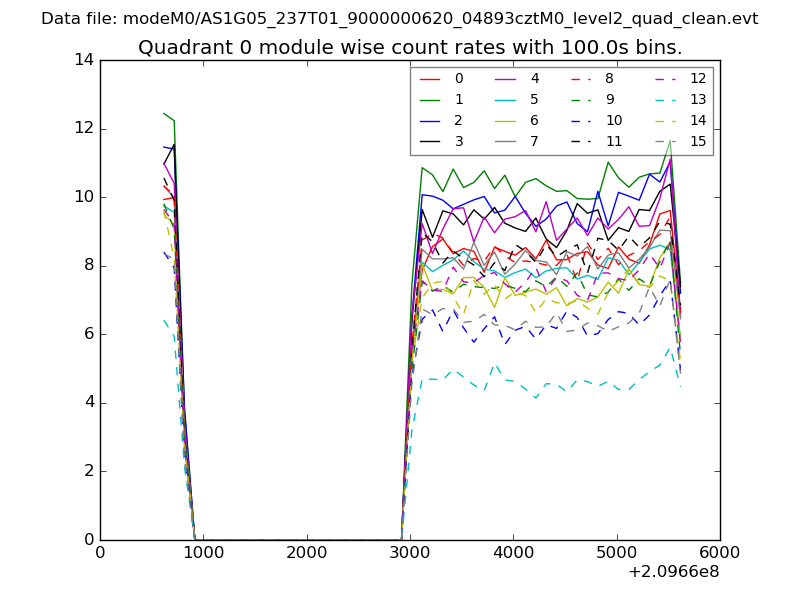 |
 |
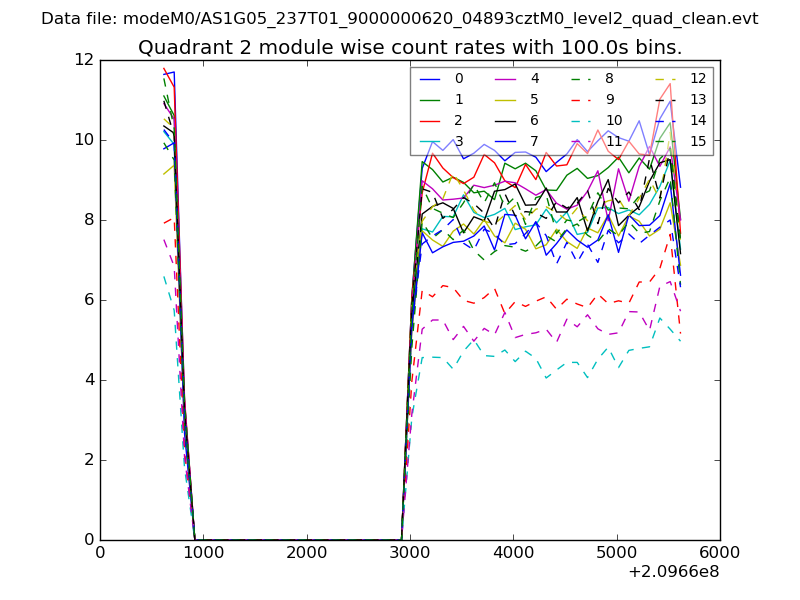
| Module-wise count rates for Quadrant B Data is divided into 100 sec bins |
 |
 |
| Module-wise count rates for Quadrant C Data is divided into 100 sec bins |
 |
 |
| Module-wise count rates for Quadrant D Data is divided into 100 sec bins |
 |
 |
| Parameter | Plot |
|---|---|
| CZT HV Monitor | 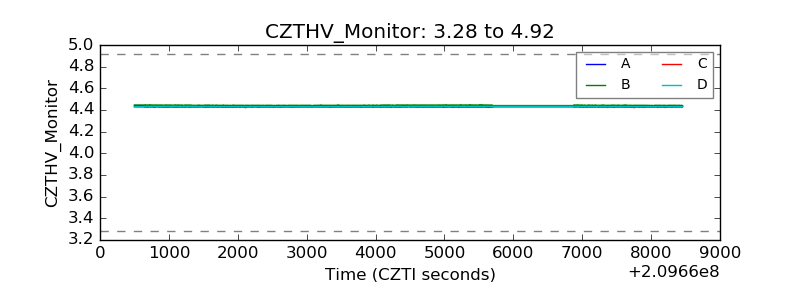 |
| D_VDD | 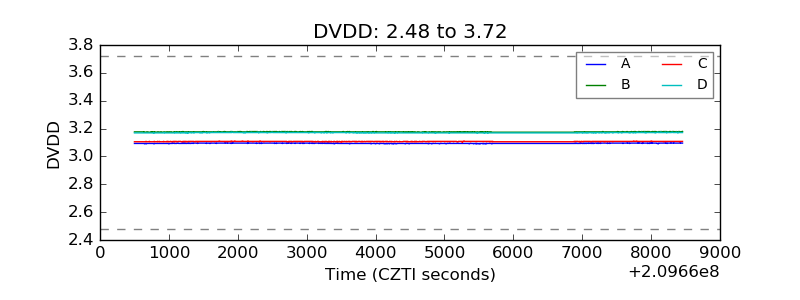 |
| Temperature 1 | 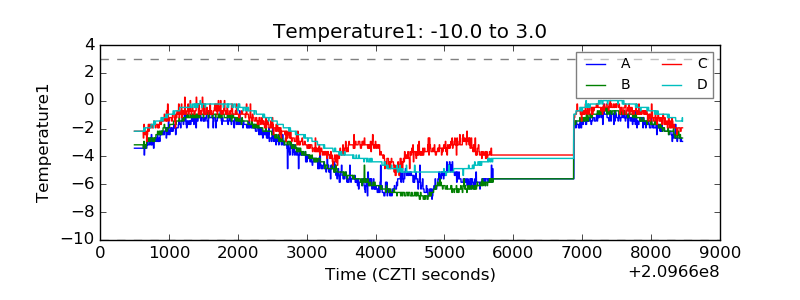 |
| Veto HV Monitor | 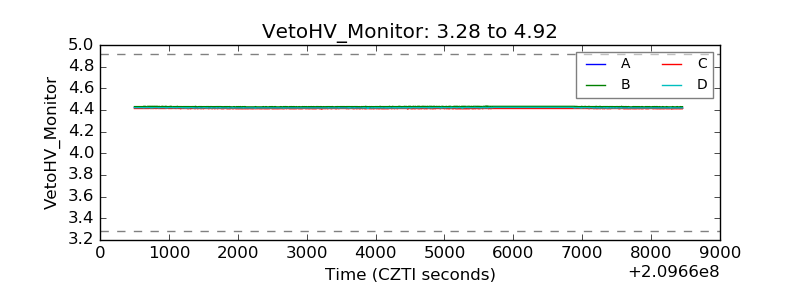 |
| Veto LLD | 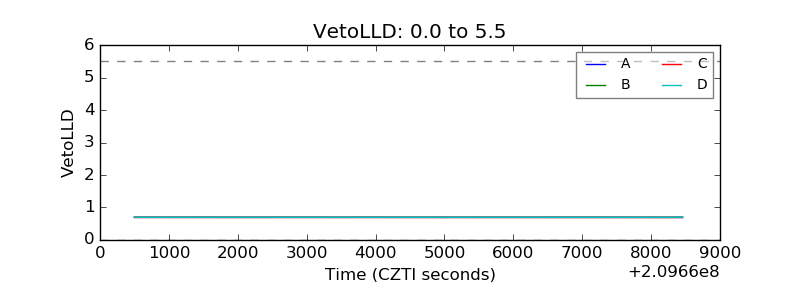 |
| Alpha Counter | 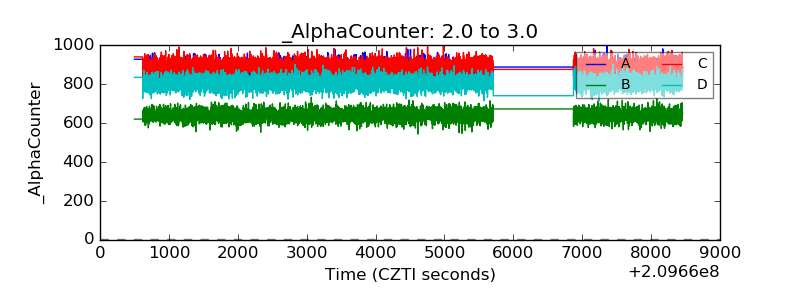 |
| _CPM_Rate | 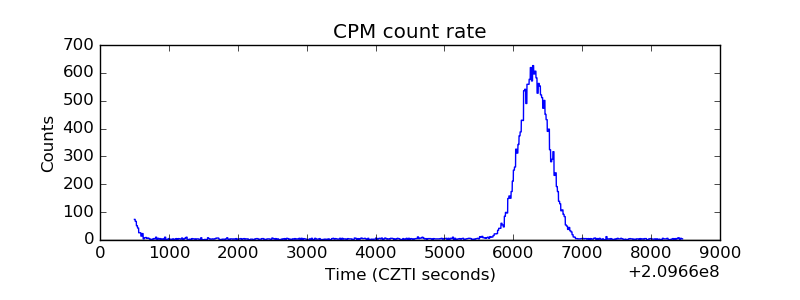 |
| CZT Counter | 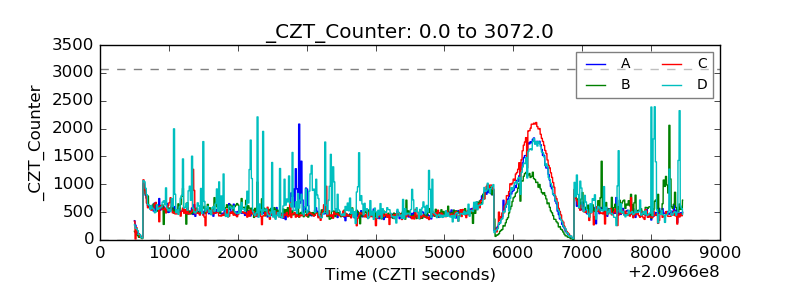 |
| +2.5 Volts monitor | 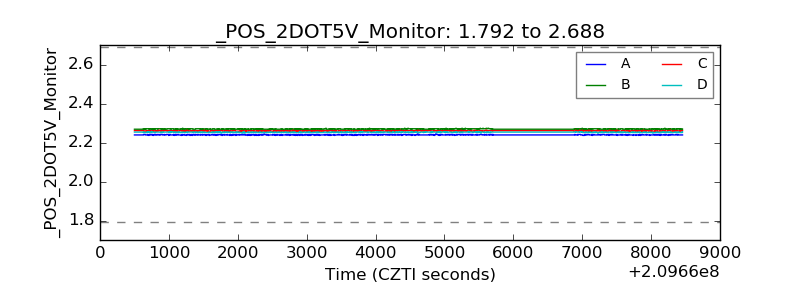 |
| +5 Volts monitor |  |
| _ROLL_ROT | 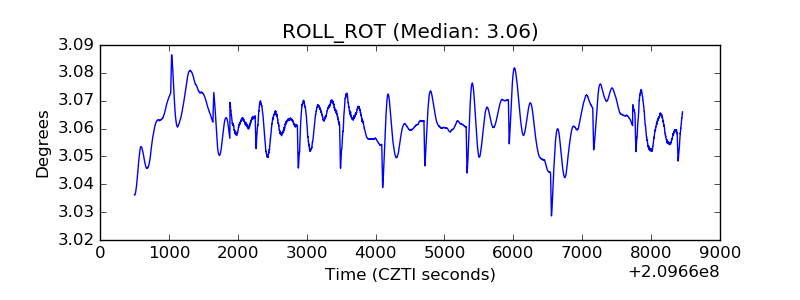 |
| _Roll_DEC | 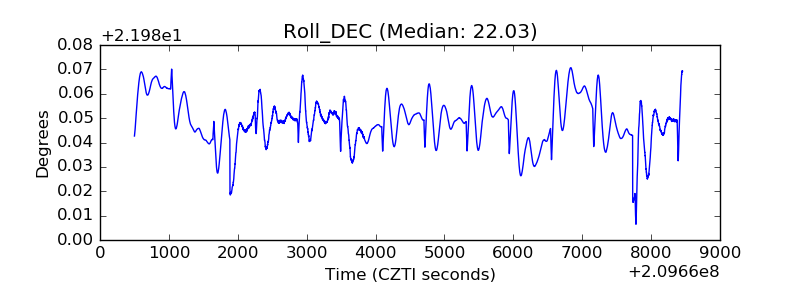 |
| _Roll_RA | 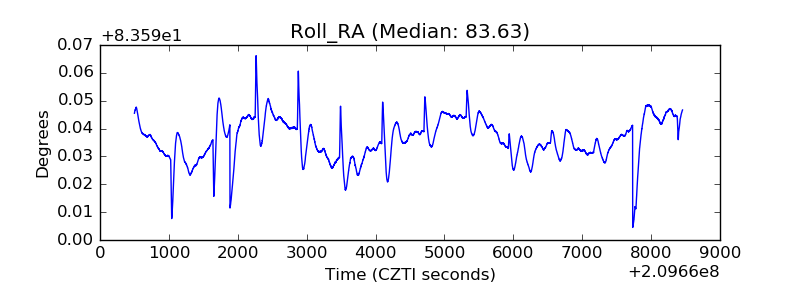 |
| Veto Counter | 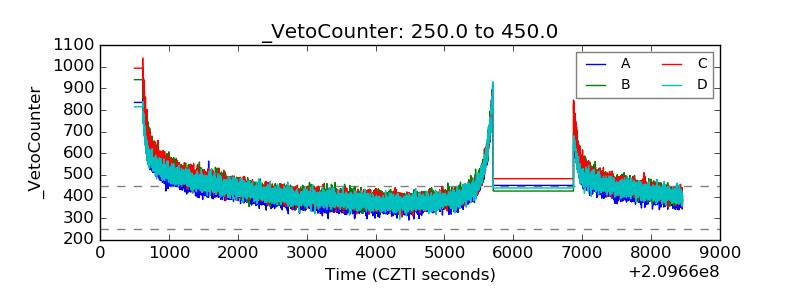 |