| Param | Original file | Final file |
|---|---|---|
| Filename | modeM0/AS1G05_237T01_9000000620_04894cztM0_level2.evt | modeM0/AS1G05_237T01_9000000620_04894cztM0_level2_quad_clean.evt |
| Size (bytes) | 524,024,640 | 67,803,840 |
| Size | 499.7 MB | 64.7 MB |
| Events in quadrant A | 3,448,821 | 403,629 |
| Events in quadrant B | 3,869,867 | 401,189 |
| Events in quadrant C | 3,225,132 | 399,200 |
| Events in quadrant D | 4,868,867 | 379,234 |
| Mode M9 | |||
|---|---|---|---|
| Quadrant | BADHDUFLAG | Total packets | Discarded packets |
| A | 0 | 13 | 0 |
| B | 0 | 13 | 0 |
| C | 0 | 13 | 0 |
| D | 0 | 14 | 0 |
| Mode SS | |||
|---|---|---|---|
| Quadrant | BADHDUFLAG | Total packets | Discarded packets |
| A | 0 | 138 | 0 |
| B | 0 | 138 | 0 |
| C | 0 | 138 | 0 |
| D | 0 | 138 | 0 |
| Mode M0 | |||
|---|---|---|---|
| Quadrant | BADHDUFLAG | Total packets | Discarded packets |
| A | 0 | 14460 | 4 |
| B | 0 | 15885 | 3 |
| C | 0 | 13957 | 3 |
| D | 0 | 18942 | 3 |
| Quadrant | Total seconds | Saturated seconds | Saturation percentage |
|---|---|---|---|
| A | 6734 | 151 | 2.242352% |
| B | 6734 | 151 | 2.242352% |
| C | 6734 | 101 | 1.499851% |
| D | 6734 | 599 | 8.895159% |
Noise dominated data is calculated using 1-second bins in cleaned event files. If a bin has >2000 counts, and if more than 50% of those come from <1% of pixels, then it is considered to be noise-dominated and hence unusable.
| Quadrant | # 1 sec bins | Bins with >0 counts | Bins with >2000 counts | High rate bins dominated by noise | Noise dominated (total time) | Noise dominated (detector-on time) | Marked lightcurve |
|---|---|---|---|---|---|---|---|
| A | 7699 | 6735 | 22 | 22 | 0.29% | 0.33% | 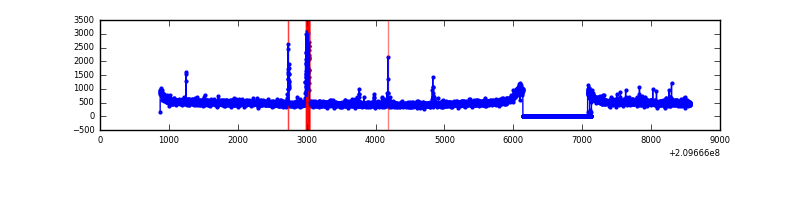 |
| B | 7699 | 6735 | 11 | 11 | 0.14% | 0.16% | 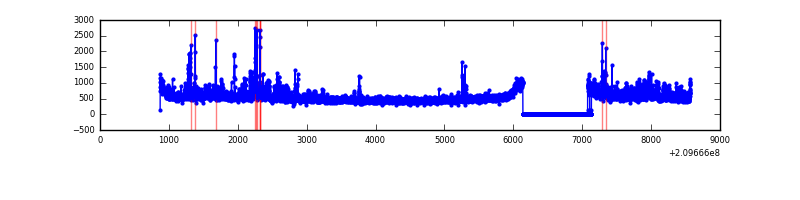 |
| C | 7699 | 6735 | 0 | 0 | 0.00% | 0.00% | 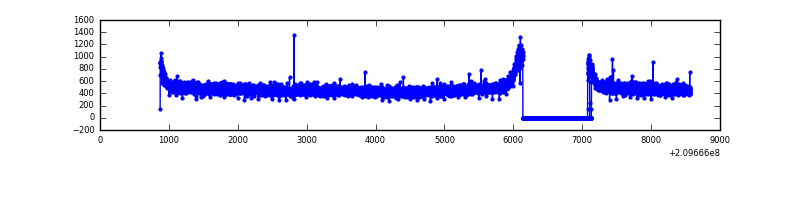 |
| D | 7699 | 6735 | 400 | 400 | 5.20% | 5.94% | 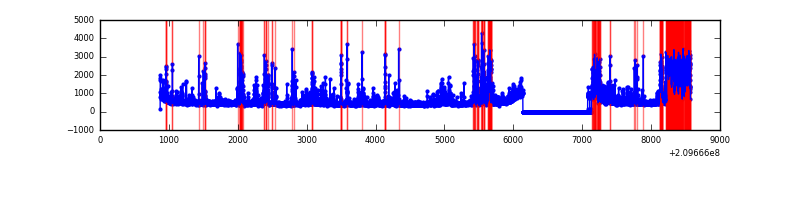 |
Top three noisy pixels from each quadrant. If the there are fewer than three noisy pixels in the level2.evt file, extra rows are filled as -1
| Pixel properties | Quadrant properties | ||||||
|---|---|---|---|---|---|---|---|
| Quadrant | DetID | PixID | Counts | Sigma | Mean | Median | Sigma |
| A | 0 | 50 | 118114 | 669.92 | 848 | 830 | 175.1 |
| A | 8 | 15 | 29029 | 161.07 | 848 | 830 | 175.1 |
| A | 13 | 251 | 24175 | 133.34 | 848 | 830 | 175.1 |
| B | 15 | 204 | 314078 | 1902.86 | 852 | 834 | 164.6 |
| B | 4 | 48 | 56405 | 337.58 | 852 | 834 | 164.6 |
| B | 15 | 255 | 45407 | 270.77 | 852 | 834 | 164.6 |
| C | 14 | 67 | 12089 | 58.94 | 822 | 829 | 191.0 |
| C | 13 | 61 | 6856 | 31.55 | 822 | 829 | 191.0 |
| C | 12 | 4 | 4615 | 19.82 | 822 | 829 | 191.0 |
| D | 1 | 52 | 542399 | 2762.7 | 801 | 779 | 196.0 |
| D | 1 | 31 | 495164 | 2521.77 | 801 | 779 | 196.0 |
| D | 13 | 235 | 256790 | 1305.87 | 801 | 779 | 196.0 |
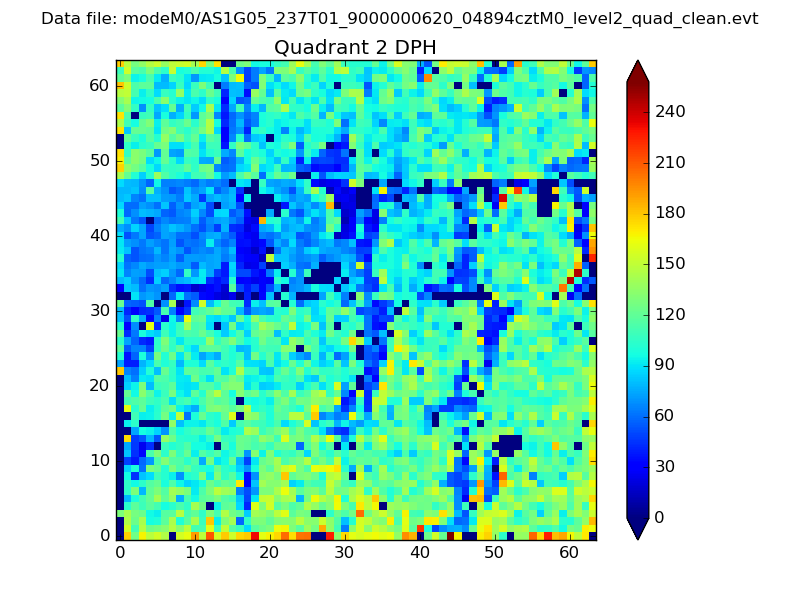
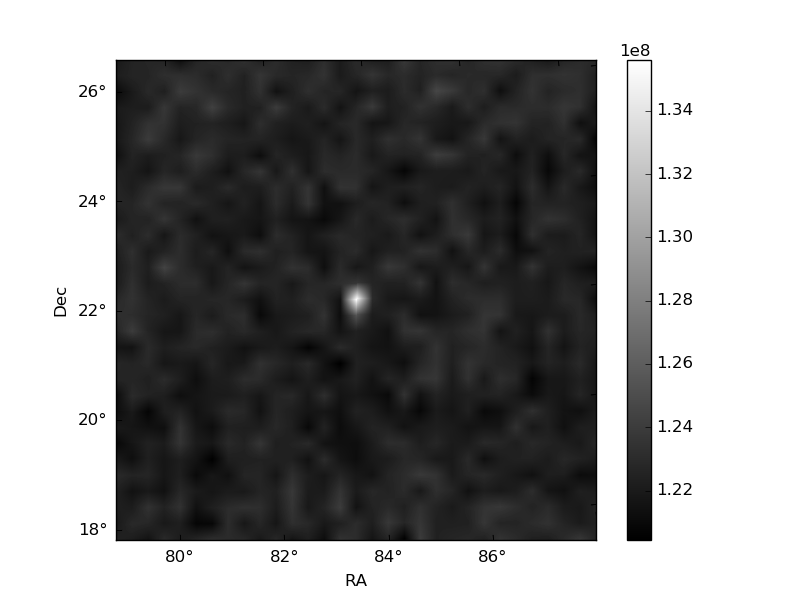
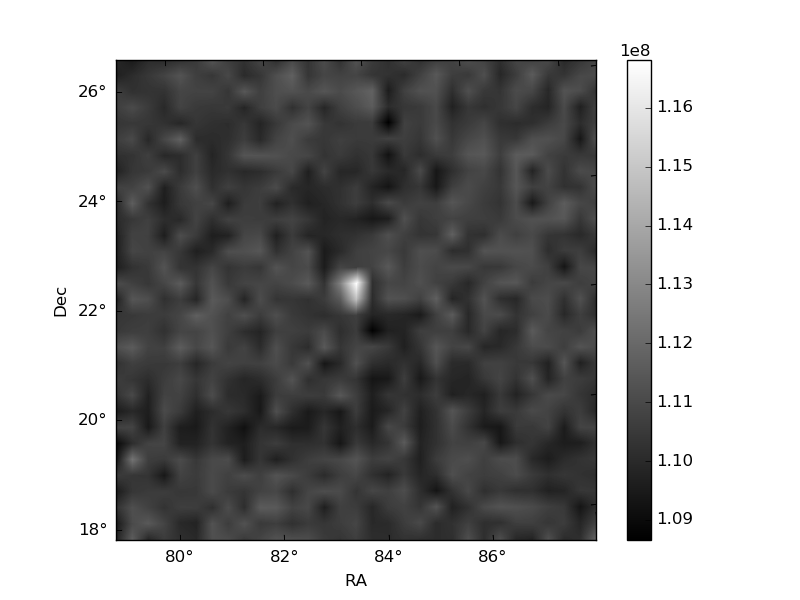
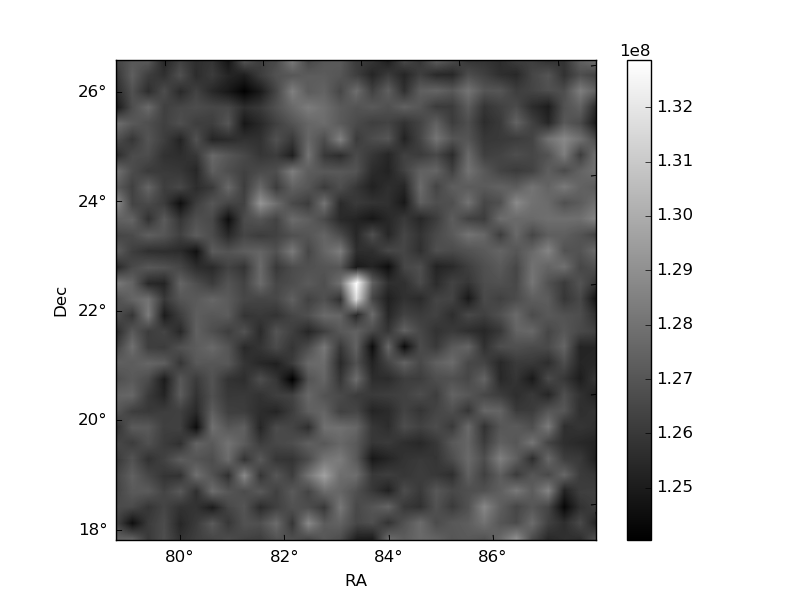
Histogram calculated using DETX and DETY for each event in the final _common_clean file
| Quadrant A | 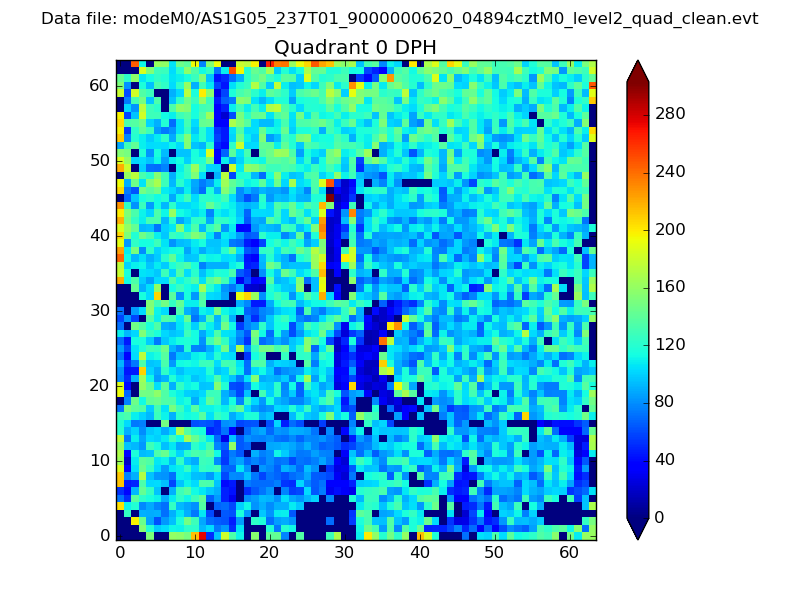 |
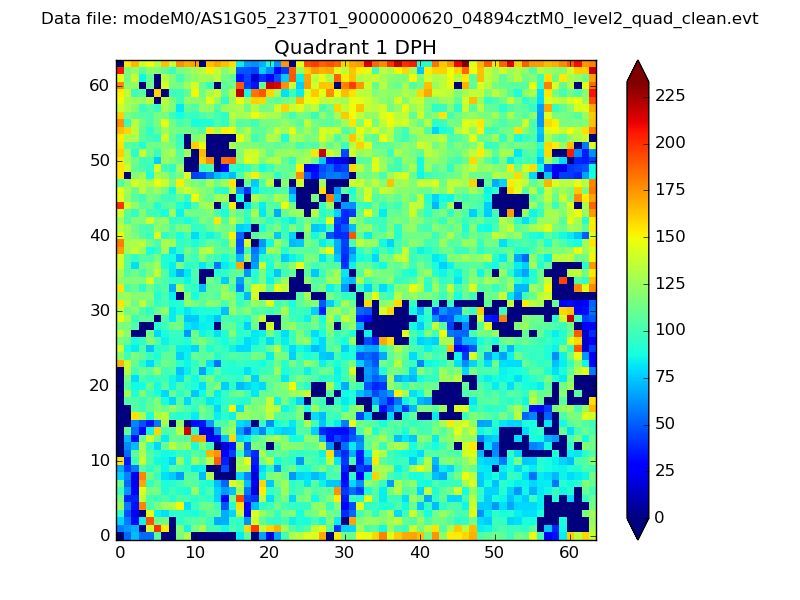 |
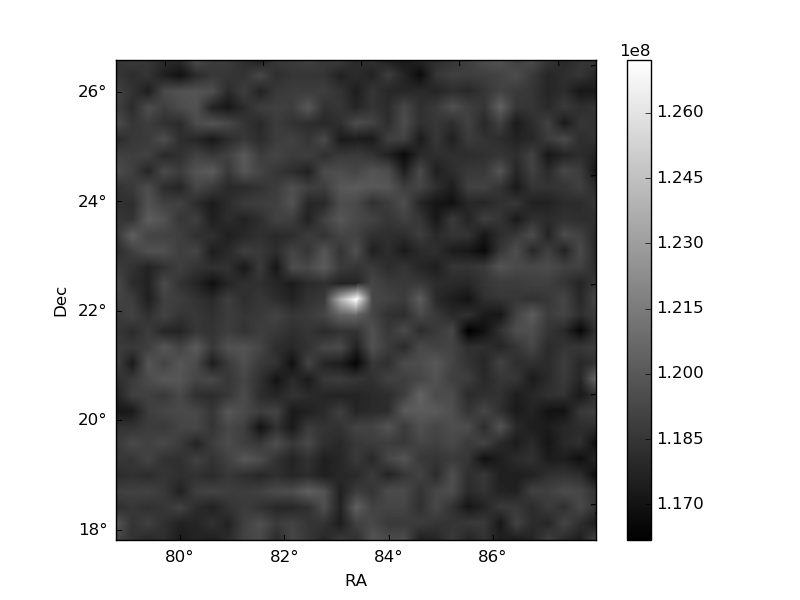
Quadrant B |
|---|---|---|---|
| Quadrant D | 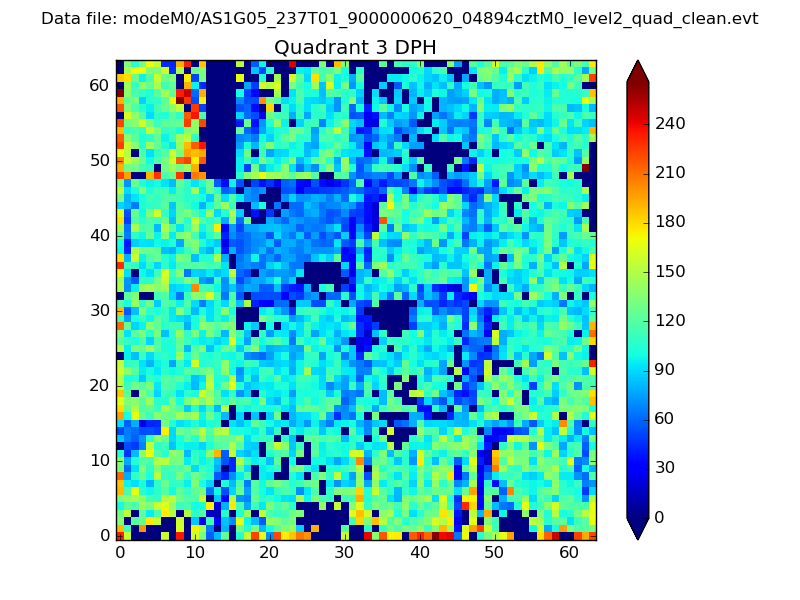 |
 |
Quadrant C |
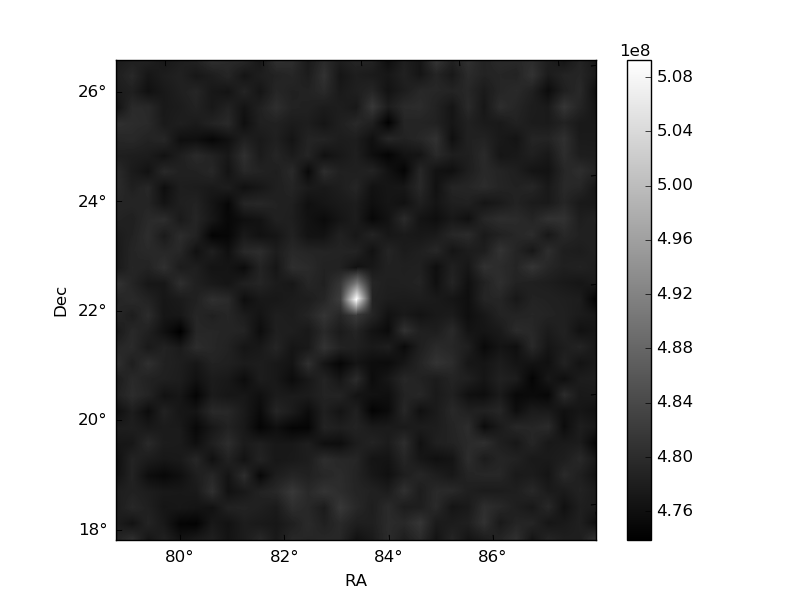
| Plot type | Count rate plots | Images |
|---|---|---|
| Comparison with Poisson distribution Blue bars denote a histogram of data divided into 1 sec bins. Red curve is a Poisson curve with rate = median count rate of data. |
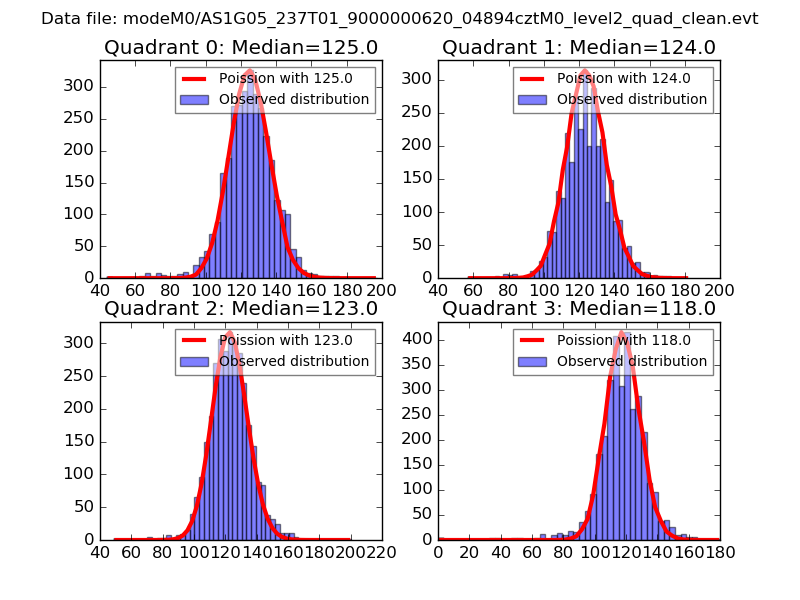 |
 |
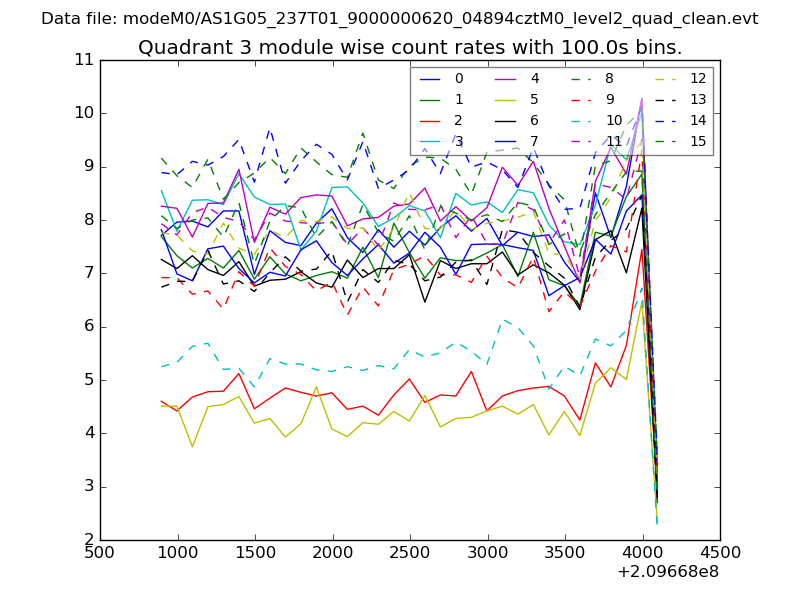
| Quadrant-wise count rates Data is divided into 100 sec bins |
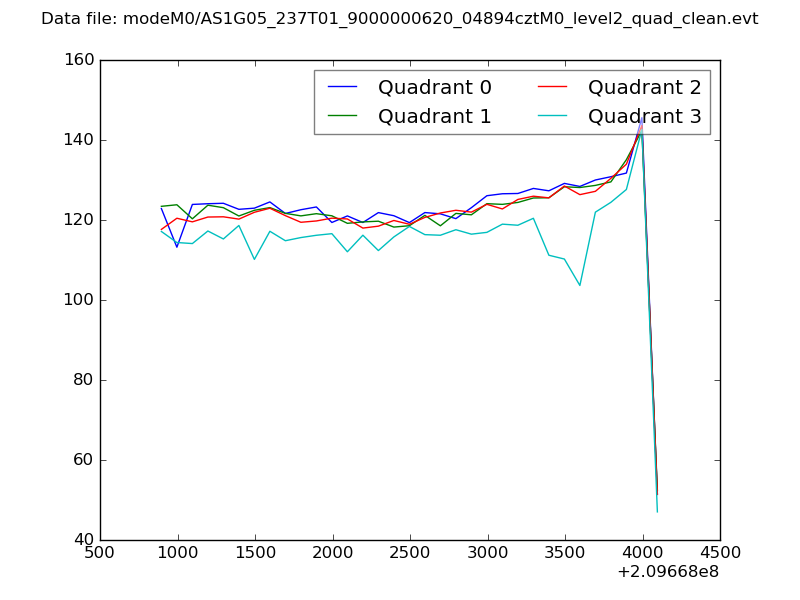 |
|
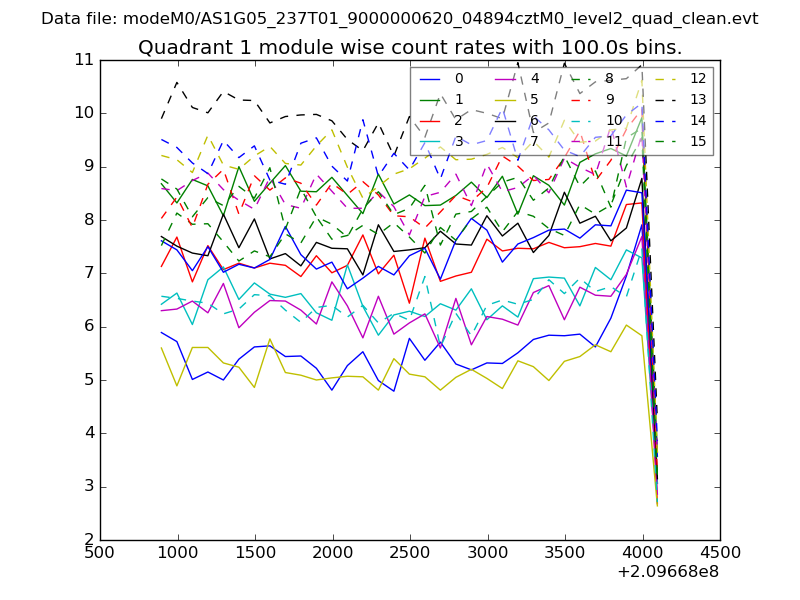
| Module-wise count rates for Quadrant A Data is divided into 100 sec bins |
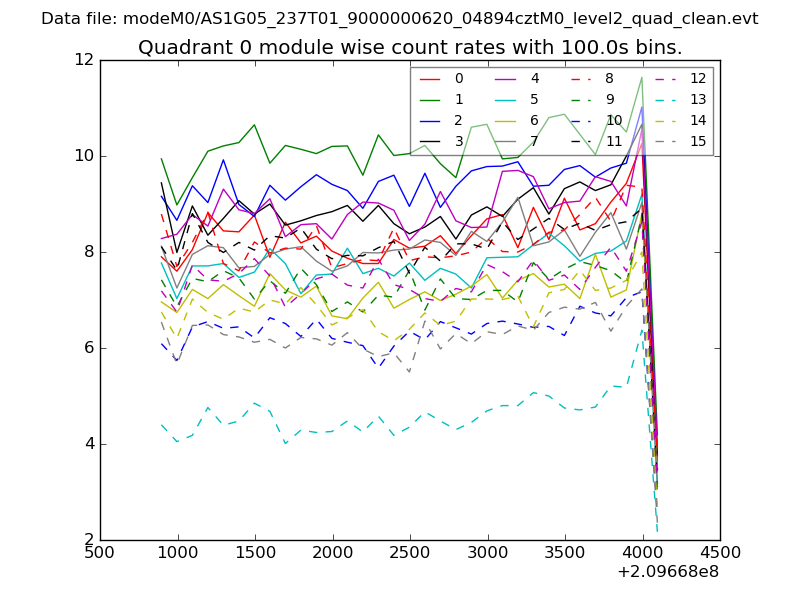 |
 |
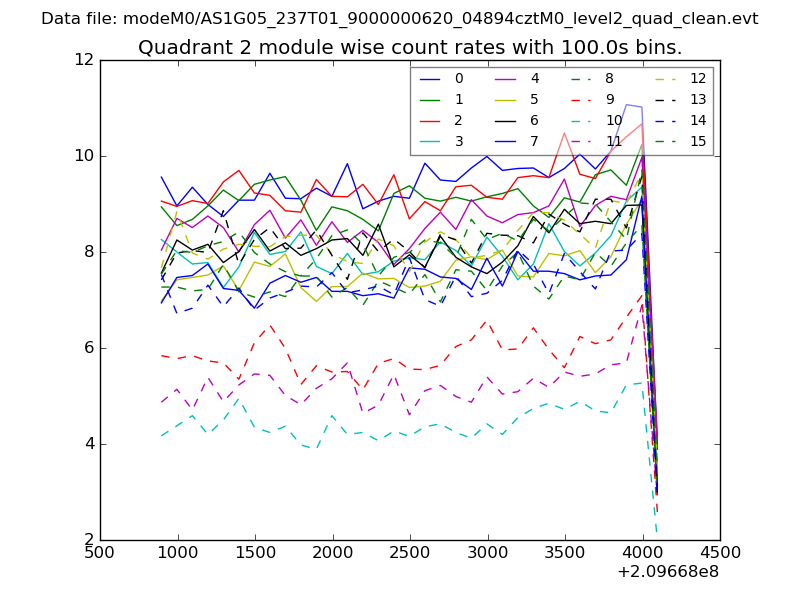
| Module-wise count rates for Quadrant B Data is divided into 100 sec bins |
 |
 |
| Module-wise count rates for Quadrant C Data is divided into 100 sec bins |
 |
 |
| Module-wise count rates for Quadrant D Data is divided into 100 sec bins |
 |
 |
| Parameter | Plot |
|---|---|
| CZT HV Monitor | 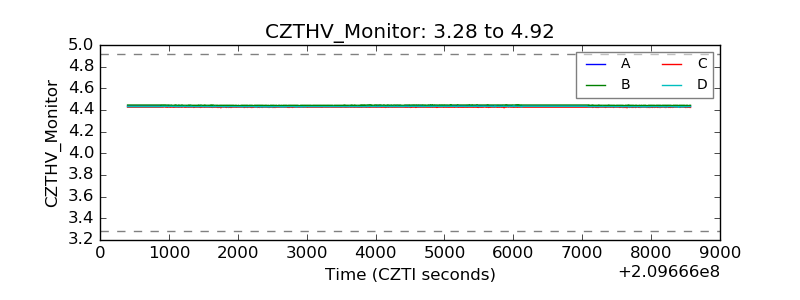 |
| D_VDD | 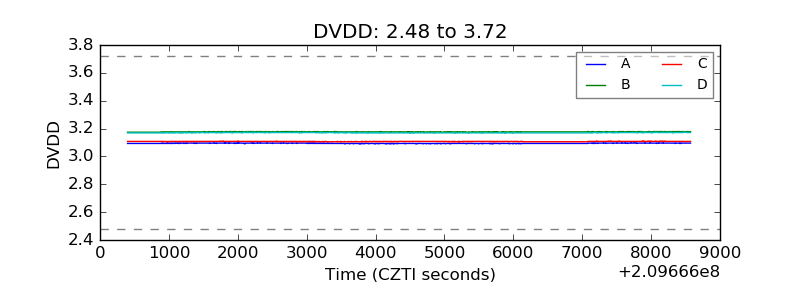 |
| Temperature 1 | 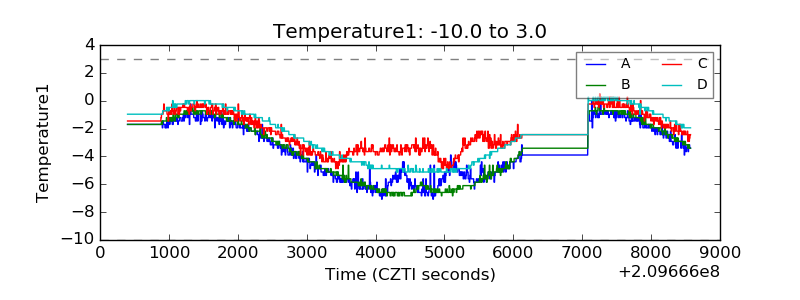 |
| Veto HV Monitor | 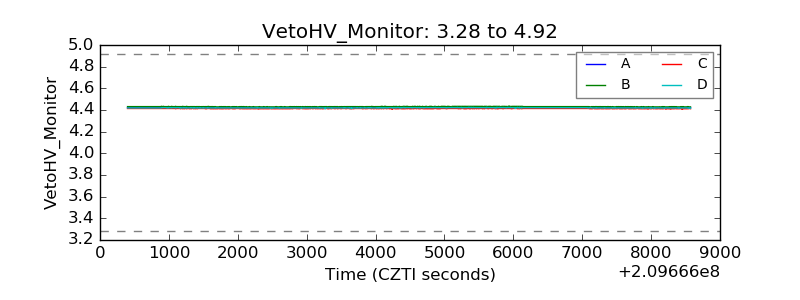 |
| Veto LLD | 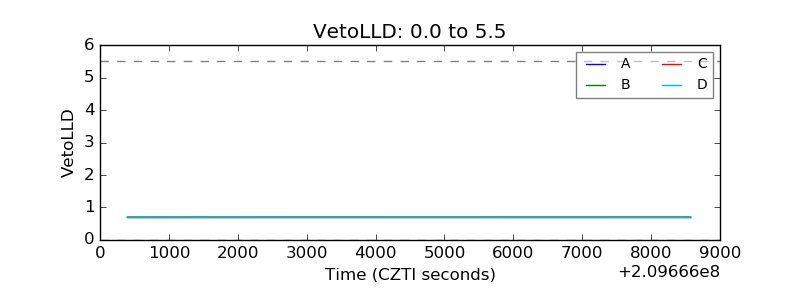 |
| Alpha Counter | 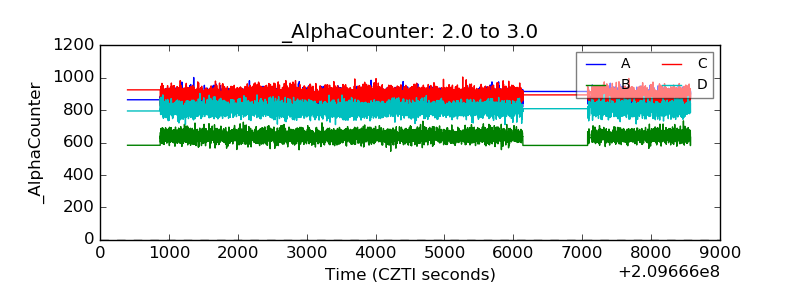 |
| _CPM_Rate | 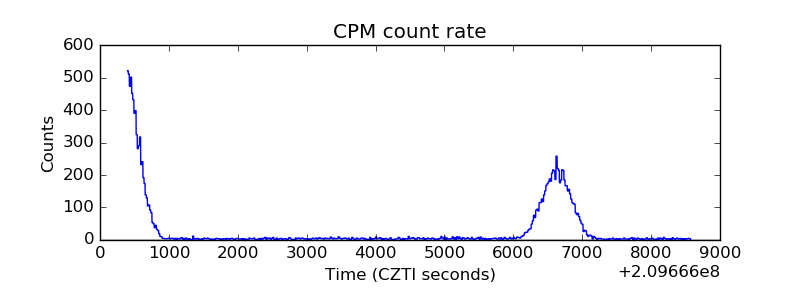 |
| CZT Counter | 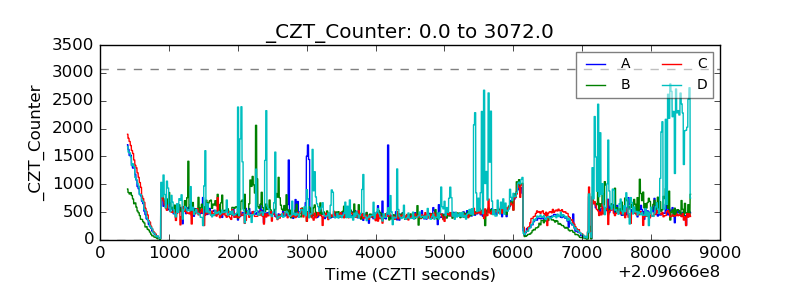 |
| +2.5 Volts monitor | 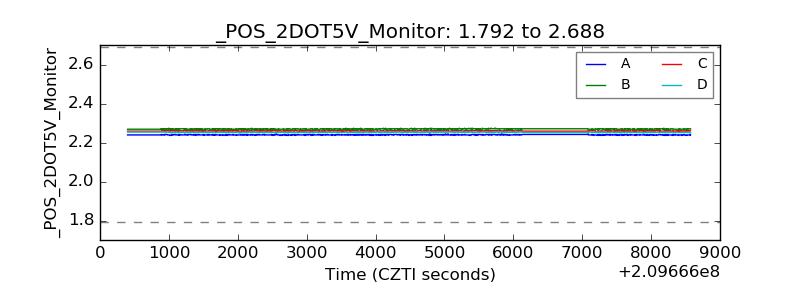 |
| +5 Volts monitor |  |
| _ROLL_ROT | 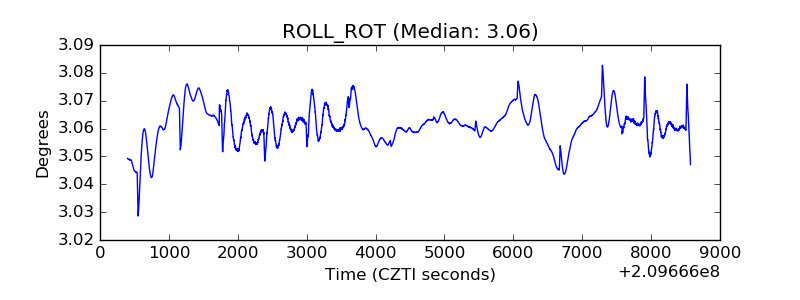 |
| _Roll_DEC | 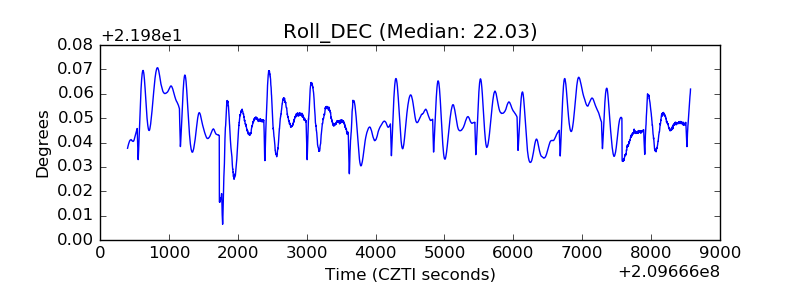 |
| _Roll_RA | 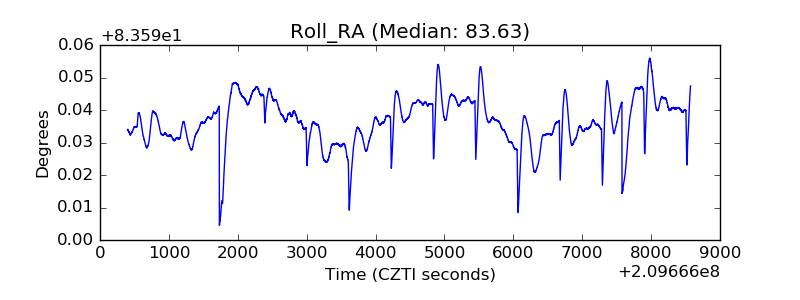 |
| Veto Counter | 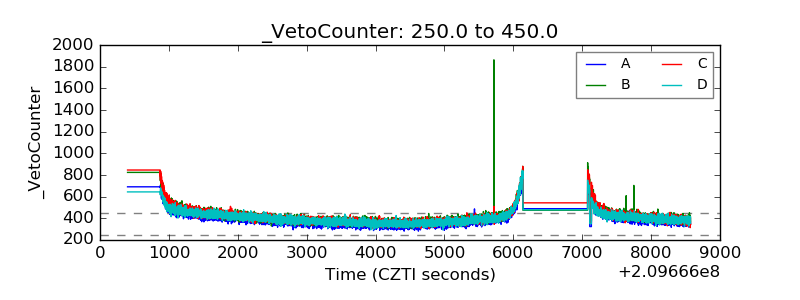 |