| Param | Original file | Final file |
|---|---|---|
| Filename | modeM0/AS1G05_237T01_9000000620_04895cztM0_level2.evt | modeM0/AS1G05_237T01_9000000620_04895cztM0_level2_quad_clean.evt |
| Size (bytes) | 560,013,120 | 75,841,920 |
| Size | 534.1 MB | 72.3 MB |
| Events in quadrant A | 3,318,100 | 465,741 |
| Events in quadrant B | 3,717,171 | 461,685 |
| Events in quadrant C | 3,130,514 | 461,548 |
| Events in quadrant D | 6,336,914 | 437,529 |
| Mode M9 | |||
|---|---|---|---|
| Quadrant | BADHDUFLAG | Total packets | Discarded packets |
| A | 0 | 7 | 0 |
| B | 0 | 7 | 0 |
| C | 0 | 7 | 0 |
| D | 0 | 7 | 0 |
| Mode SS | |||
|---|---|---|---|
| Quadrant | BADHDUFLAG | Total packets | Discarded packets |
| A | 0 | 136 | 0 |
| B | 0 | 136 | 0 |
| C | 0 | 136 | 0 |
| D | 0 | 136 | 0 |
| Mode M0 | |||
|---|---|---|---|
| Quadrant | BADHDUFLAG | Total packets | Discarded packets |
| A | 0 | 14121 | 2 |
| B | 0 | 15395 | 1 |
| C | 0 | 13773 | 1 |
| D | 0 | 23448 | 1 |
| Quadrant | Total seconds | Saturated seconds | Saturation percentage |
|---|---|---|---|
| A | 6745 | 83 | 1.230541% |
| B | 6745 | 73 | 1.082283% |
| C | 6745 | 39 | 0.578206% |
| D | 6745 | 1199 | 17.776130% |
Noise dominated data is calculated using 1-second bins in cleaned event files. If a bin has >2000 counts, and if more than 50% of those come from <1% of pixels, then it is considered to be noise-dominated and hence unusable.
| Quadrant | # 1 sec bins | Bins with >0 counts | Bins with >2000 counts | High rate bins dominated by noise | Noise dominated (total time) | Noise dominated (detector-on time) | Marked lightcurve |
|---|---|---|---|---|---|---|---|
| A | 7385 | 6746 | 14 | 14 | 0.19% | 0.21% | 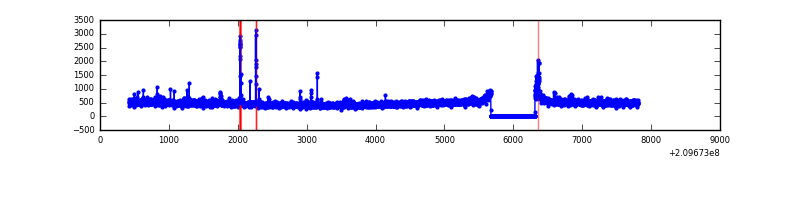 |
| B | 7385 | 6746 | 2 | 2 | 0.03% | 0.03% | 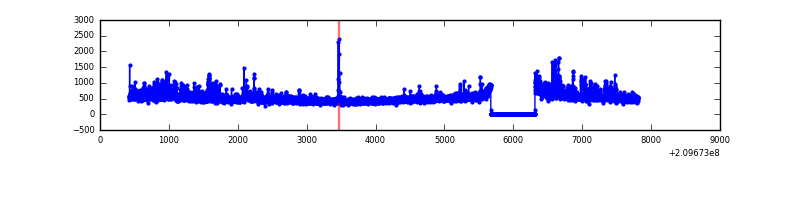 |
| C | 7385 | 6746 | 0 | 0 | 0.00% | 0.00% | 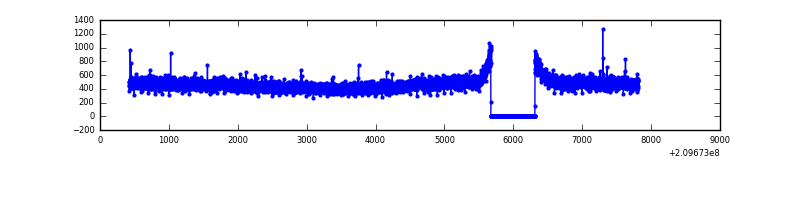 |
| D | 7385 | 6746 | 954 | 954 | 12.92% | 14.14% | 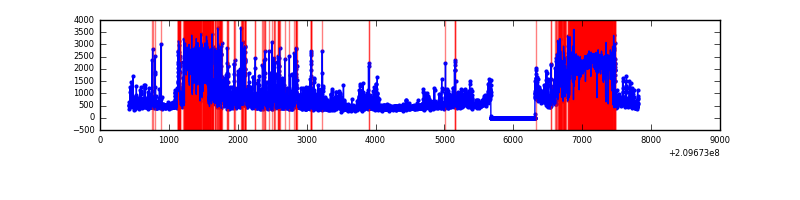 |
Top three noisy pixels from each quadrant. If the there are fewer than three noisy pixels in the level2.evt file, extra rows are filled as -1
| Pixel properties | Quadrant properties | ||||||
|---|---|---|---|---|---|---|---|
| Quadrant | DetID | PixID | Counts | Sigma | Mean | Median | Sigma |
| A | 0 | 50 | 57519 | 334.32 | 820 | 804 | 169.6 |
| A | 13 | 251 | 53843 | 312.65 | 820 | 804 | 169.6 |
| A | 8 | 15 | 19408 | 109.67 | 820 | 804 | 169.6 |
| B | 15 | 204 | 380596 | 2394.59 | 827 | 811 | 158.6 |
| B | 8 | 3 | 32014 | 196.74 | 827 | 811 | 158.6 |
| B | 15 | 255 | 16311 | 97.73 | 827 | 811 | 158.6 |
| C | 13 | 61 | 6525 | 31.04 | 796 | 802 | 184.4 |
| C | 8 | 222 | 5284 | 24.31 | 796 | 802 | 184.4 |
| C | 14 | 67 | 5226 | 24.0 | 796 | 802 | 184.4 |
| D | 1 | 52 | 2012955 | 11395.84 | 717 | 697 | 176.6 |
| D | 1 | 31 | 447268 | 2529.03 | 717 | 697 | 176.6 |
| D | 2 | 136 | 389992 | 2204.66 | 717 | 697 | 176.6 |
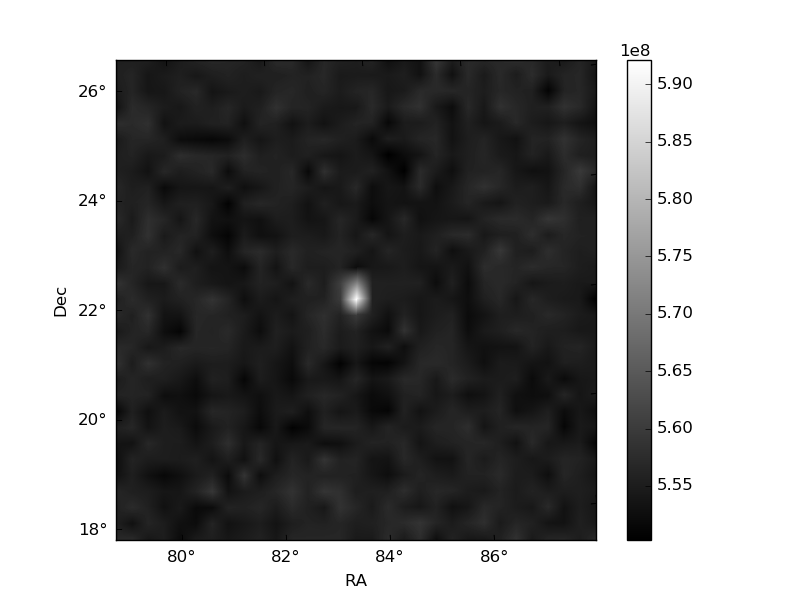
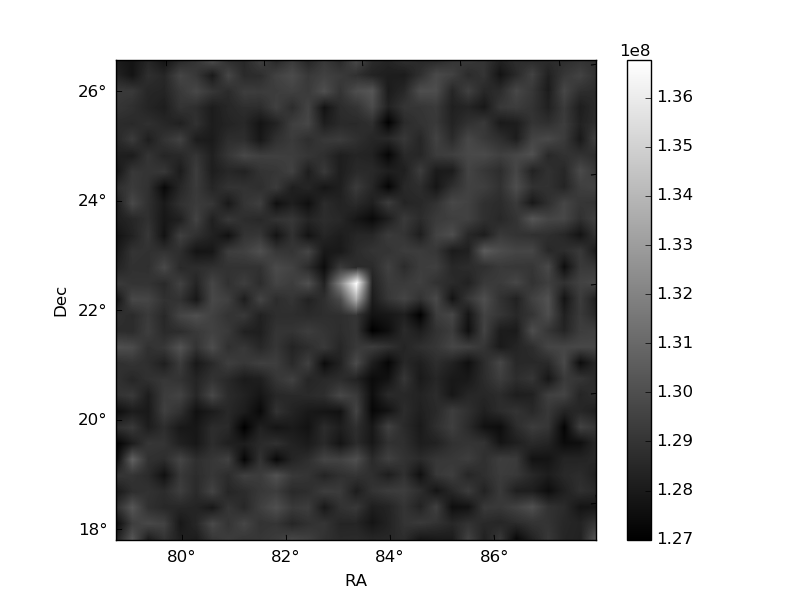
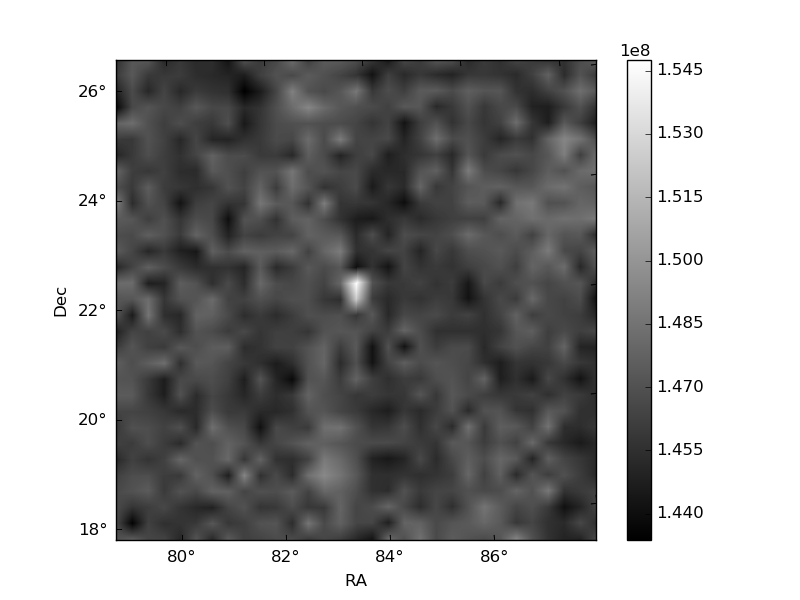
Histogram calculated using DETX and DETY for each event in the final _common_clean file
| Quadrant A | 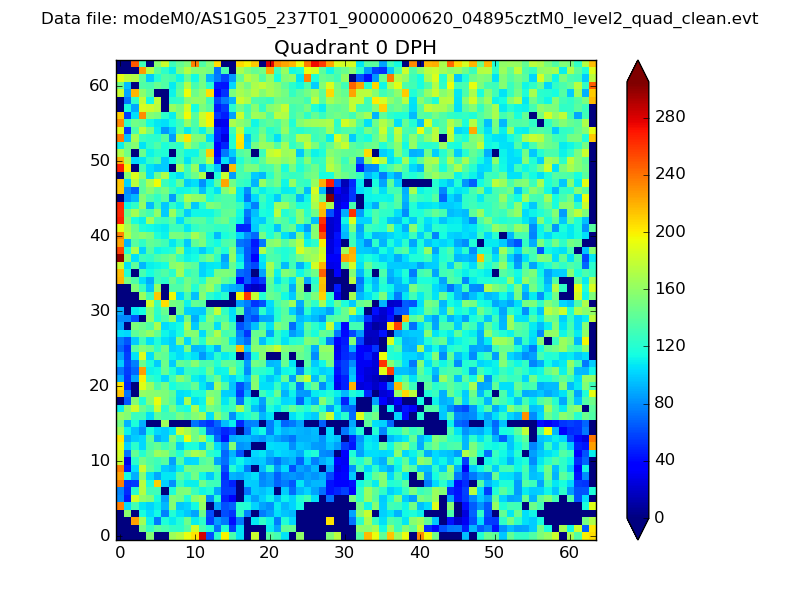 |
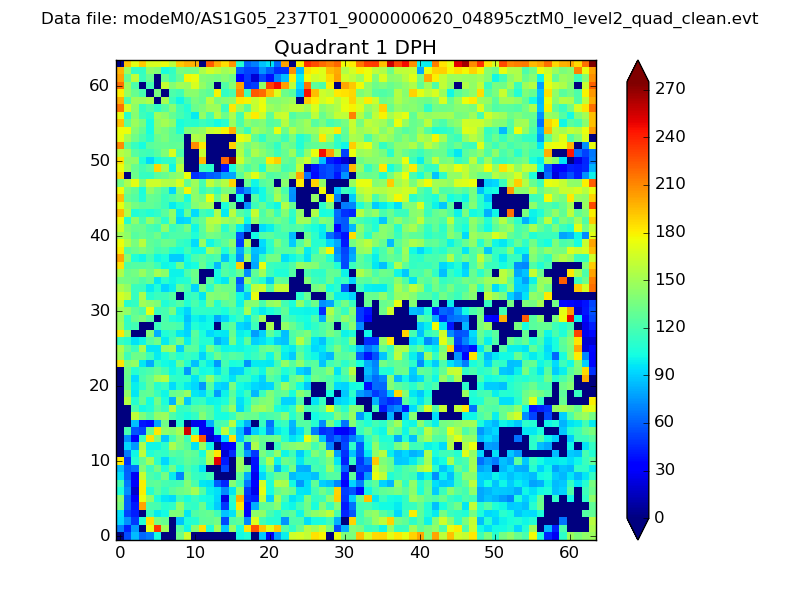 |
Quadrant B |
|---|---|---|---|
| Quadrant D | 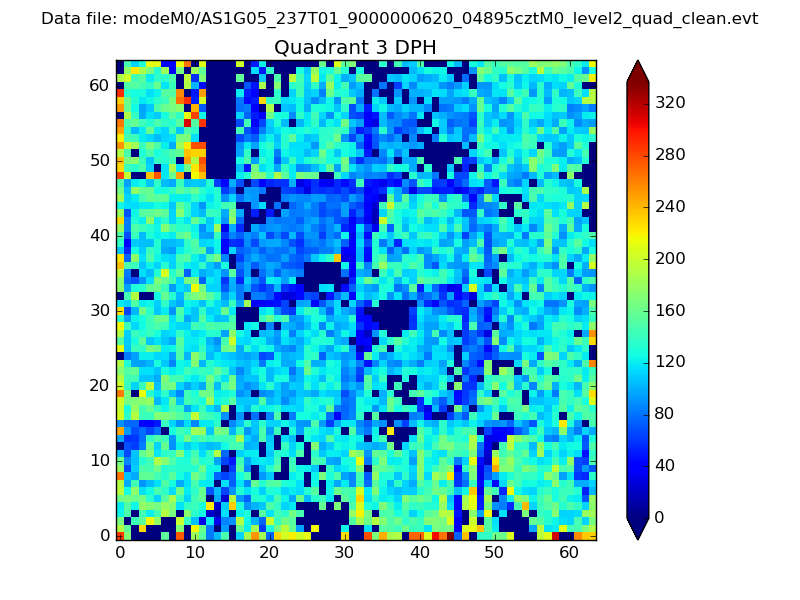 |
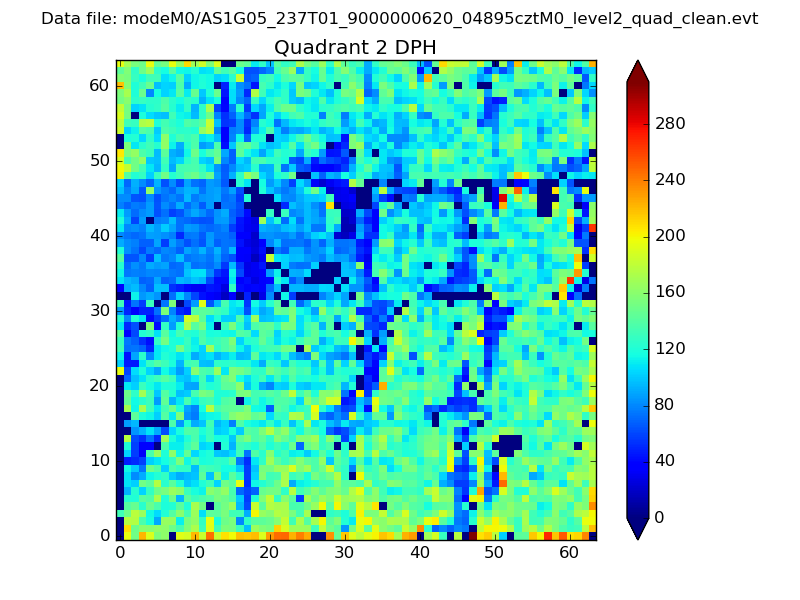 |
Quadrant C |
| Plot type | Count rate plots | Images |
|---|---|---|
| Comparison with Poisson distribution Blue bars denote a histogram of data divided into 1 sec bins. Red curve is a Poisson curve with rate = median count rate of data. |
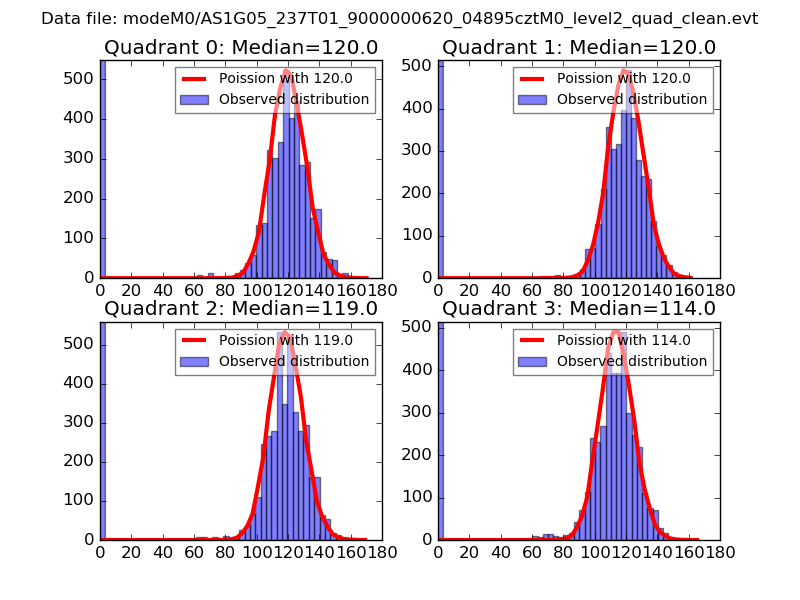 |
 |
| Quadrant-wise count rates Data is divided into 100 sec bins |
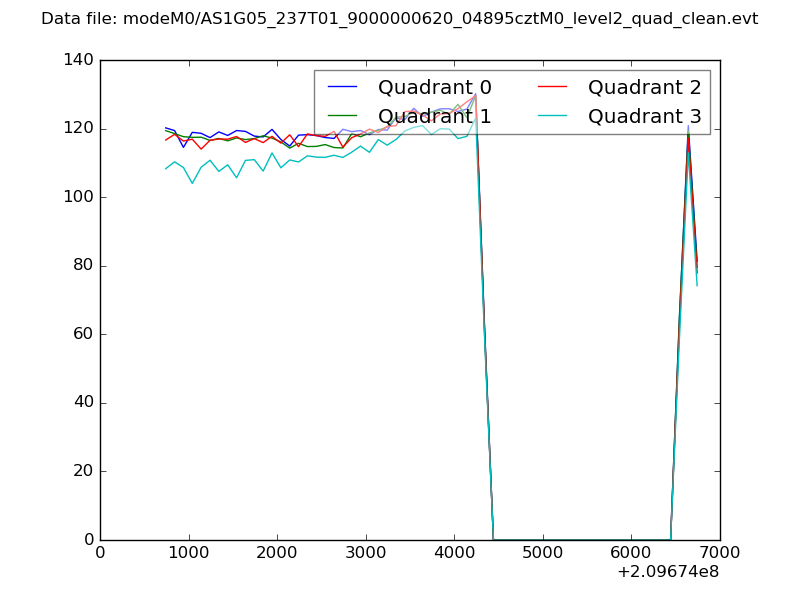 |
|
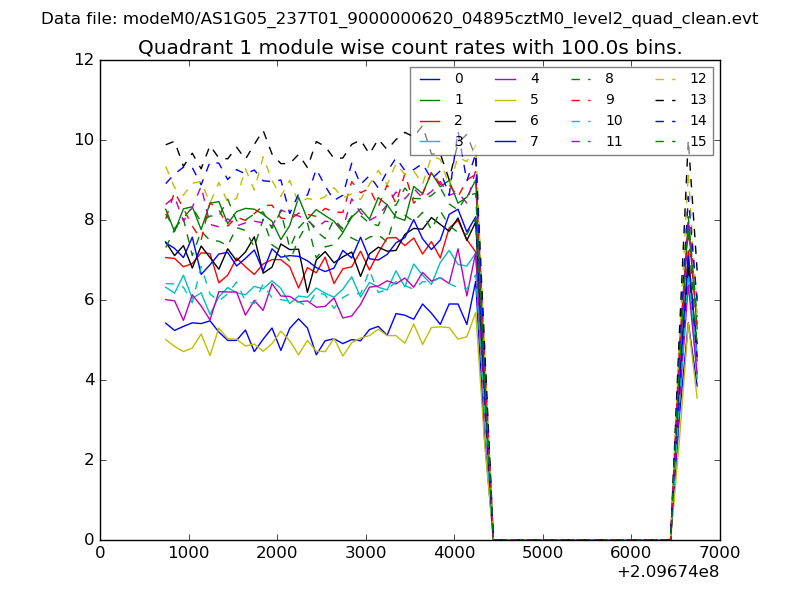
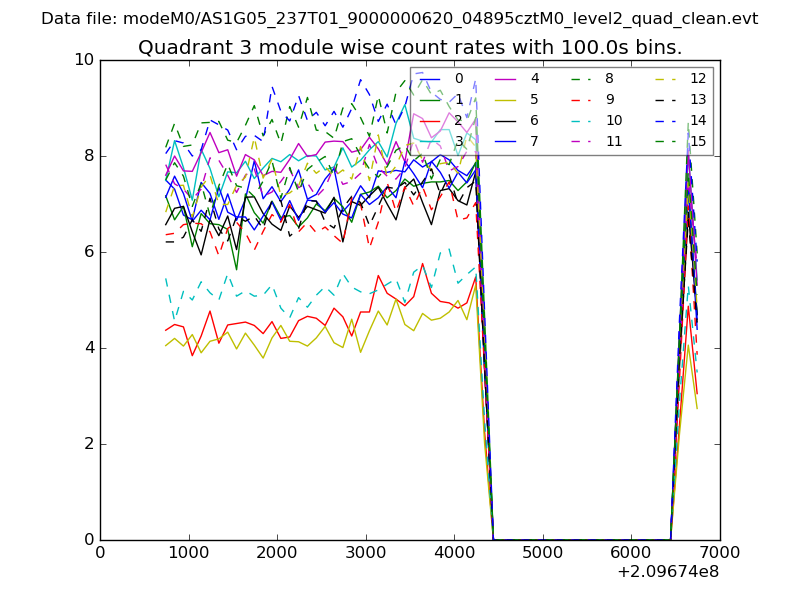
| Module-wise count rates for Quadrant A Data is divided into 100 sec bins |
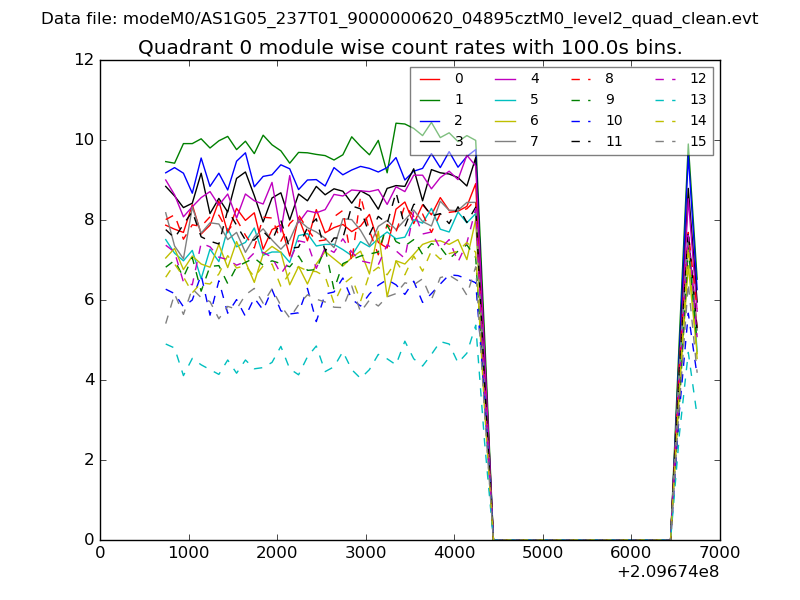 |
 |
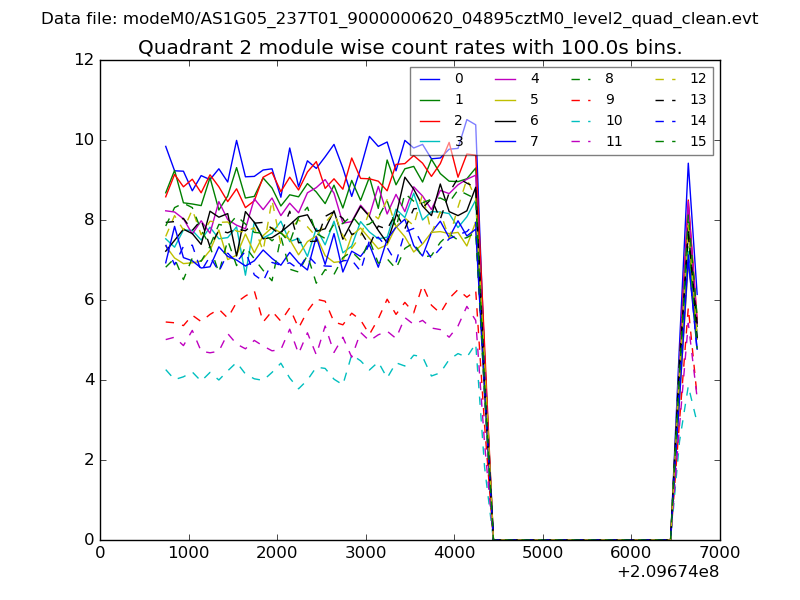
| Module-wise count rates for Quadrant B Data is divided into 100 sec bins |
 |
 |
| Module-wise count rates for Quadrant C Data is divided into 100 sec bins |
 |
 |
| Module-wise count rates for Quadrant D Data is divided into 100 sec bins |
 |
 |
| Parameter | Plot |
|---|---|
| CZT HV Monitor | 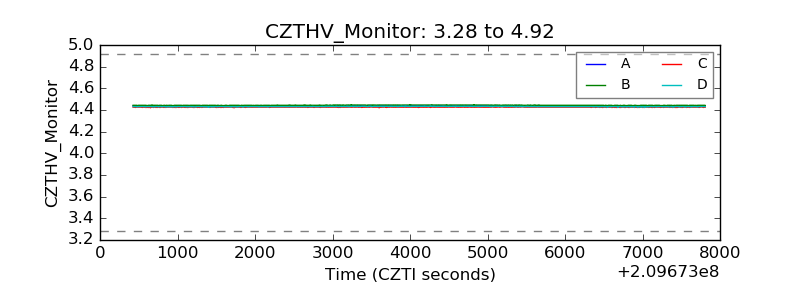 |
| D_VDD | 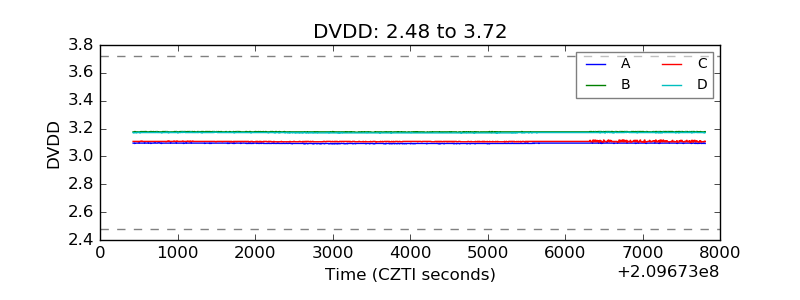 |
| Temperature 1 | 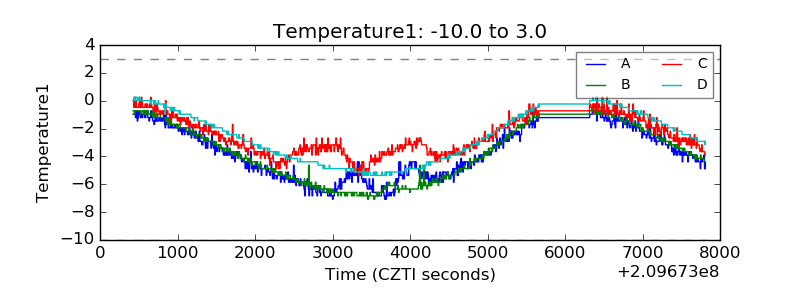 |
| Veto HV Monitor | 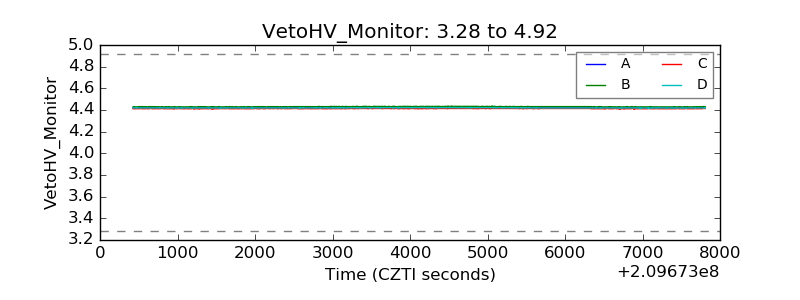 |
| Veto LLD | 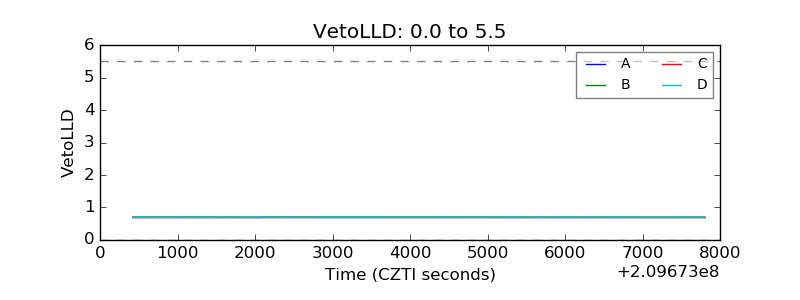 |
| Alpha Counter | 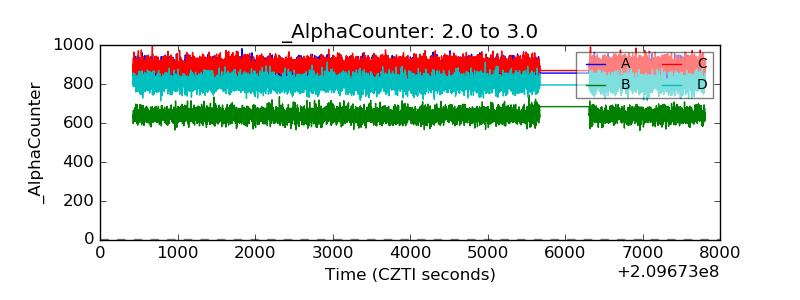 |
| _CPM_Rate | 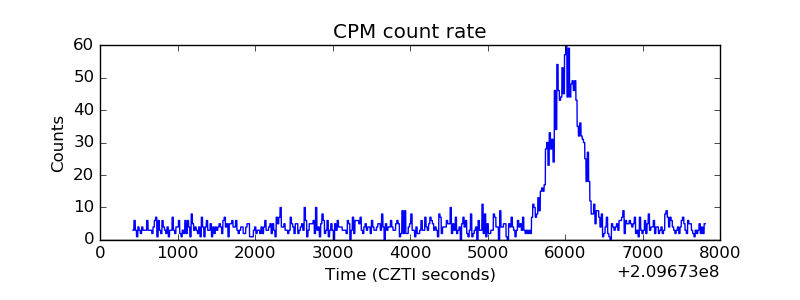 |
| CZT Counter | 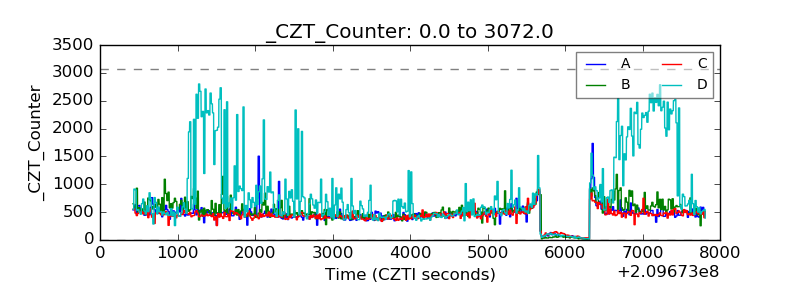 |
| +2.5 Volts monitor | 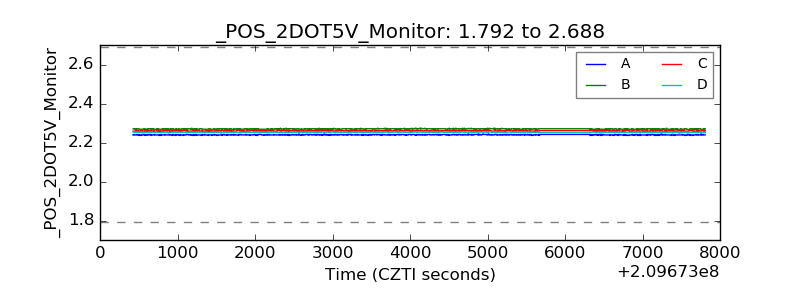 |
| +5 Volts monitor |  |
| _ROLL_ROT | 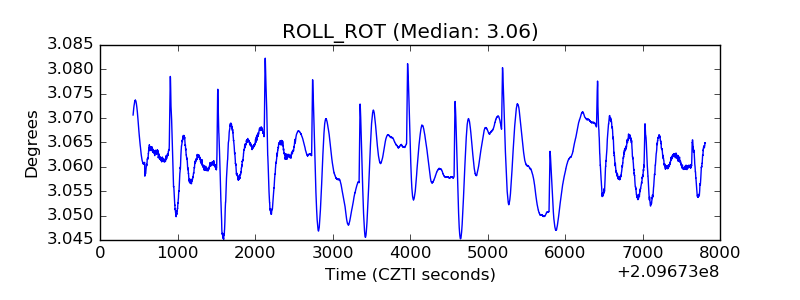 |
| _Roll_DEC | 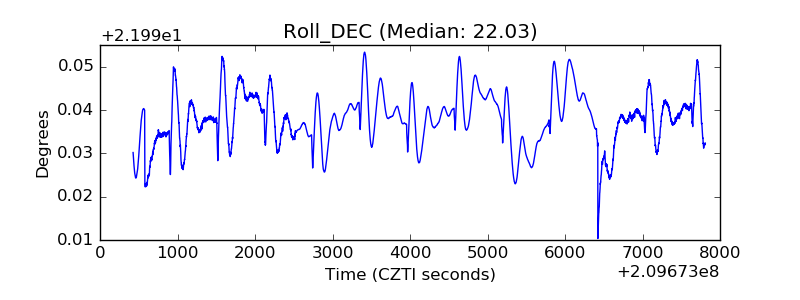 |
| _Roll_RA | 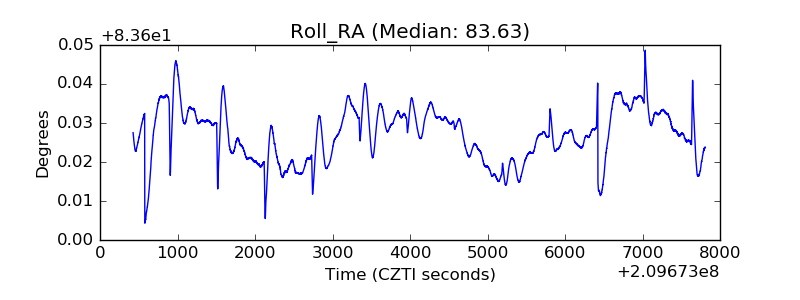 |
| Veto Counter | 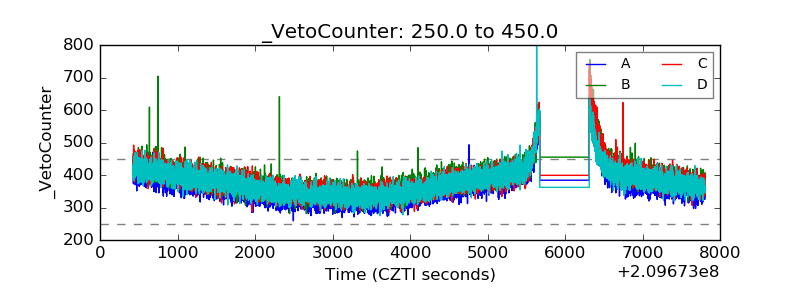 |