| Param | Original file | Final file |
|---|---|---|
| Filename | modeM0/AS1G05_237T01_9000000620_04896cztM0_level2.evt | modeM0/AS1G05_237T01_9000000620_04896cztM0_level2_quad_clean.evt |
| Size (bytes) | 646,816,320 | 82,635,840 |
| Size | 616.9 MB | 78.8 MB |
| Events in quadrant A | 3,598,117 | 509,133 |
| Events in quadrant B | 4,168,984 | 506,177 |
| Events in quadrant C | 3,445,384 | 505,019 |
| Events in quadrant D | 7,877,284 | 469,317 |
| Mode M9 | |||
|---|---|---|---|
| Quadrant | BADHDUFLAG | Total packets | Discarded packets |
| A | 0 | 3 | 0 |
| B | 0 | 3 | 0 |
| C | 0 | 3 | 0 |
| D | 0 | 3 | 0 |
| Mode SS | |||
|---|---|---|---|
| Quadrant | BADHDUFLAG | Total packets | Discarded packets |
| A | 0 | 150 | 0 |
| B | 0 | 150 | 0 |
| C | 0 | 150 | 0 |
| D | 0 | 150 | 0 |
| Mode M0 | |||
|---|---|---|---|
| Quadrant | BADHDUFLAG | Total packets | Discarded packets |
| A | 0 | 15425 | 2 |
| B | 0 | 17150 | 1 |
| C | 0 | 15084 | 1 |
| D | 0 | 28612 | 1 |
| Quadrant | Total seconds | Saturated seconds | Saturation percentage |
|---|---|---|---|
| A | 7362 | 65 | 0.882912% |
| B | 7362 | 130 | 1.765825% |
| C | 7362 | 46 | 0.624830% |
| D | 7362 | 1604 | 21.787558% |
Noise dominated data is calculated using 1-second bins in cleaned event files. If a bin has >2000 counts, and if more than 50% of those come from <1% of pixels, then it is considered to be noise-dominated and hence unusable.
| Quadrant | # 1 sec bins | Bins with >0 counts | Bins with >2000 counts | High rate bins dominated by noise | Noise dominated (total time) | Noise dominated (detector-on time) | Marked lightcurve |
|---|---|---|---|---|---|---|---|
| A | 7607 | 7363 | 3 | 3 | 0.04% | 0.04% | 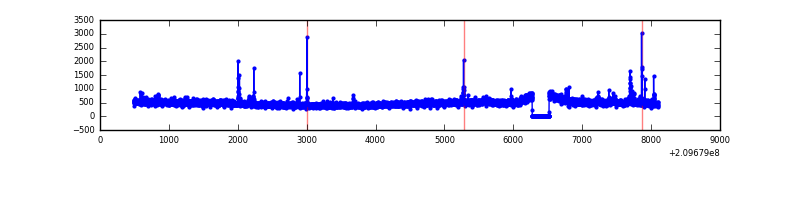 |
| B | 7607 | 7363 | 12 | 12 | 0.16% | 0.16% | 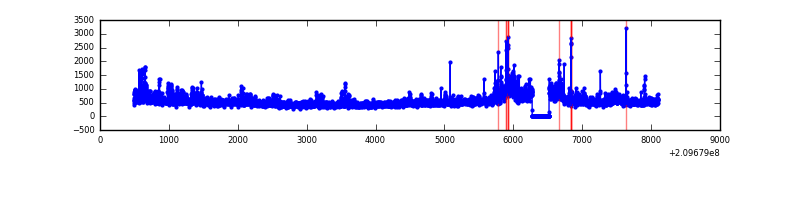 |
| C | 7607 | 7363 | 0 | 0 | 0.00% | 0.00% | 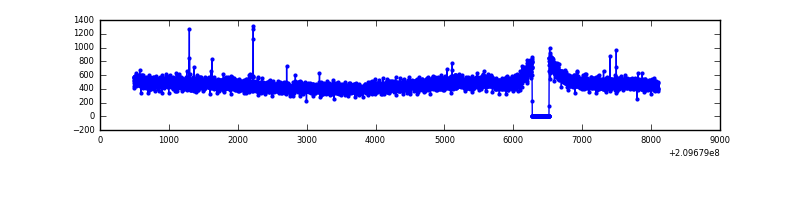 |
| D | 7607 | 7362 | 1193 | 1193 | 15.68% | 16.20% | 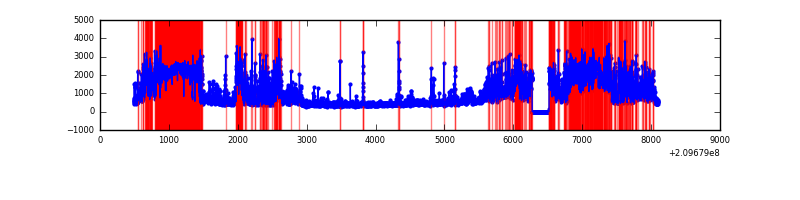 |
Top three noisy pixels from each quadrant. If the there are fewer than three noisy pixels in the level2.evt file, extra rows are filled as -1
| Pixel properties | Quadrant properties | ||||||
|---|---|---|---|---|---|---|---|
| Quadrant | DetID | PixID | Counts | Sigma | Mean | Median | Sigma |
| A | 0 | 50 | 72789 | 388.48 | 898 | 881 | 185.1 |
| A | 13 | 251 | 22911 | 119.01 | 898 | 881 | 185.1 |
| A | 15 | 31 | 12674 | 63.71 | 898 | 881 | 185.1 |
| B | 15 | 204 | 265729 | 1526.58 | 904 | 885 | 173.5 |
| B | 0 | 219 | 129772 | 742.91 | 904 | 885 | 173.5 |
| B | 4 | 80 | 81667 | 465.63 | 904 | 885 | 173.5 |
| C | 8 | 128 | 13420 | 61.88 | 871 | 879 | 202.7 |
| C | 1 | 16 | 8887 | 39.52 | 871 | 879 | 202.7 |
| C | 14 | 67 | 8096 | 35.61 | 871 | 879 | 202.7 |
| D | 1 | 52 | 1564953 | 8020.1 | 772 | 747 | 195.0 |
| D | 2 | 63 | 1536764 | 7875.57 | 772 | 747 | 195.0 |
| D | 2 | 234 | 329858 | 1687.44 | 772 | 747 | 195.0 |
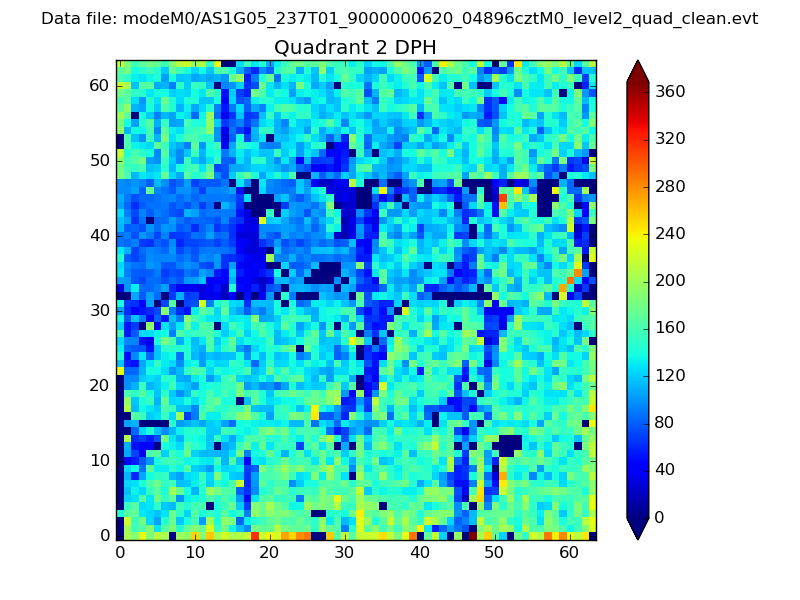
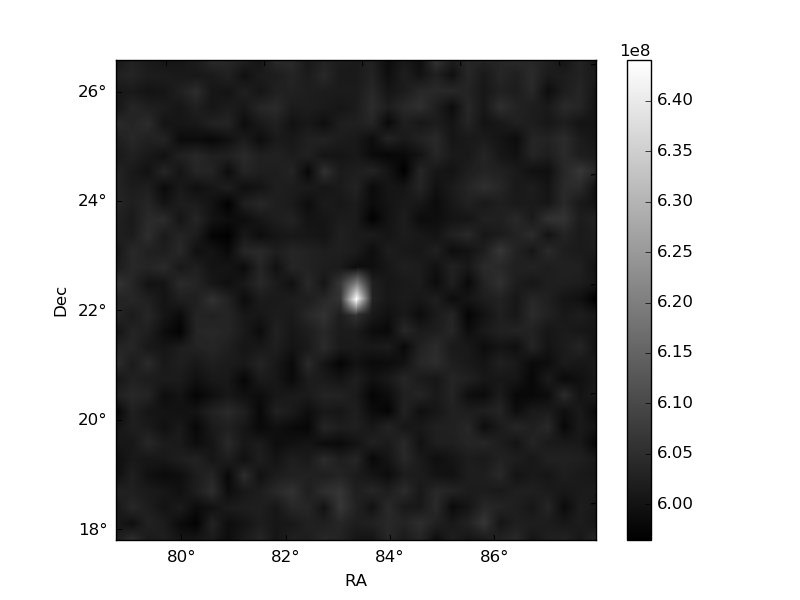
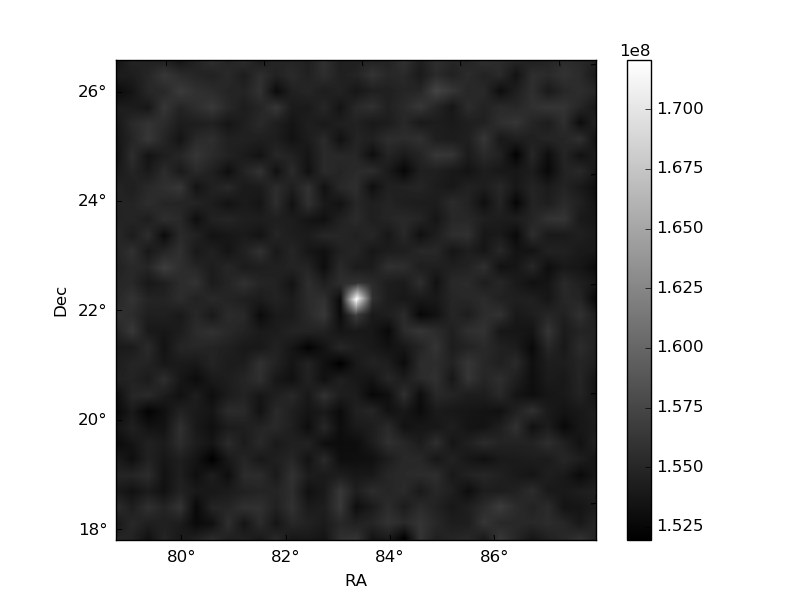
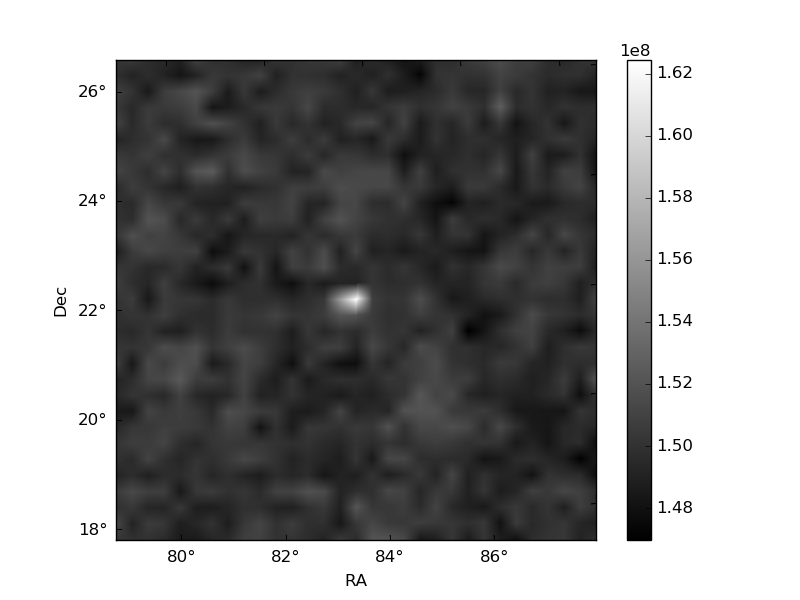
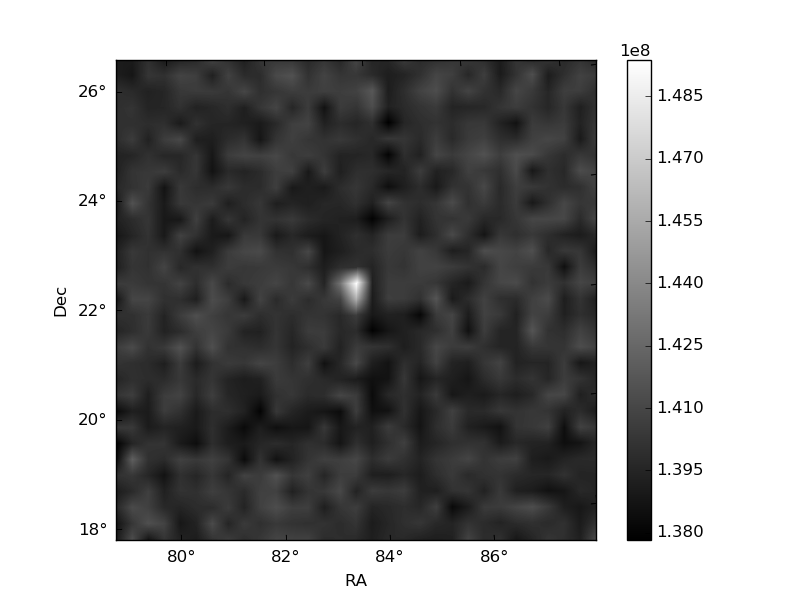
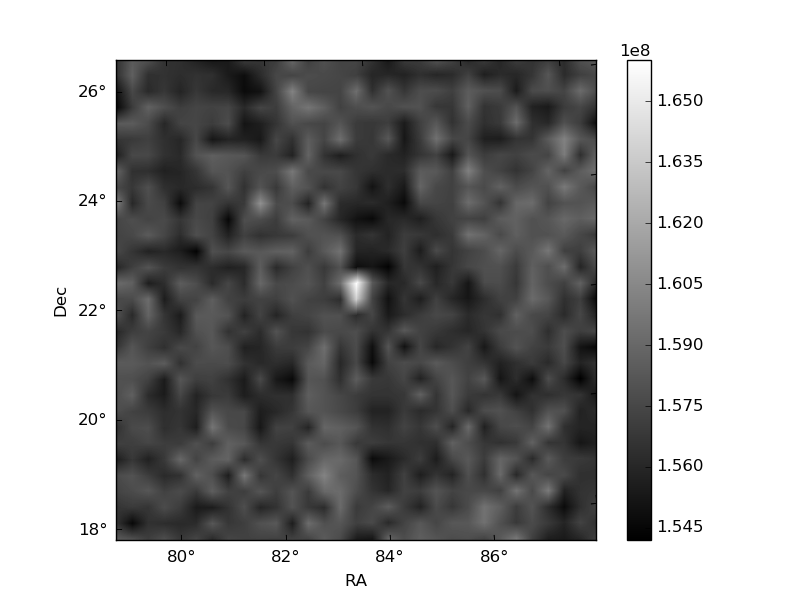
Histogram calculated using DETX and DETY for each event in the final _common_clean file
| Quadrant A | 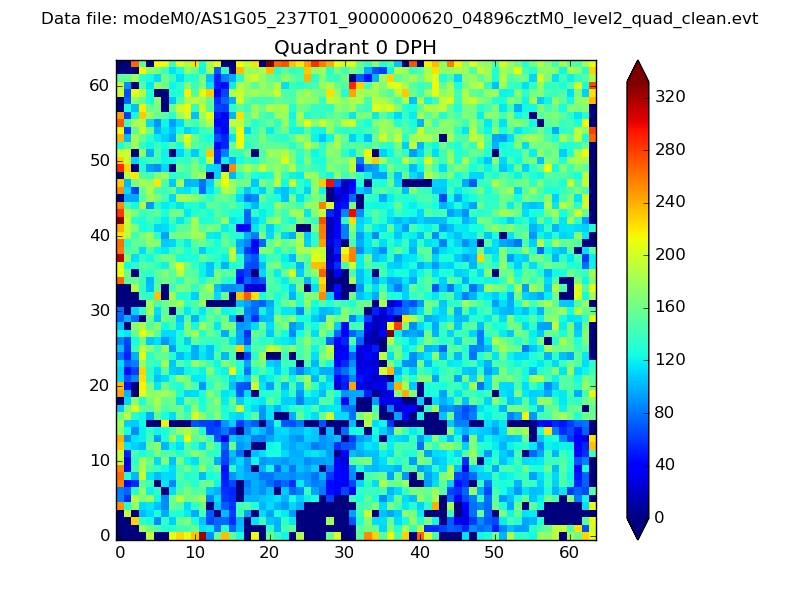 |
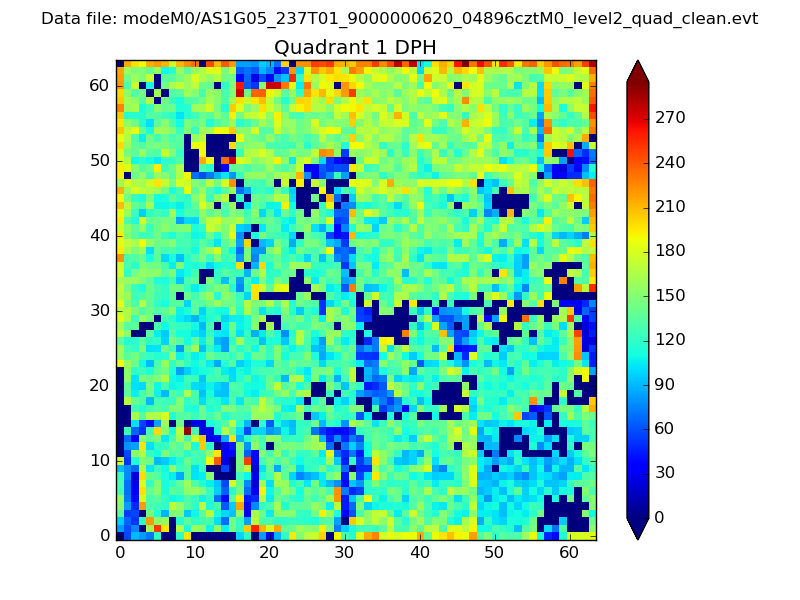 |
Quadrant B |
|---|---|---|---|
| Quadrant D | 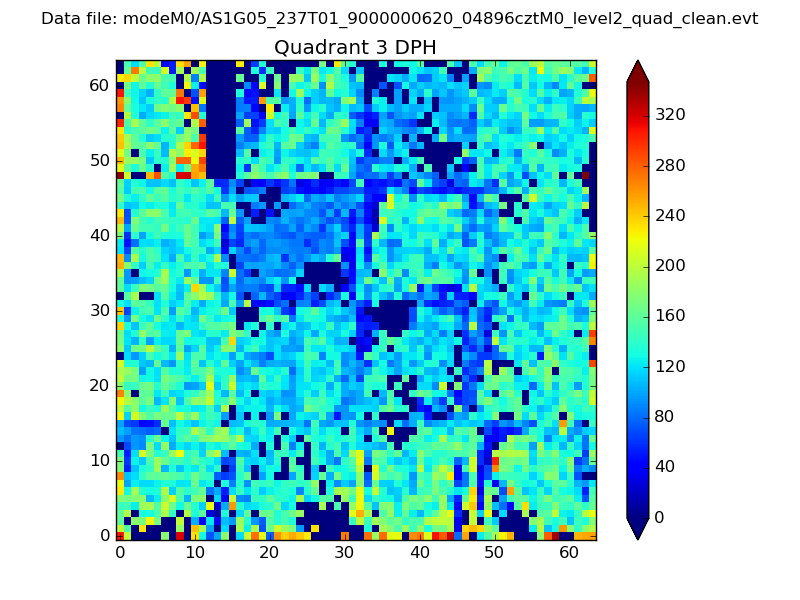 |
 |
Quadrant C |
| Plot type | Count rate plots | Images |
|---|---|---|
| Comparison with Poisson distribution Blue bars denote a histogram of data divided into 1 sec bins. Red curve is a Poisson curve with rate = median count rate of data. |
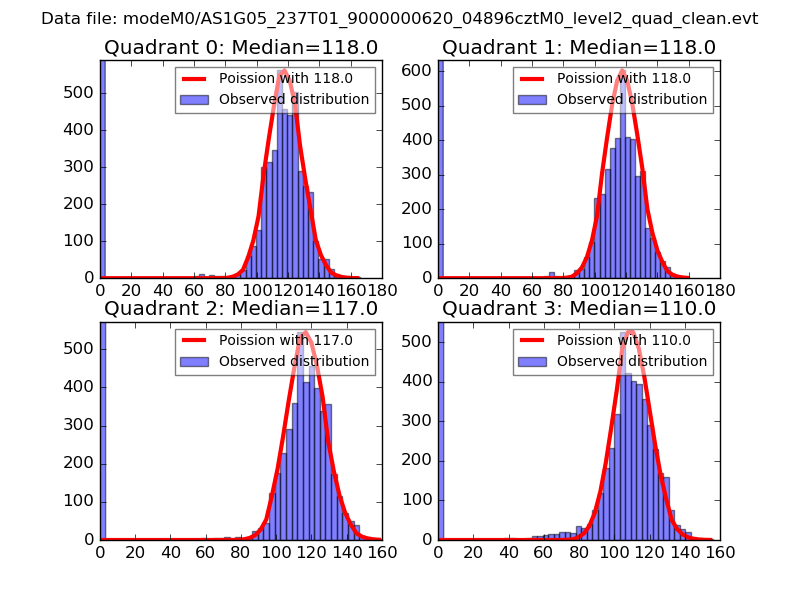 |
 |
| Quadrant-wise count rates Data is divided into 100 sec bins |
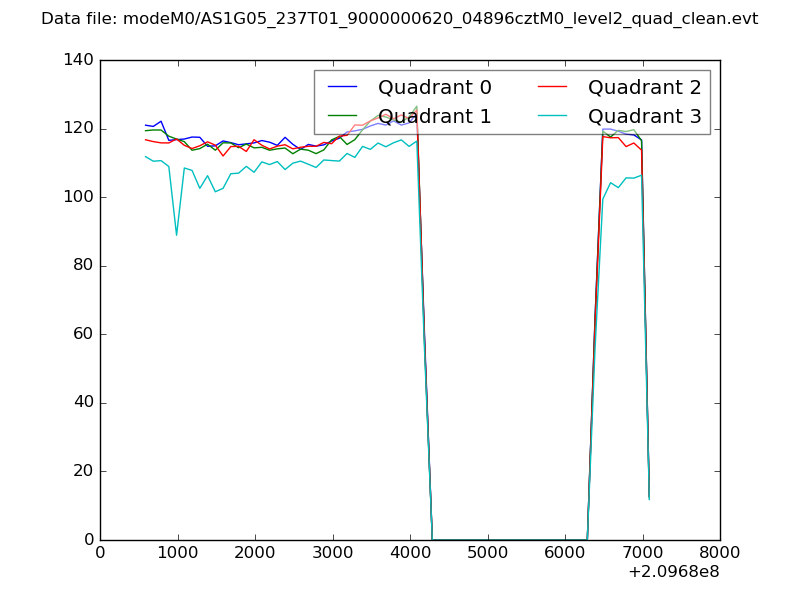 |
|
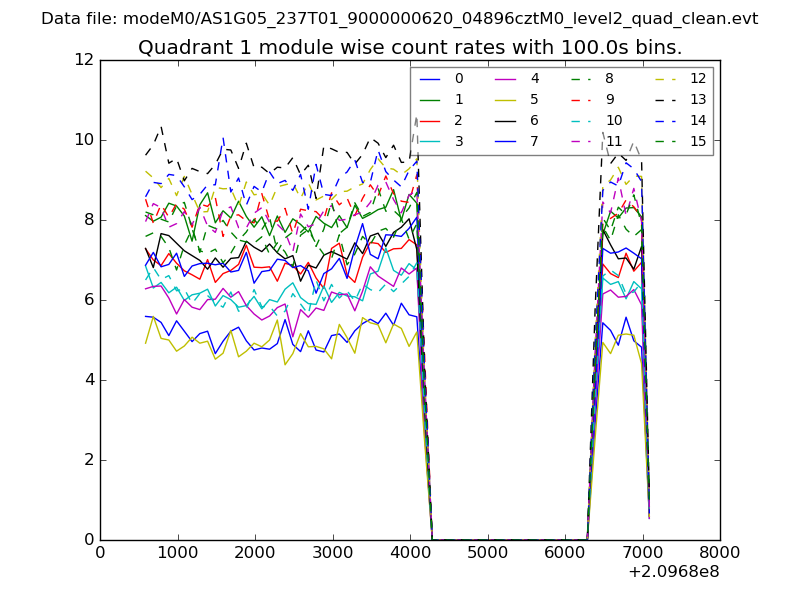
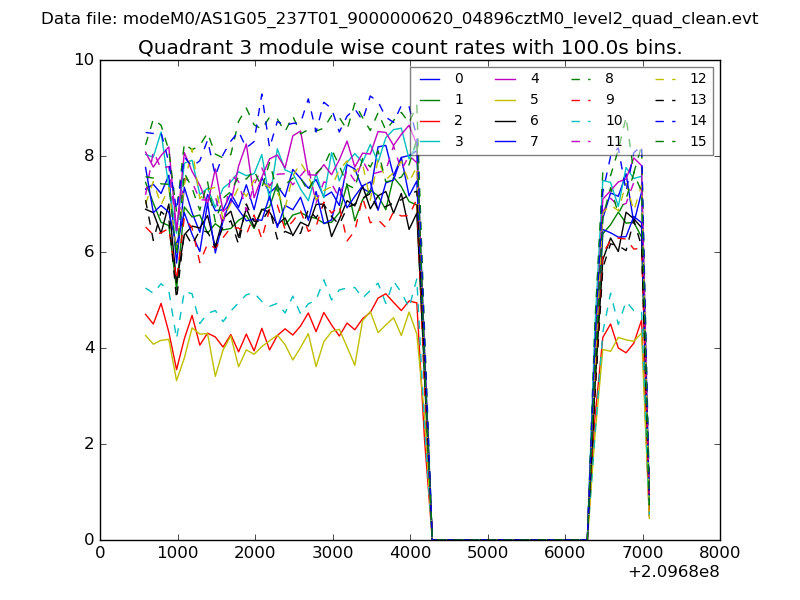
| Module-wise count rates for Quadrant A Data is divided into 100 sec bins |
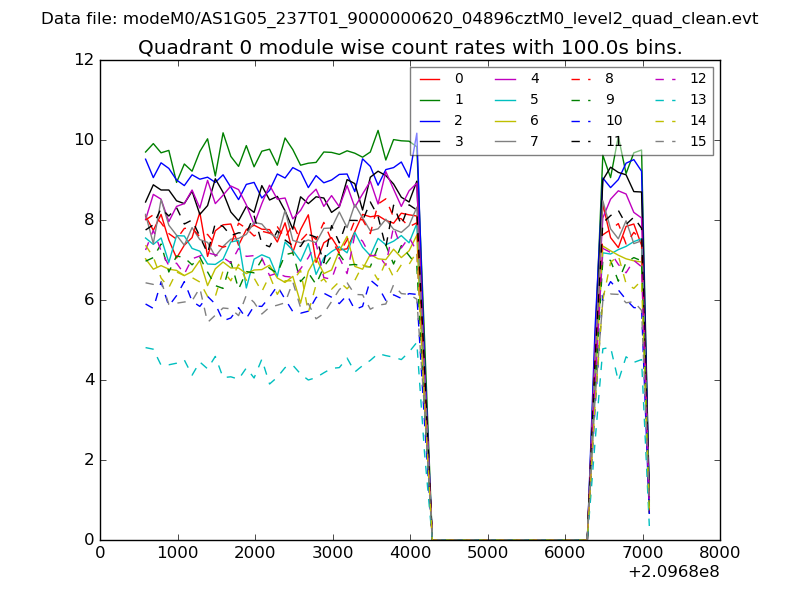 |
 |
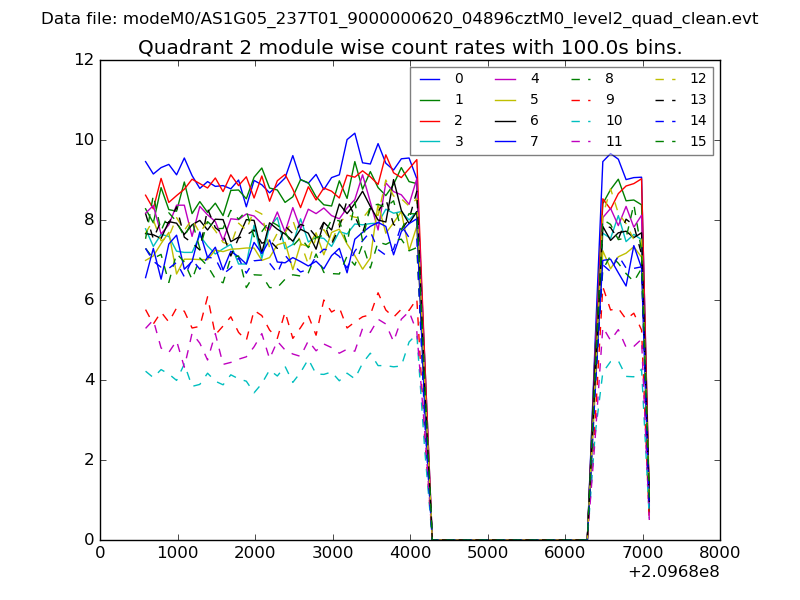
| Module-wise count rates for Quadrant B Data is divided into 100 sec bins |
 |
 |
| Module-wise count rates for Quadrant C Data is divided into 100 sec bins |
 |
 |
| Module-wise count rates for Quadrant D Data is divided into 100 sec bins |
 |
 |
| Parameter | Plot |
|---|---|
| CZT HV Monitor | 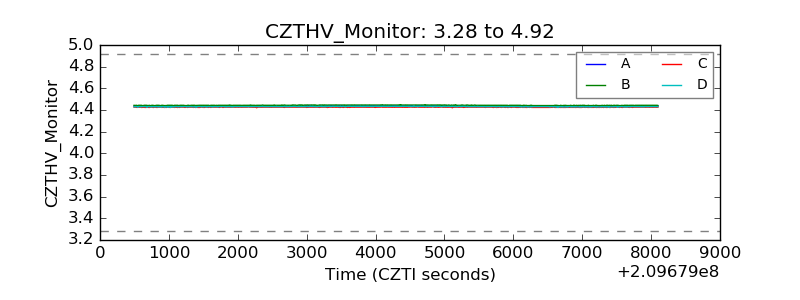 |
| D_VDD | 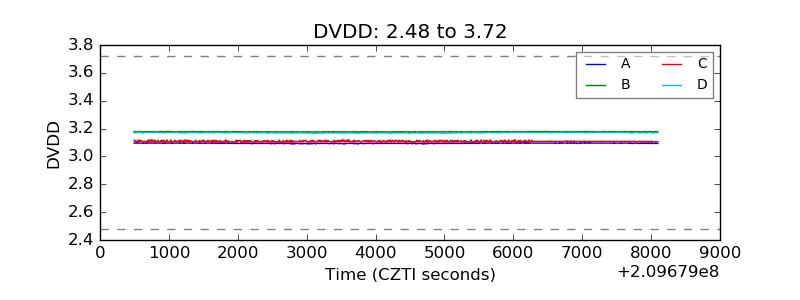 |
| Temperature 1 | 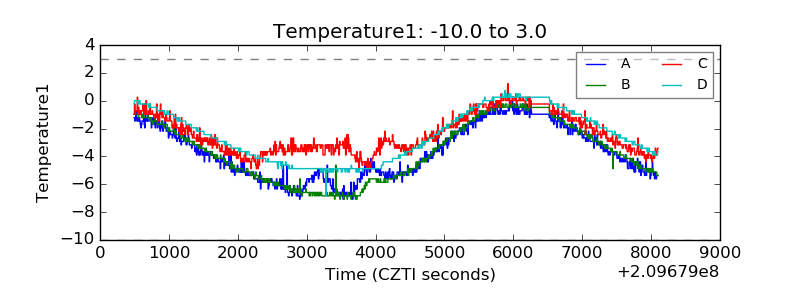 |
| Veto HV Monitor | 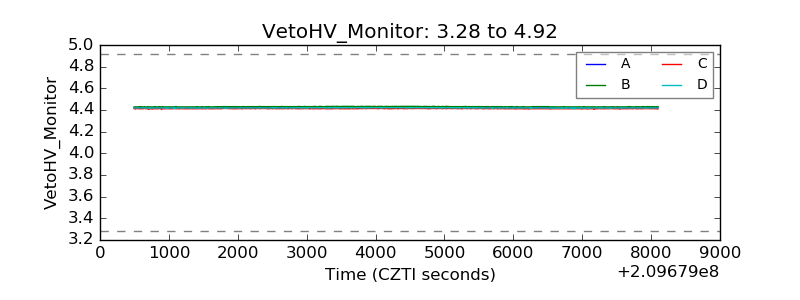 |
| Veto LLD | 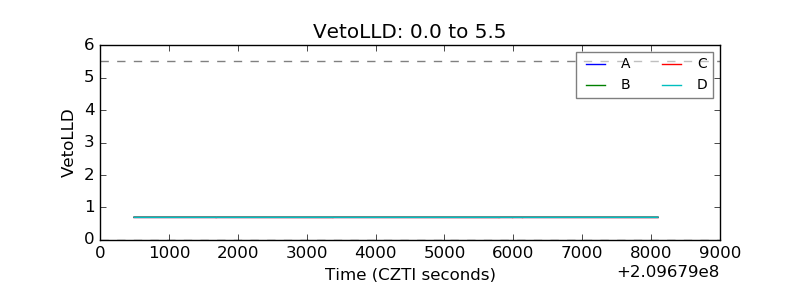 |
| Alpha Counter | 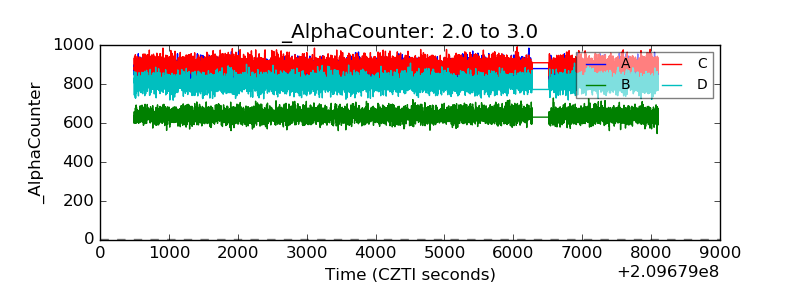 |
| _CPM_Rate | 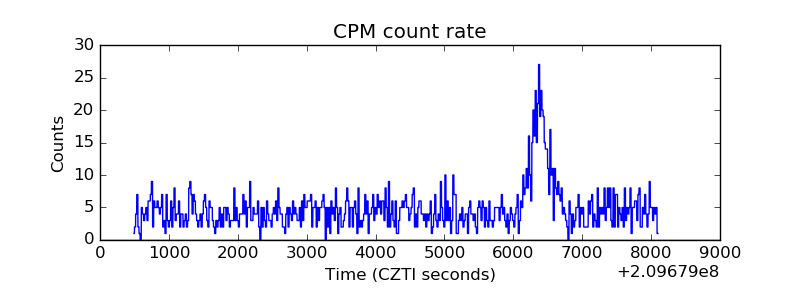 |
| CZT Counter |  |
| +2.5 Volts monitor | 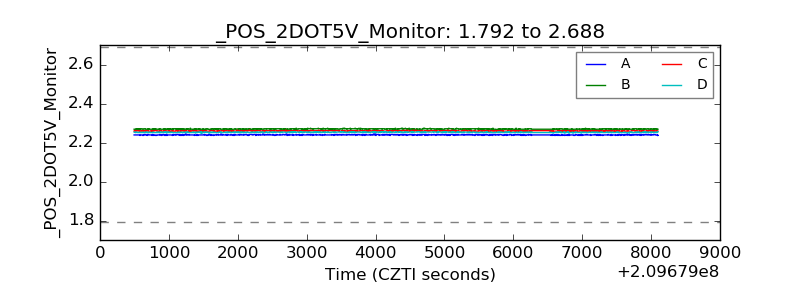 |
| +5 Volts monitor |  |
| _ROLL_ROT |  |
| _Roll_DEC | 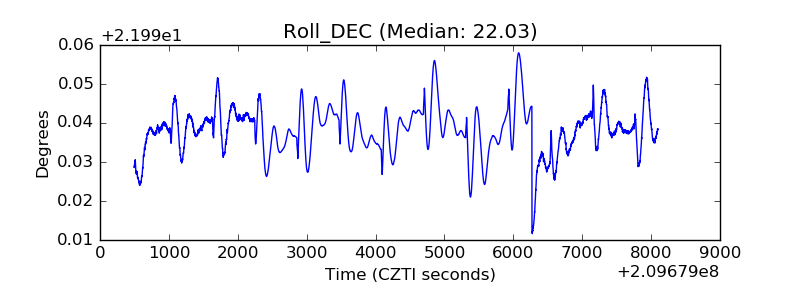 |
| _Roll_RA | 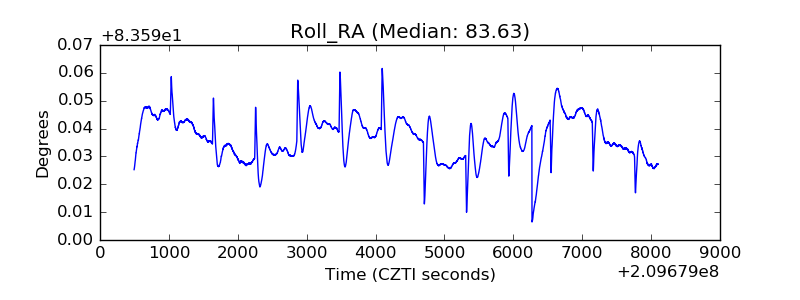 |
| Veto Counter |  |