| Param | Original file | Final file |
|---|---|---|
| Filename | modeM0/AS1G05_237T01_9000000620_04897cztM0_level2.evt | modeM0/AS1G05_237T01_9000000620_04897cztM0_level2_quad_clean.evt |
| Size (bytes) | 646,643,520 | 87,163,200 |
| Size | 616.7 MB | 83.1 MB |
| Events in quadrant A | 3,418,986 | 567,993 |
| Events in quadrant B | 3,592,404 | 563,354 |
| Events in quadrant C | 3,191,105 | 560,753 |
| Events in quadrant D | 8,913,448 | 465,715 |
| Mode M9 | |||
|---|---|---|---|
| Quadrant | BADHDUFLAG | Total packets | Discarded packets |
| A | 0 | 2 | 0 |
| B | 0 | 2 | 0 |
| C | 0 | 2 | 0 |
| D | 0 | 2 | 0 |
| Mode SS | |||
|---|---|---|---|
| Quadrant | BADHDUFLAG | Total packets | Discarded packets |
| A | 0 | 140 | 0 |
| B | 0 | 140 | 0 |
| C | 0 | 140 | 0 |
| D | 0 | 140 | 0 |
| Mode M0 | |||
|---|---|---|---|
| Quadrant | BADHDUFLAG | Total packets | Discarded packets |
| A | 0 | 14868 | 8 |
| B | 0 | 15264 | 4 |
| C | 0 | 14260 | 3 |
| D | 0 | 31265 | 1 |
| Quadrant | Total seconds | Saturated seconds | Saturation percentage |
|---|---|---|---|
| A | 6902 | 48 | 0.695451% |
| B | 6904 | 49 | 0.709733% |
| C | 6904 | 24 | 0.347625% |
| D | 6905 | 2108 | 30.528602% |
Noise dominated data is calculated using 1-second bins in cleaned event files. If a bin has >2000 counts, and if more than 50% of those come from <1% of pixels, then it is considered to be noise-dominated and hence unusable.
| Quadrant | # 1 sec bins | Bins with >0 counts | Bins with >2000 counts | High rate bins dominated by noise | Noise dominated (total time) | Noise dominated (detector-on time) | Marked lightcurve |
|---|---|---|---|---|---|---|---|
| A | 7165 | 6906 | 4 | 4 | 0.06% | 0.06% | 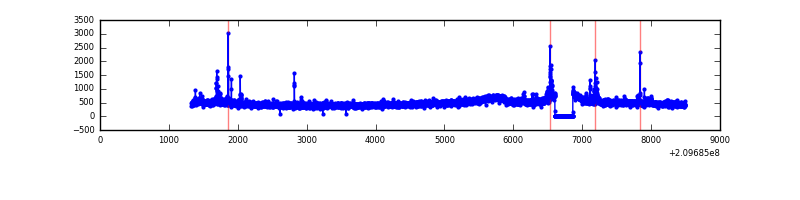 |
| B | 7165 | 6906 | 4 | 4 | 0.06% | 0.06% | 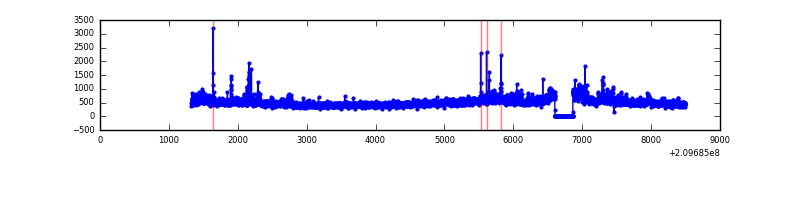 |
| C | 7165 | 6906 | 0 | 0 | 0.00% | 0.00% | 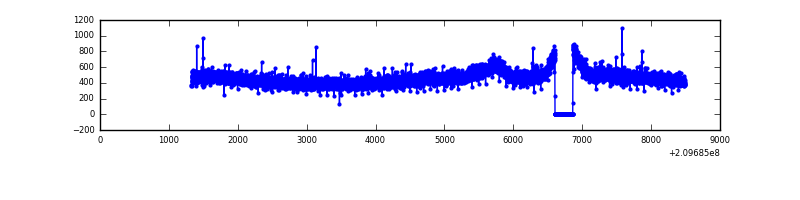 |
| D | 7165 | 6905 | 1880 | 1880 | 26.24% | 27.23% | 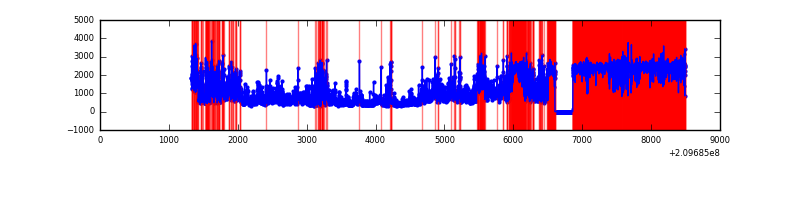 |
Top three noisy pixels from each quadrant. If the there are fewer than three noisy pixels in the level2.evt file, extra rows are filled as -1
| Pixel properties | Quadrant properties | ||||||
|---|---|---|---|---|---|---|---|
| Quadrant | DetID | PixID | Counts | Sigma | Mean | Median | Sigma |
| A | 0 | 50 | 98071 | 561.69 | 841 | 826 | 173.1 |
| A | 13 | 14 | 28898 | 162.15 | 841 | 826 | 173.1 |
| A | 13 | 251 | 17776 | 97.9 | 841 | 826 | 173.1 |
| B | 15 | 204 | 170852 | 1034.08 | 843 | 826 | 164.4 |
| B | 0 | 219 | 37006 | 220.04 | 843 | 826 | 164.4 |
| B | 15 | 54 | 27288 | 160.94 | 843 | 826 | 164.4 |
| C | 13 | 61 | 6630 | 30.37 | 813 | 821 | 191.3 |
| C | 12 | 4 | 4761 | 20.6 | 813 | 821 | 191.3 |
| C | 1 | 16 | 4565 | 19.57 | 813 | 821 | 191.3 |
| D | 2 | 63 | 4594457 | 26683.52 | 684 | 665 | 172.2 |
| D | 2 | 234 | 333408 | 1932.77 | 684 | 665 | 172.2 |
| D | 1 | 52 | 298891 | 1732.28 | 684 | 665 | 172.2 |
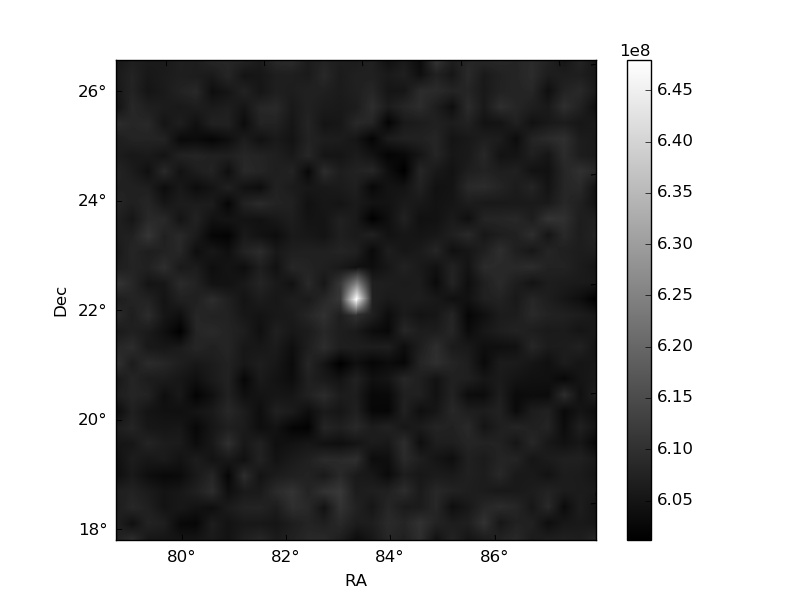
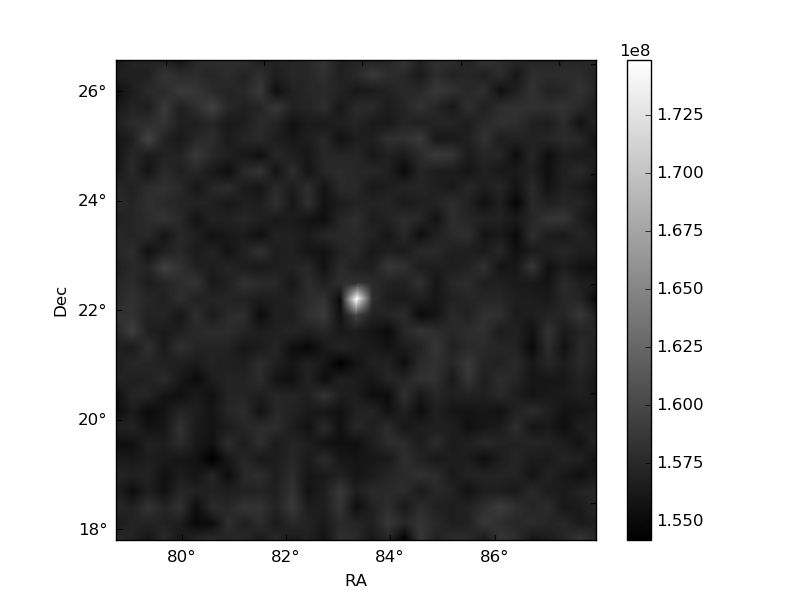
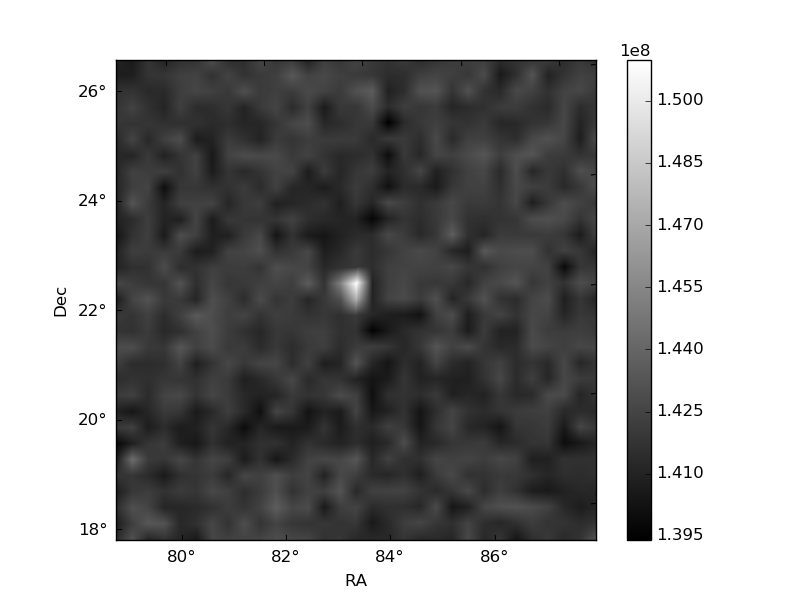
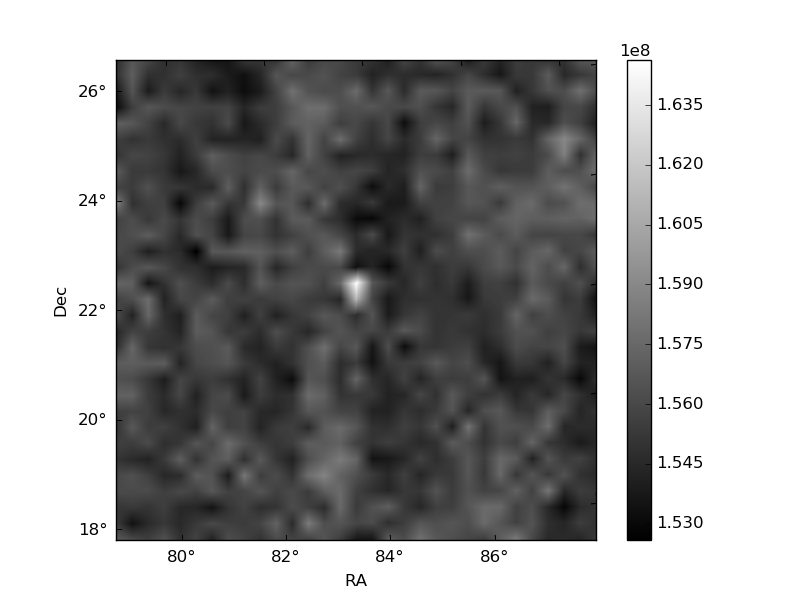
Histogram calculated using DETX and DETY for each event in the final _common_clean file
| Quadrant A | 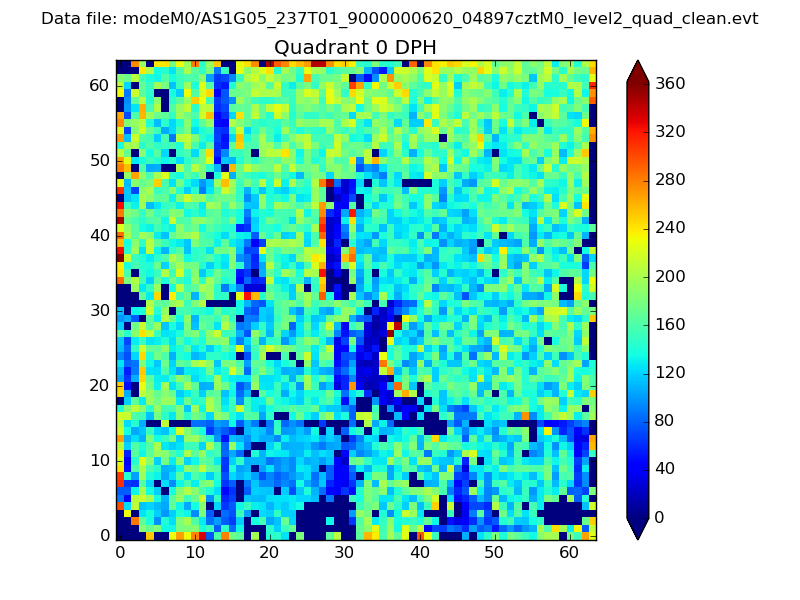 |
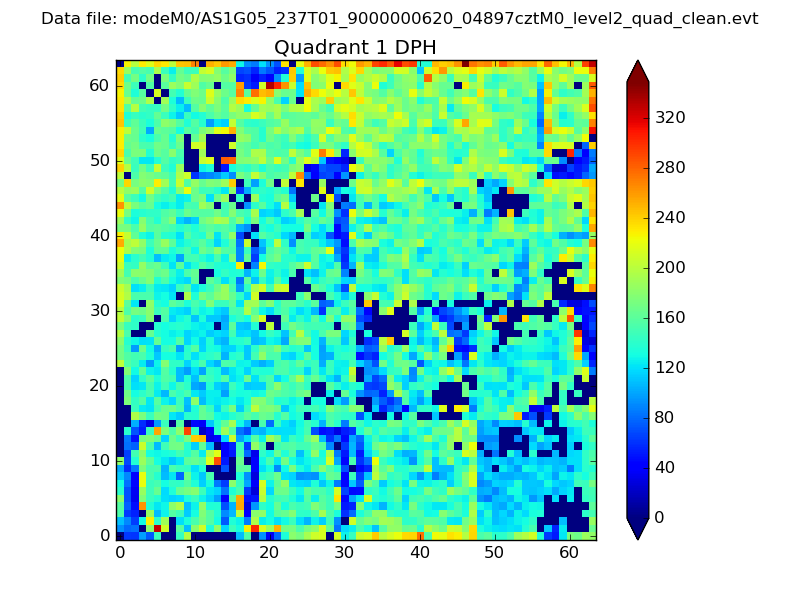 |
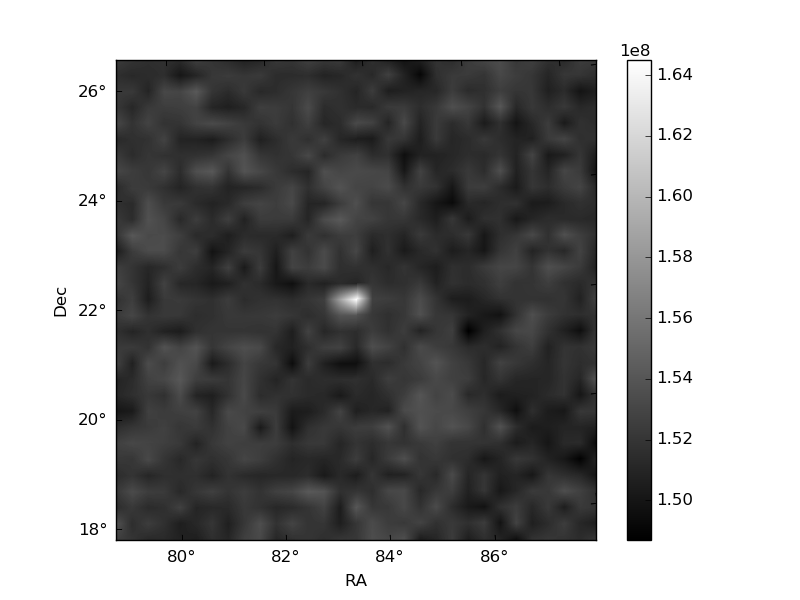
Quadrant B |
|---|---|---|---|
| Quadrant D | 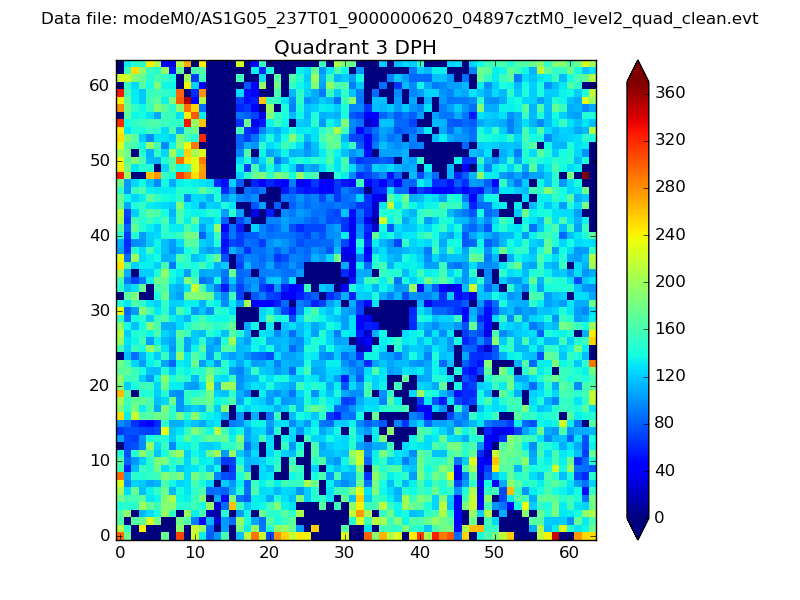 |
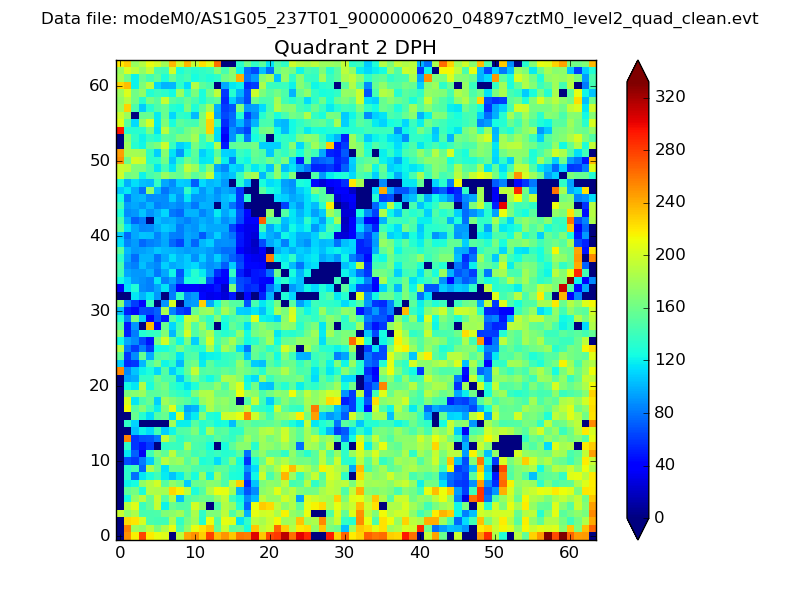 |
Quadrant C |
| Plot type | Count rate plots | Images |
|---|---|---|
| Comparison with Poisson distribution Blue bars denote a histogram of data divided into 1 sec bins. Red curve is a Poisson curve with rate = median count rate of data. |
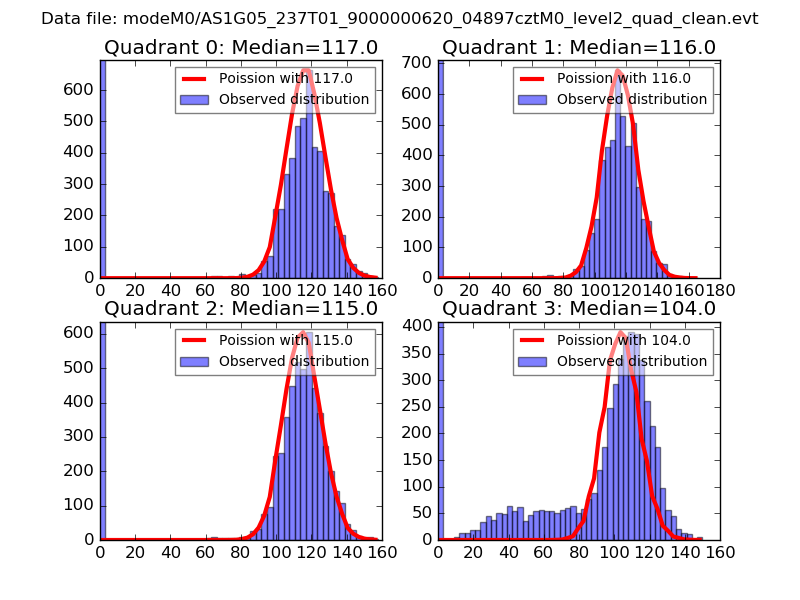 |
 |
| Quadrant-wise count rates Data is divided into 100 sec bins |
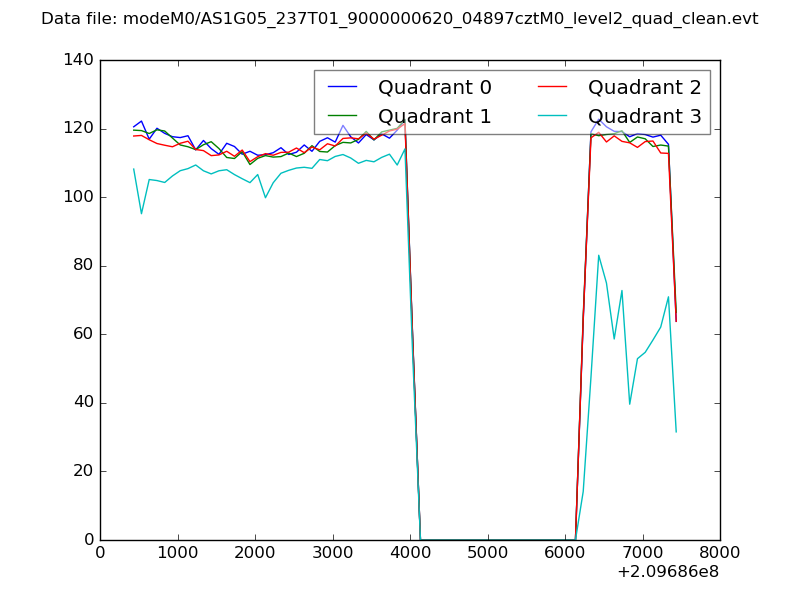 |
|
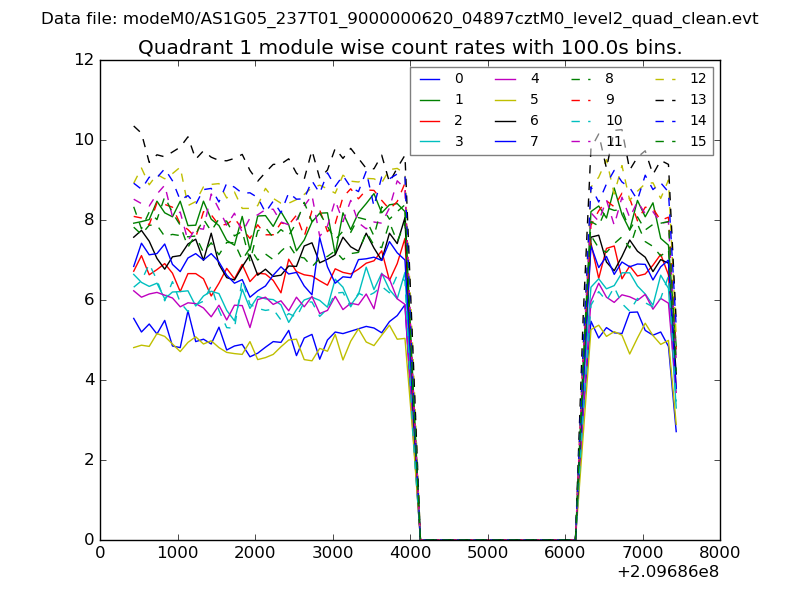
| Module-wise count rates for Quadrant A Data is divided into 100 sec bins |
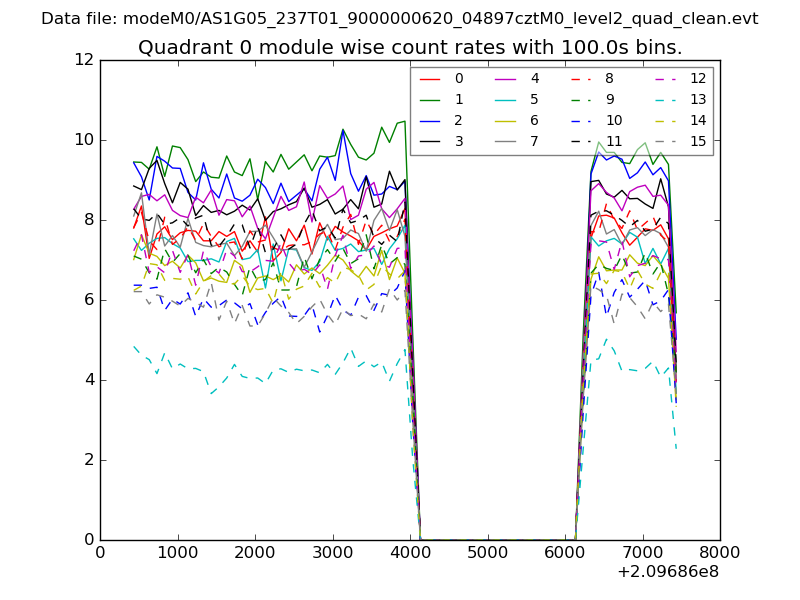 |
 |
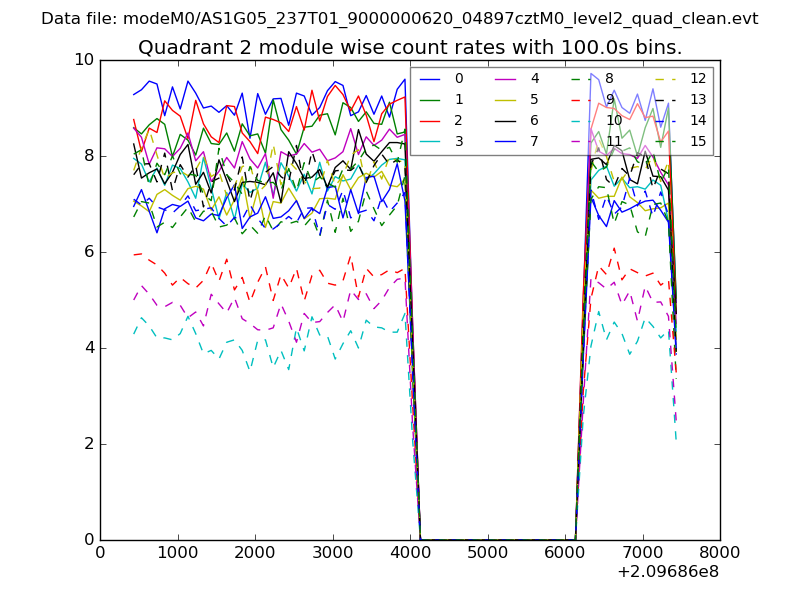
| Module-wise count rates for Quadrant B Data is divided into 100 sec bins |
 |
 |
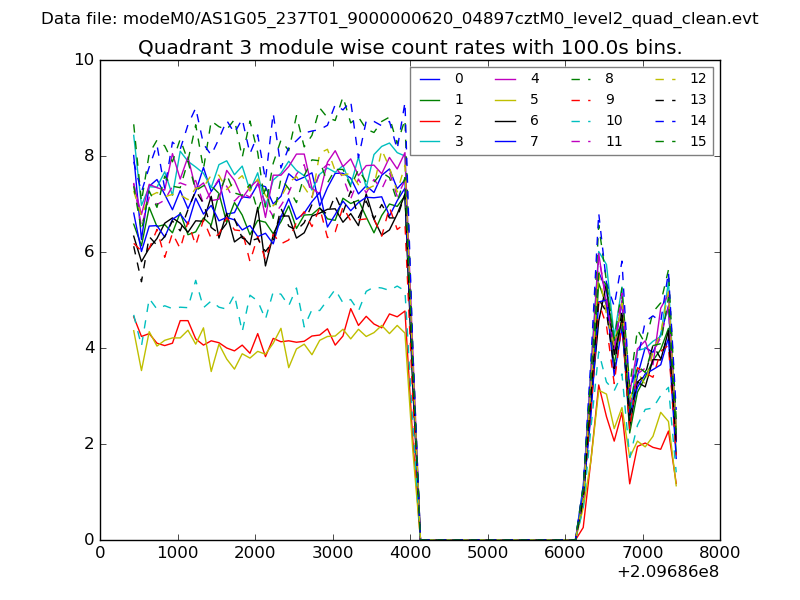
| Module-wise count rates for Quadrant C Data is divided into 100 sec bins |
 |
 |
| Module-wise count rates for Quadrant D Data is divided into 100 sec bins |
 |
 |
| Parameter | Plot |
|---|---|
| CZT HV Monitor | 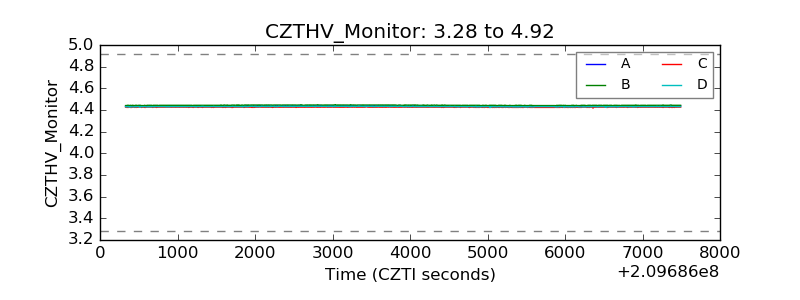 |
| D_VDD | 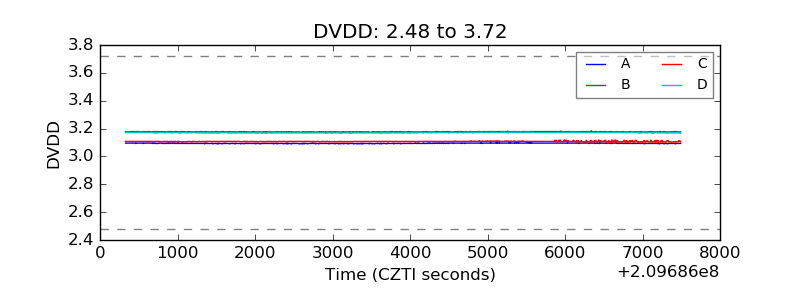 |
| Temperature 1 | 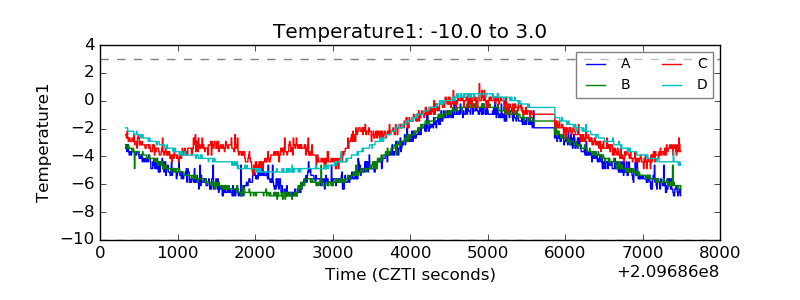 |
| Veto HV Monitor | 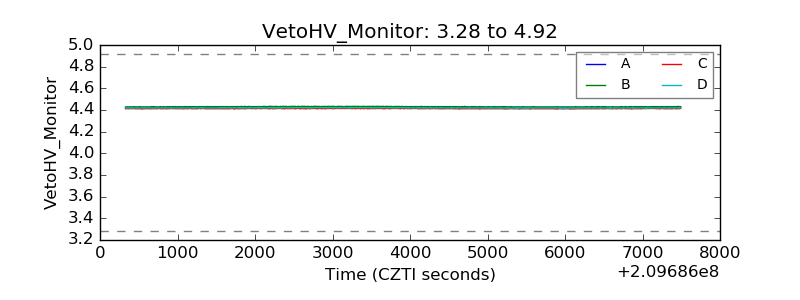 |
| Veto LLD | 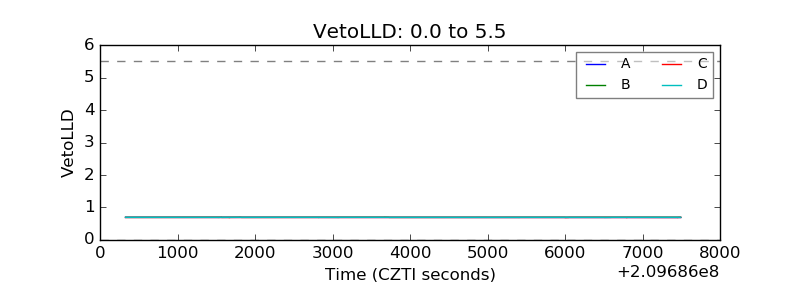 |
| Alpha Counter | 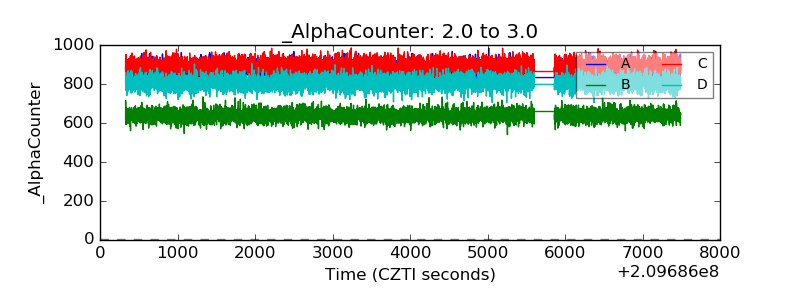 |
| _CPM_Rate | 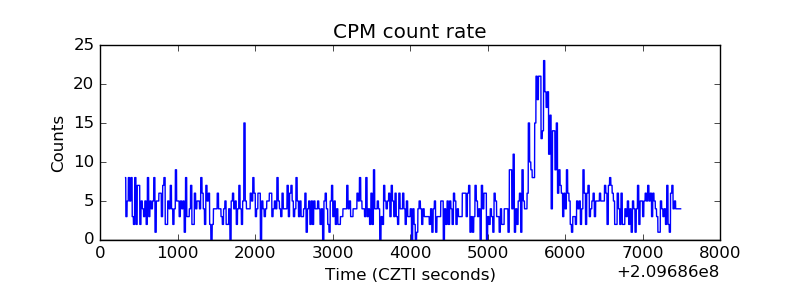 |
| CZT Counter | 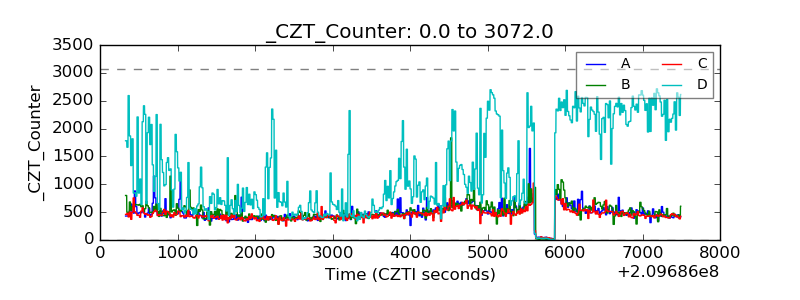 |
| +2.5 Volts monitor |  |
| +5 Volts monitor | 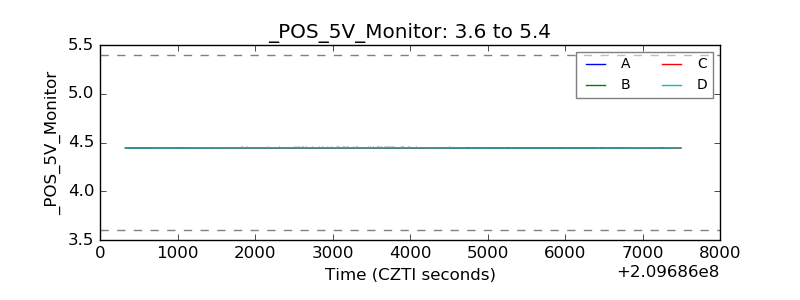 |
| _ROLL_ROT | 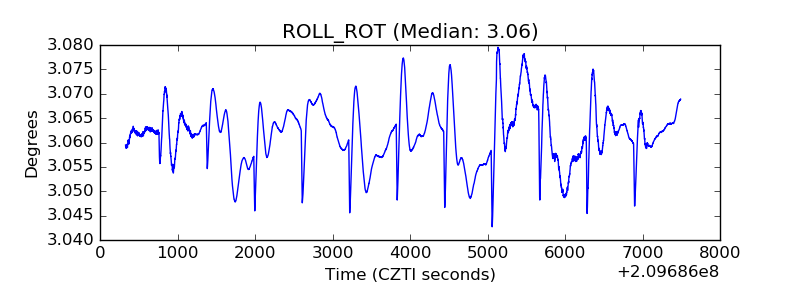 |
| _Roll_DEC | 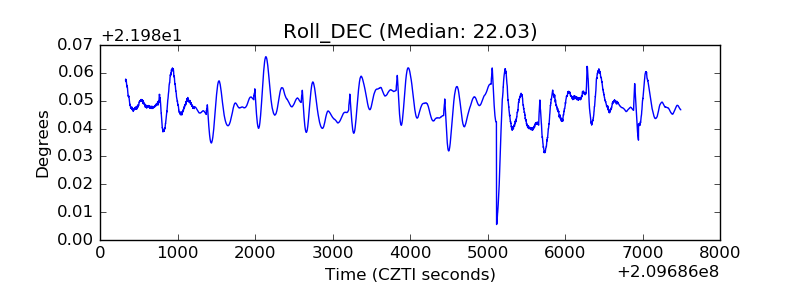 |
| _Roll_RA | 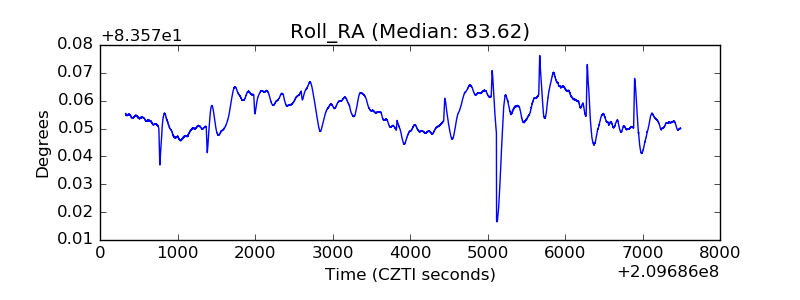 |
| Veto Counter | 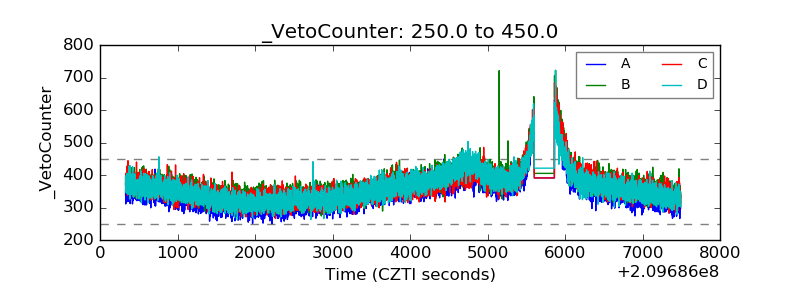 |