| Param | Original file | Final file |
|---|---|---|
| Filename | modeM0/AS1G05_237T01_9000000620_04898cztM0_level2.evt | modeM0/AS1G05_237T01_9000000620_04898cztM0_level2_quad_clean.evt |
| Size (bytes) | 524,111,040 | 51,871,680 |
| Size | 499.8 MB | 49.5 MB |
| Events in quadrant A | 2,305,038 | 364,496 |
| Events in quadrant B | 2,293,956 | 362,944 |
| Events in quadrant C | 2,100,085 | 361,817 |
| Events in quadrant D | 8,869,219 | 165,402 |
| Mode SS | |||
|---|---|---|---|
| Quadrant | BADHDUFLAG | Total packets | Discarded packets |
| A | 0 | 98 | 2 |
| B | 0 | 98 | 8 |
| C | 0 | 98 | 14 |
| D | 0 | 98 | 8 |
| Mode M0 | |||
|---|---|---|---|
| Quadrant | BADHDUFLAG | Total packets | Discarded packets |
| A | 0 | 10732 | 625 |
| B | 0 | 10633 | 647 |
| C | 0 | 10194 | 610 |
| D | 0 | 35698 | 6673 |
| Quadrant | Total seconds | Saturated seconds | Saturation percentage |
|---|---|---|---|
| A | 4628 | 21 | 0.453760% |
| B | 4612 | 11 | 0.238508% |
| C | 4617 | 1 | 0.021659% |
| D | 4016 | 3494 | 87.001992% |
Noise dominated data is calculated using 1-second bins in cleaned event files. If a bin has >2000 counts, and if more than 50% of those come from <1% of pixels, then it is considered to be noise-dominated and hence unusable.
| Quadrant | # 1 sec bins | Bins with >0 counts | Bins with >2000 counts | High rate bins dominated by noise | Noise dominated (total time) | Noise dominated (detector-on time) | Marked lightcurve |
|---|---|---|---|---|---|---|---|
| A | 4920 | 4888 | 13 | 13 | 0.26% | 0.27% | 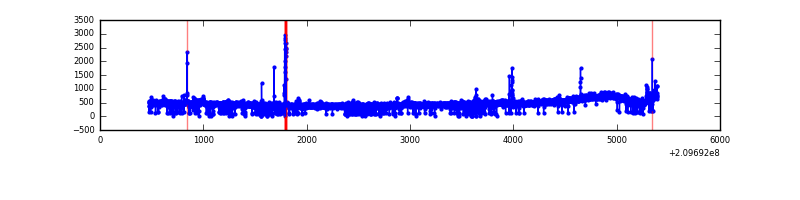 |
| B | 4920 | 4880 | 2 | 2 | 0.04% | 0.04% | 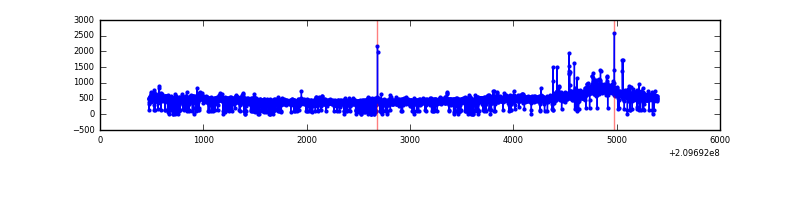 |
| C | 4920 | 4881 | 0 | 0 | 0.00% | 0.00% | 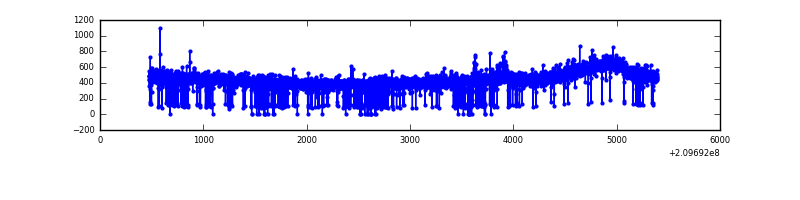 |
| D | 4919 | 4206 | 3182 | 3182 | 64.69% | 75.65% | 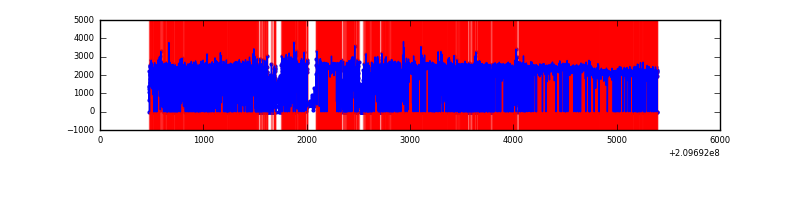 |
Top three noisy pixels from each quadrant. If the there are fewer than three noisy pixels in the level2.evt file, extra rows are filled as -1
| Pixel properties | Quadrant properties | ||||||
|---|---|---|---|---|---|---|---|
| Quadrant | DetID | PixID | Counts | Sigma | Mean | Median | Sigma |
| A | 0 | 50 | 72864 | 619.79 | 556 | 548 | 116.7 |
| A | 13 | 14 | 35498 | 299.54 | 556 | 548 | 116.7 |
| A | 0 | 31 | 32116 | 270.56 | 556 | 548 | 116.7 |
| B | 15 | 204 | 48271 | 452.8 | 544 | 535 | 105.4 |
| B | 15 | 54 | 43495 | 407.5 | 544 | 535 | 105.4 |
| B | 0 | 219 | 36136 | 337.7 | 544 | 535 | 105.4 |
| C | 8 | 128 | 10376 | 78.32 | 529 | 537 | 125.6 |
| C | 9 | 202 | 10057 | 75.78 | 529 | 537 | 125.6 |
| C | 8 | 112 | 5661 | 40.79 | 529 | 537 | 125.6 |
| D | 2 | 63 | 7352614 | 117531.57 | 239 | 232 | 62.6 |
| D | 2 | 33 | 224737 | 3588.83 | 239 | 232 | 62.6 |
| D | 13 | 53 | 89602 | 1428.62 | 239 | 232 | 62.6 |
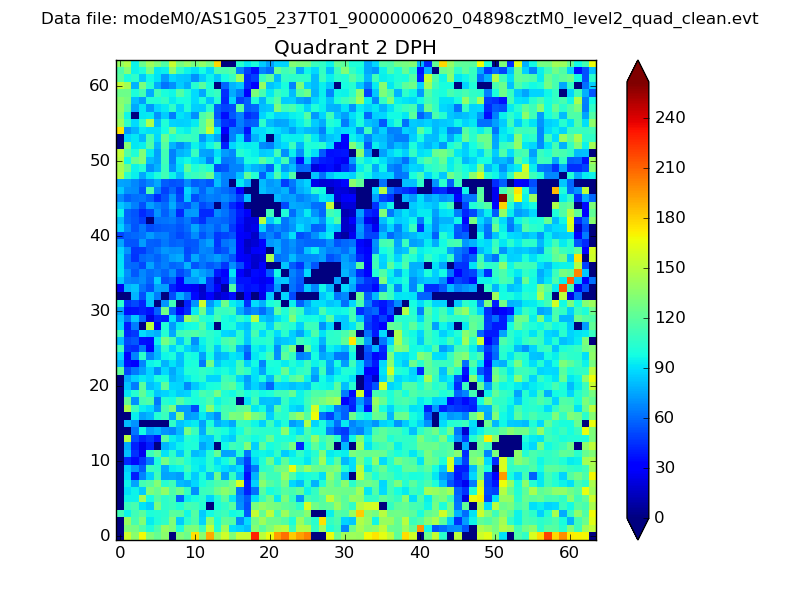
Histogram calculated using DETX and DETY for each event in the final _common_clean file
| Quadrant A | 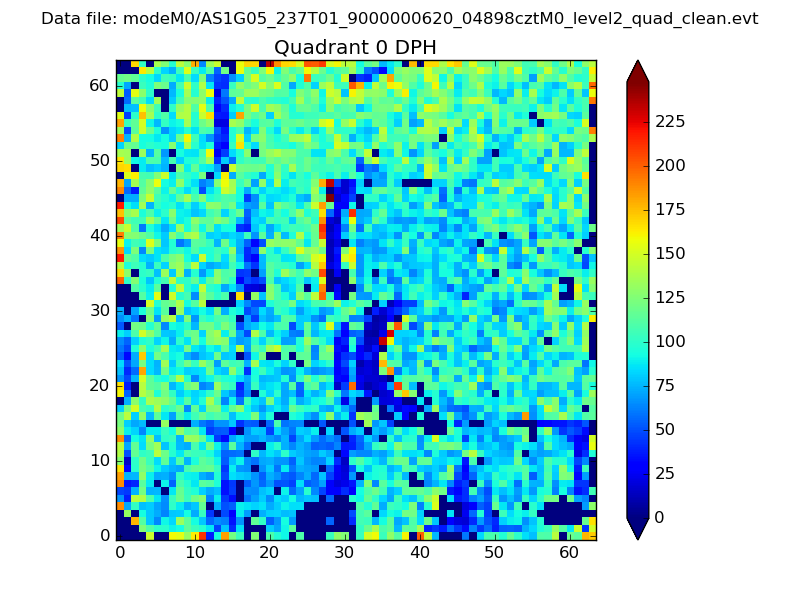 |
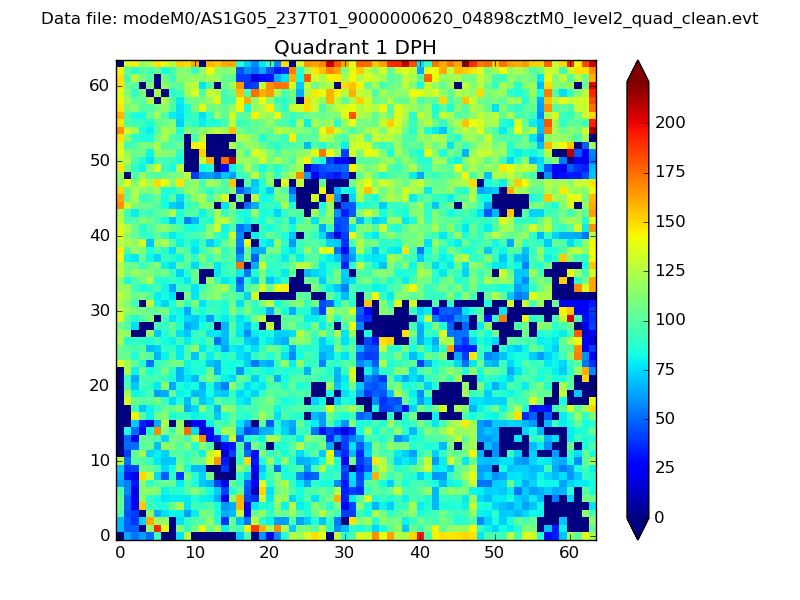 |
Quadrant B |
|---|---|---|---|
| Quadrant D | 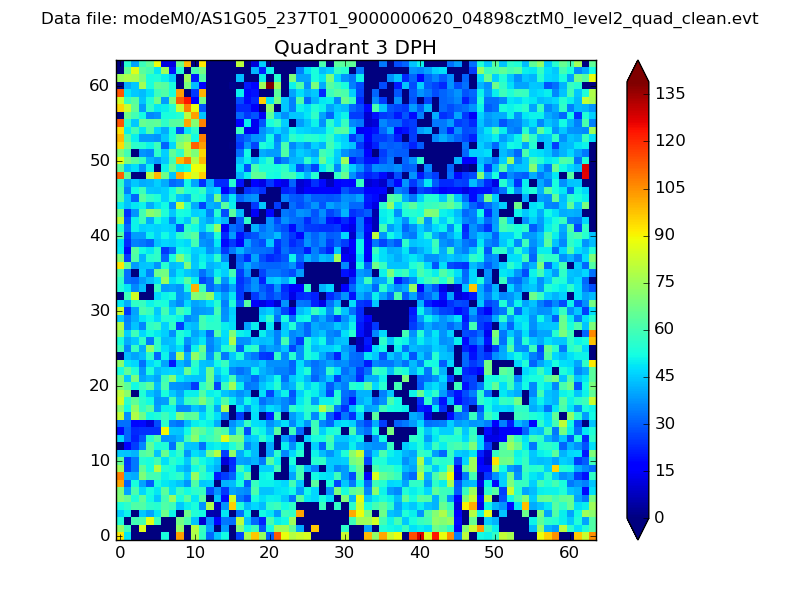 |
 |
Quadrant C |
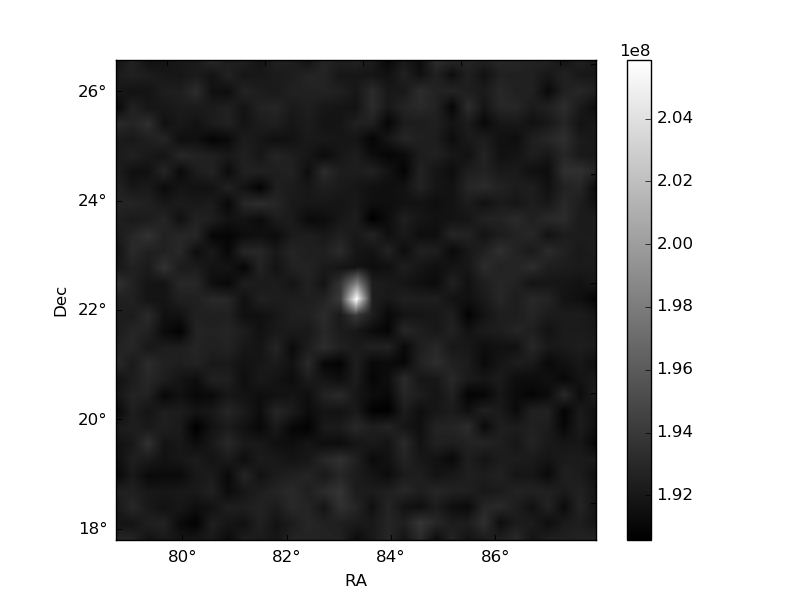
| Plot type | Count rate plots | Images |
|---|---|---|
| Comparison with Poisson distribution Blue bars denote a histogram of data divided into 1 sec bins. Red curve is a Poisson curve with rate = median count rate of data. |
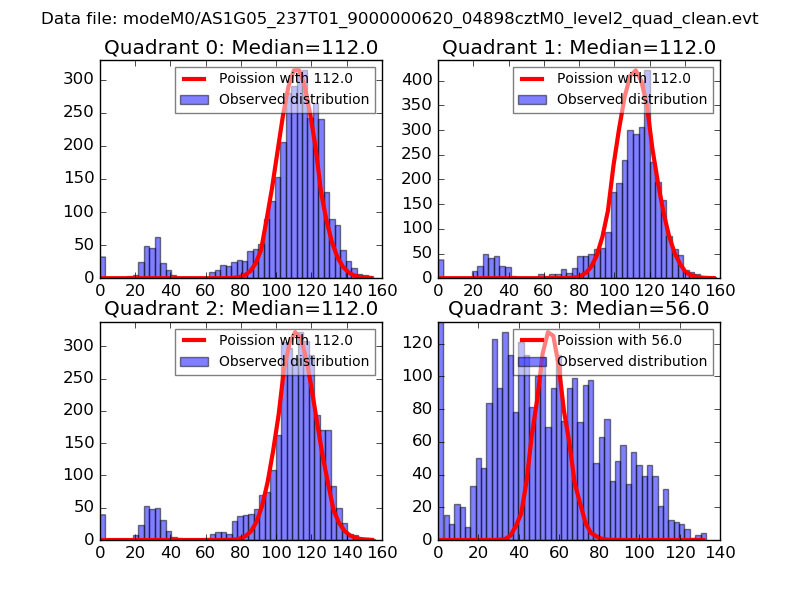 |
 |
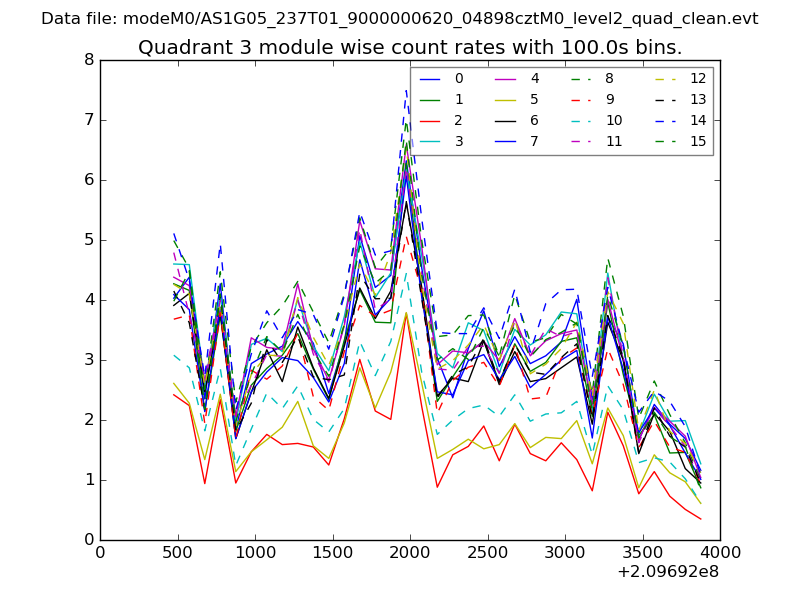
| Quadrant-wise count rates Data is divided into 100 sec bins |
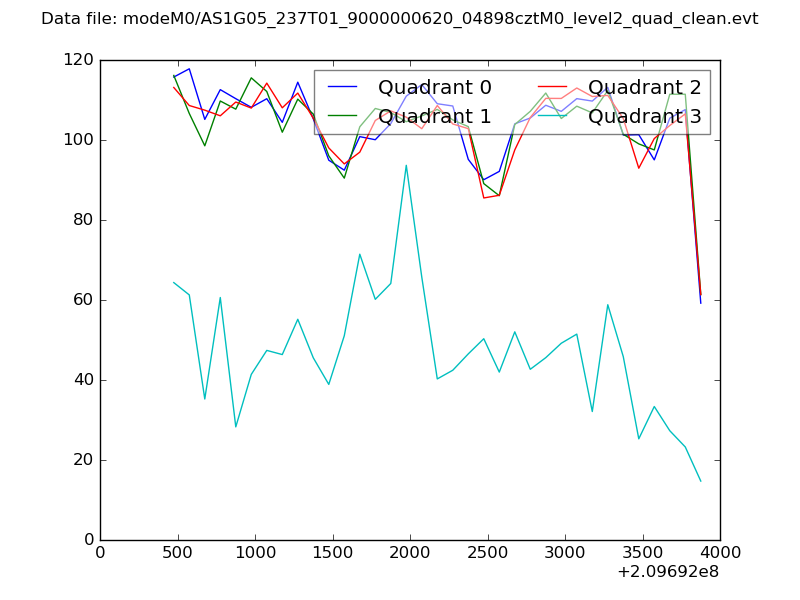 |
|
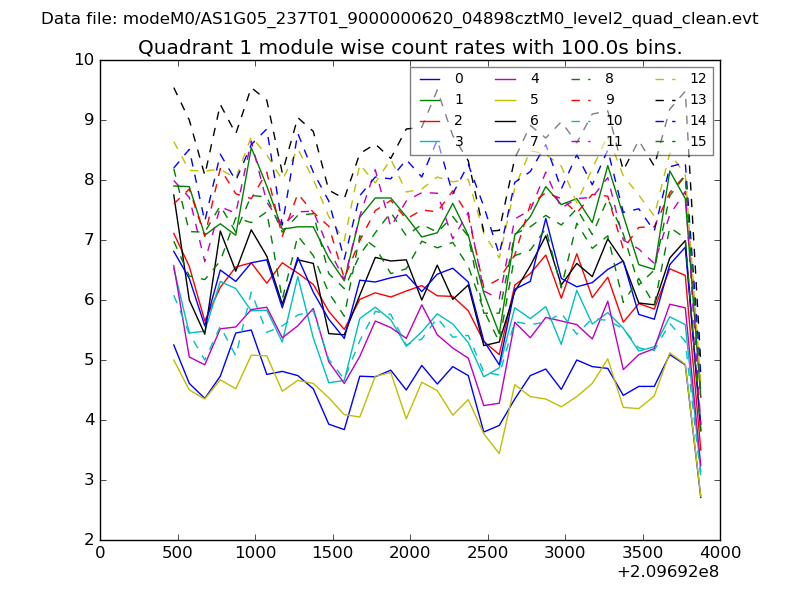
| Module-wise count rates for Quadrant A Data is divided into 100 sec bins |
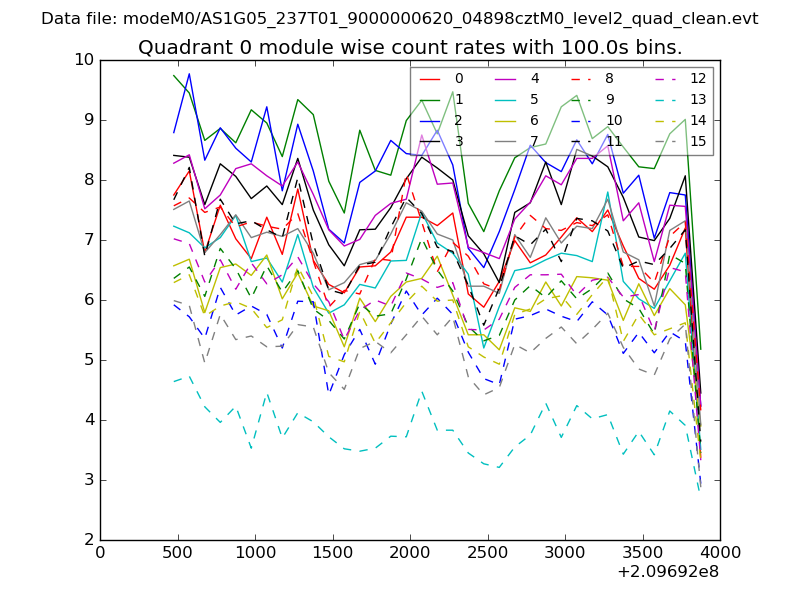 |
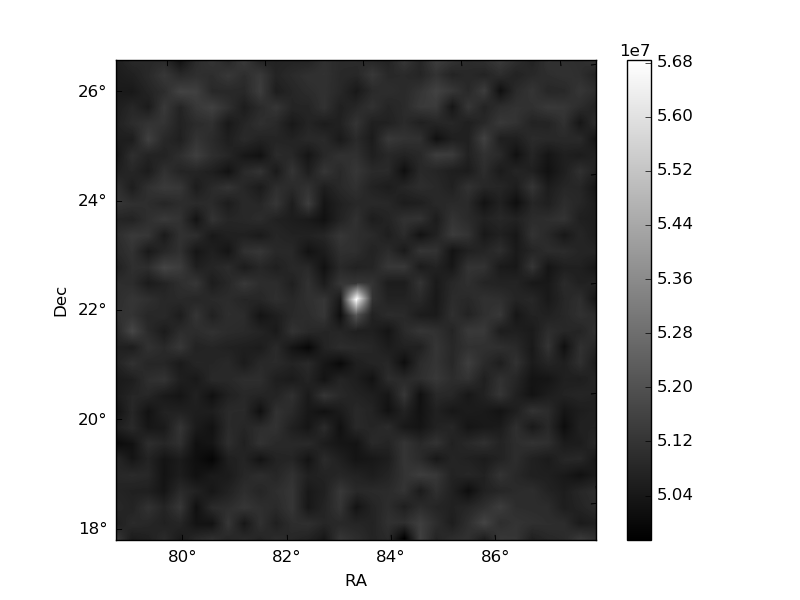 |
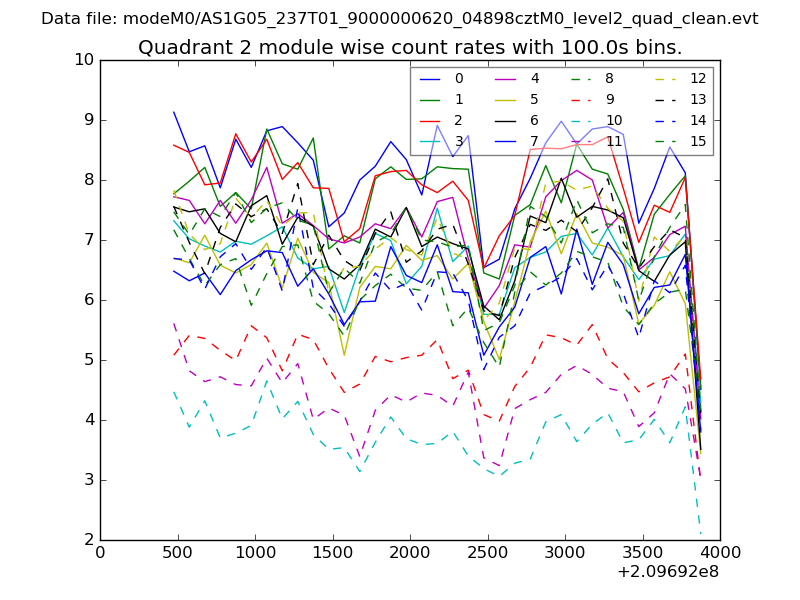
| Module-wise count rates for Quadrant B Data is divided into 100 sec bins |
 |
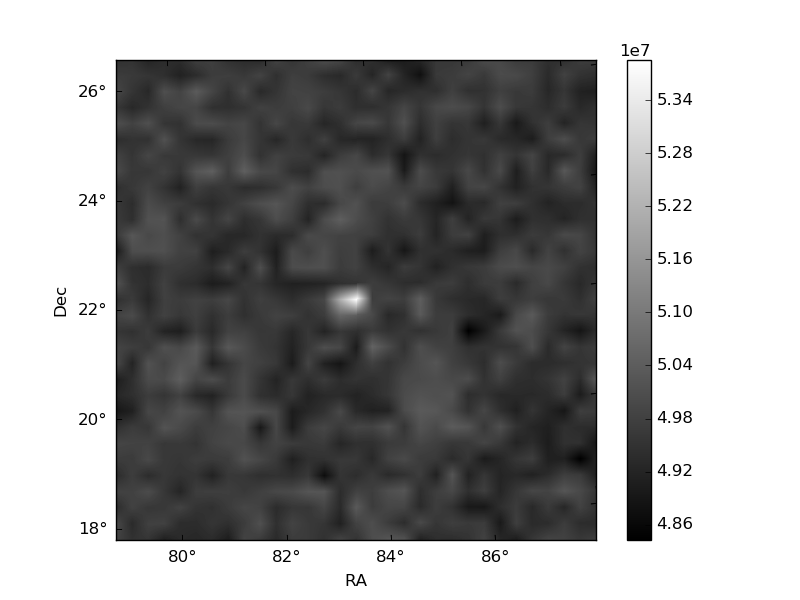 |
| Module-wise count rates for Quadrant C Data is divided into 100 sec bins |
 |
 |
| Module-wise count rates for Quadrant D Data is divided into 100 sec bins |
 |
 |
| Parameter | Plot |
|---|---|
| CZT HV Monitor | 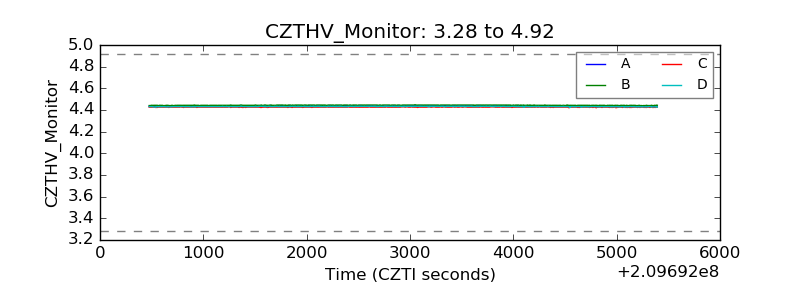 |
| D_VDD | 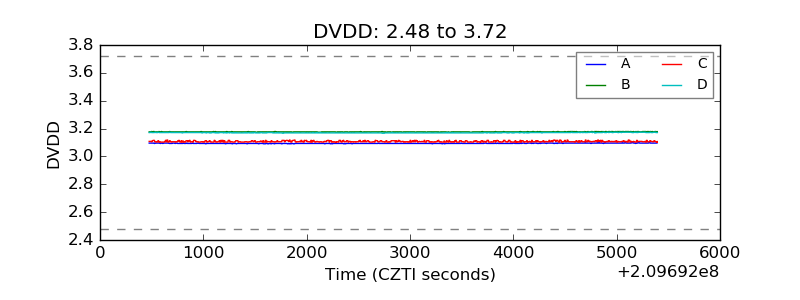 |
| Temperature 1 | 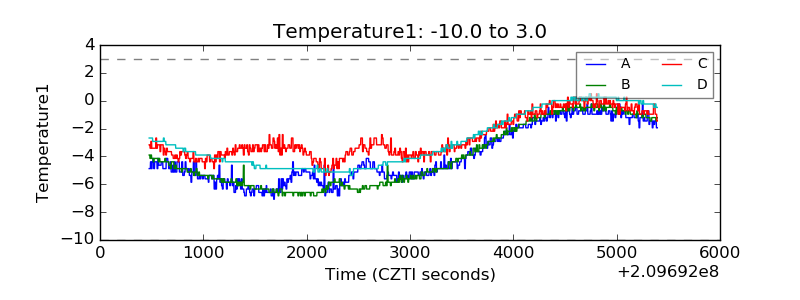 |
| Veto HV Monitor | 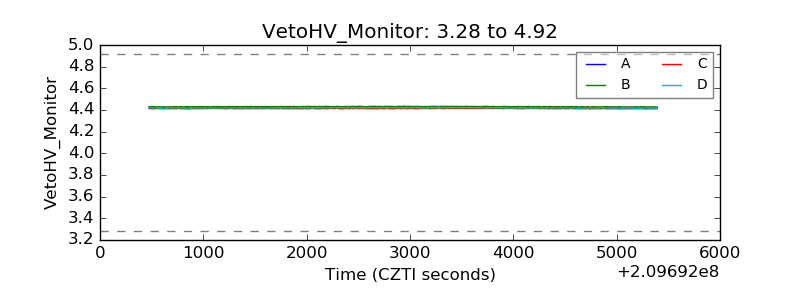 |
| Veto LLD | 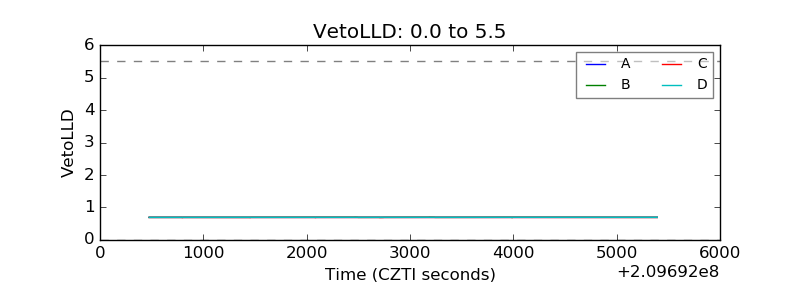 |
| Alpha Counter | 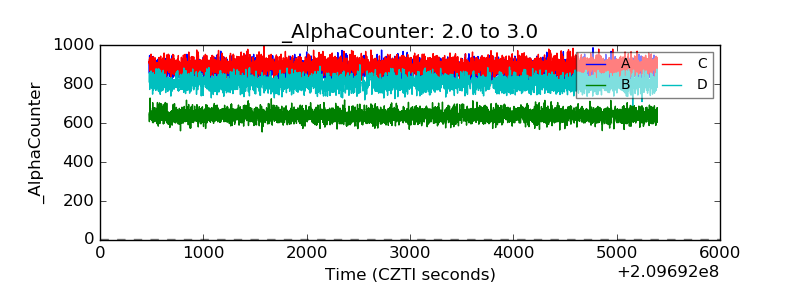 |
| _CPM_Rate | 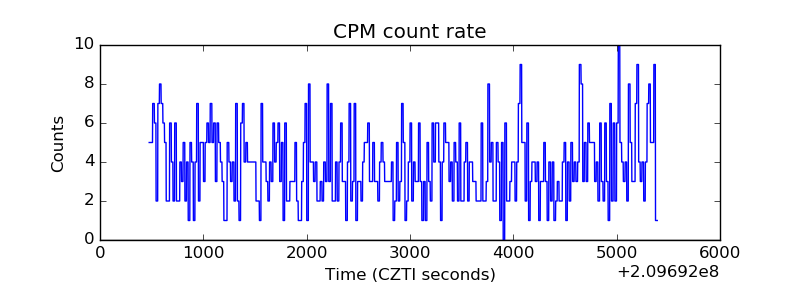 |
| CZT Counter | 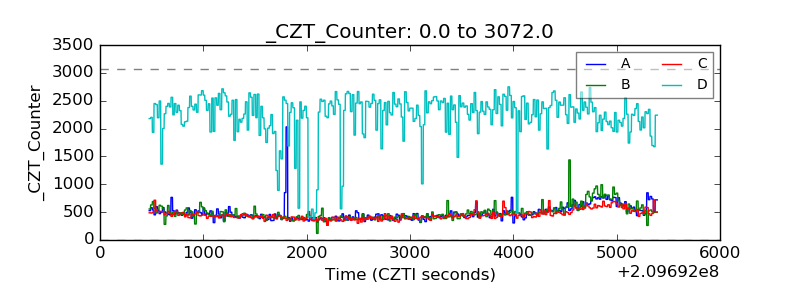 |
| +2.5 Volts monitor |  |
| +5 Volts monitor |  |
| _ROLL_ROT | 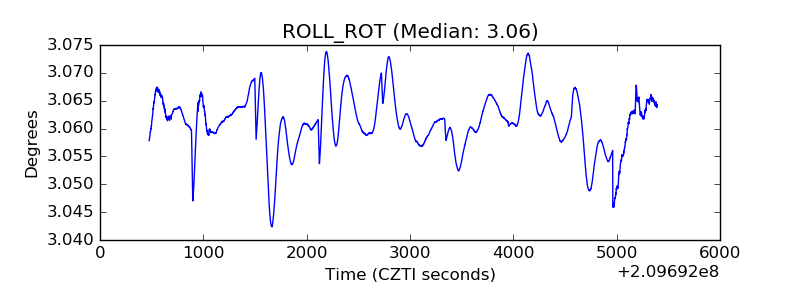 |
| _Roll_DEC | 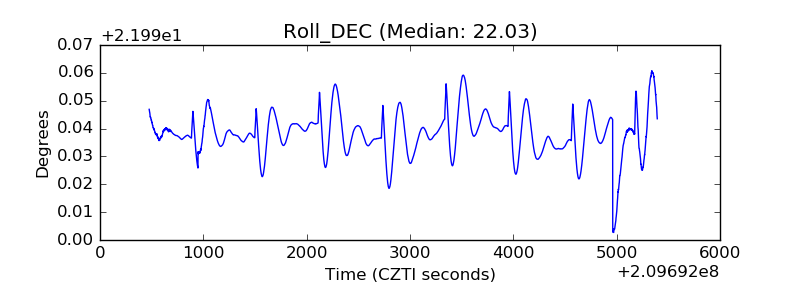 |
| _Roll_RA | 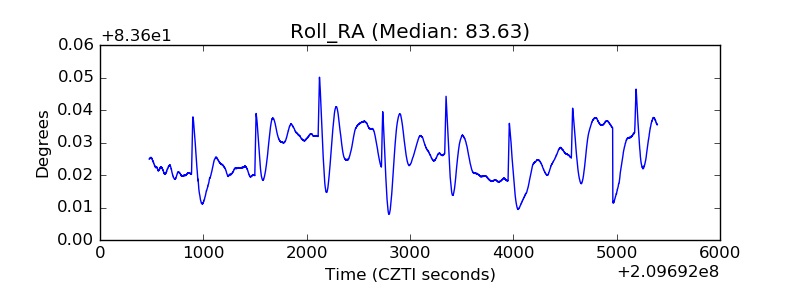 |
| Veto Counter | 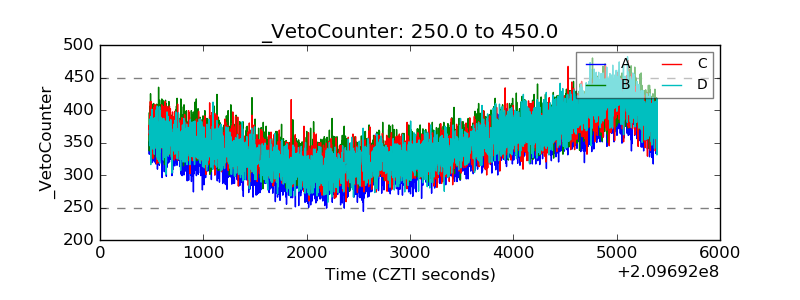 |