| Param | Original file | Final file |
|---|---|---|
| Filename | modeM0/AS1G05_237T01_9000000620_04902cztM0_level2.evt | modeM0/AS1G05_237T01_9000000620_04902cztM0_level2_quad_clean.evt |
| Size (bytes) | 2,937,977,280 | 257,434,560 |
| Size | 2.7 GB | 245.5 MB |
| Events in quadrant A | 13,598,215 | 1,690,568 |
| Events in quadrant B | 13,038,801 | 1,691,419 |
| Events in quadrant C | 11,098,065 | 1,686,030 |
| Events in quadrant D | 49,598,015 | 1,045,043 |
| Mode M9 | |||
|---|---|---|---|
| Quadrant | BADHDUFLAG | Total packets | Discarded packets |
| A | 0 | 32 | 0 |
| B | 0 | 31 | 0 |
| C | 0 | 31 | 0 |
| D | 0 | 31 | 0 |
| Mode SS | |||
|---|---|---|---|
| Quadrant | BADHDUFLAG | Total packets | Discarded packets |
| A | 0 | 498 | 0 |
| B | 0 | 498 | 0 |
| C | 0 | 498 | 0 |
| D | 0 | 498 | 0 |
| Mode M0 | |||
|---|---|---|---|
| Quadrant | BADHDUFLAG | Total packets | Discarded packets |
| A | 0 | 56709 | 4 |
| B | 0 | 55051 | 4 |
| C | 0 | 50208 | 4 |
| D | 0 | 164000 | 12 |
| Quadrant | Total seconds | Saturated seconds | Saturation percentage |
|---|---|---|---|
| A | 24404 | 610 | 2.499590% |
| B | 24404 | 341 | 1.397312% |
| C | 24404 | 141 | 0.577774% |
| D | 24403 | 18838 | 77.195427% |
Noise dominated data is calculated using 1-second bins in cleaned event files. If a bin has >2000 counts, and if more than 50% of those come from <1% of pixels, then it is considered to be noise-dominated and hence unusable.
| Quadrant | # 1 sec bins | Bins with >0 counts | Bins with >2000 counts | High rate bins dominated by noise | Noise dominated (total time) | Noise dominated (detector-on time) | Marked lightcurve |
|---|---|---|---|---|---|---|---|
| A | 28587 | 24407 | 319 | 319 | 1.12% | 1.31% | 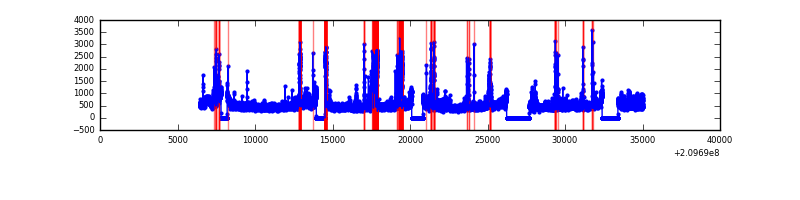 |
| B | 28587 | 24407 | 52 | 52 | 0.18% | 0.21% | 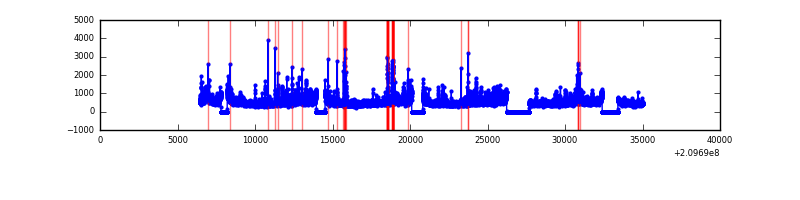 |
| C | 28587 | 24407 | 0 | 0 | 0.00% | 0.00% | 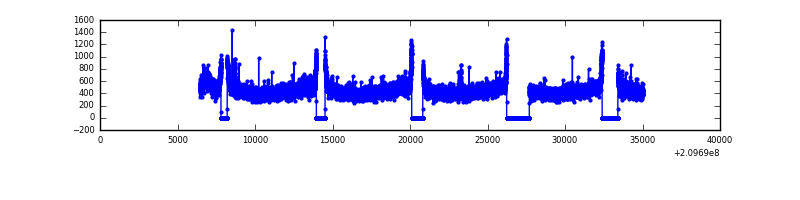 |
| D | 28586 | 24403 | 15130 | 15130 | 52.93% | 62.00% | 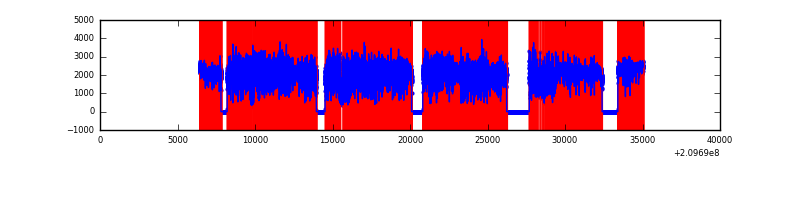 |
Top three noisy pixels from each quadrant. If the there are fewer than three noisy pixels in the level2.evt file, extra rows are filled as -1
| Pixel properties | Quadrant properties | ||||||
|---|---|---|---|---|---|---|---|
| Quadrant | DetID | PixID | Counts | Sigma | Mean | Median | Sigma |
| A | 0 | 31 | 1064073 | 1779.92 | 2917 | 2864 | 596.2 |
| A | 0 | 50 | 800412 | 1337.69 | 2917 | 2864 | 596.2 |
| A | 8 | 15 | 231376 | 383.27 | 2917 | 2864 | 596.2 |
| B | 15 | 204 | 646718 | 1149.15 | 2943 | 2881 | 560.3 |
| B | 4 | 80 | 438625 | 777.74 | 2943 | 2881 | 560.3 |
| B | 15 | 54 | 167120 | 293.14 | 2943 | 2881 | 560.3 |
| C | 12 | 4 | 27658 | 37.86 | 2825 | 2854 | 655.2 |
| C | 13 | 61 | 22970 | 30.7 | 2825 | 2854 | 655.2 |
| C | 8 | 128 | 17498 | 22.35 | 2825 | 2854 | 655.2 |
| D | 2 | 63 | 39412207 | 90334.48 | 1767 | 1719 | 436.3 |
| D | 2 | 234 | 603636 | 1379.68 | 1767 | 1719 | 436.3 |
| D | 2 | 33 | 502674 | 1148.26 | 1767 | 1719 | 436.3 |
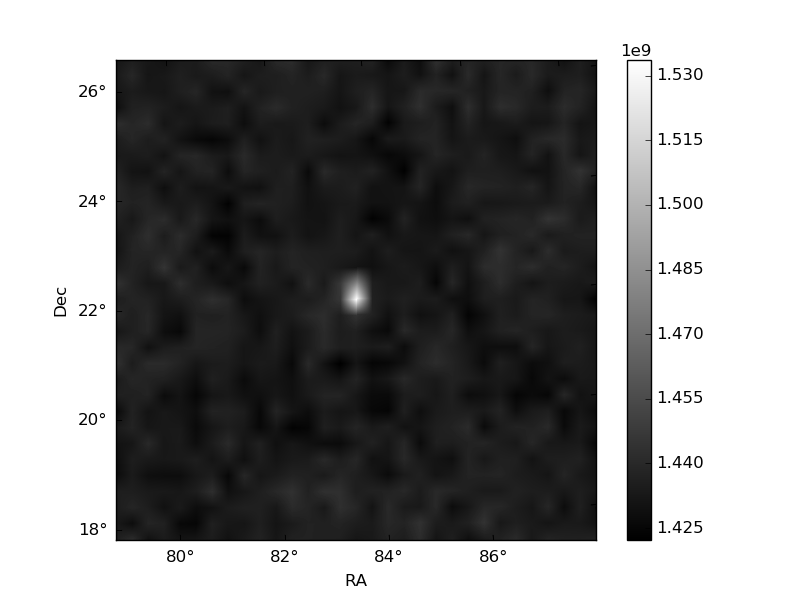
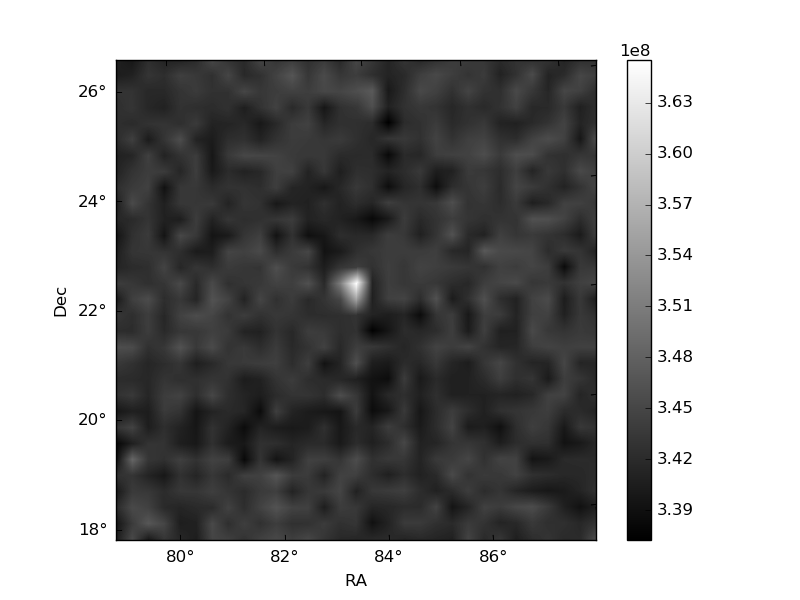
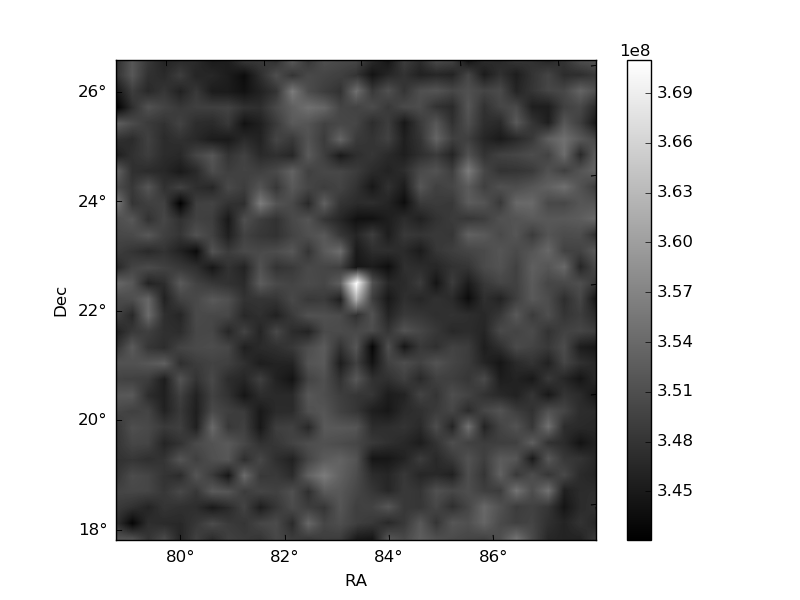
Histogram calculated using DETX and DETY for each event in the final _common_clean file
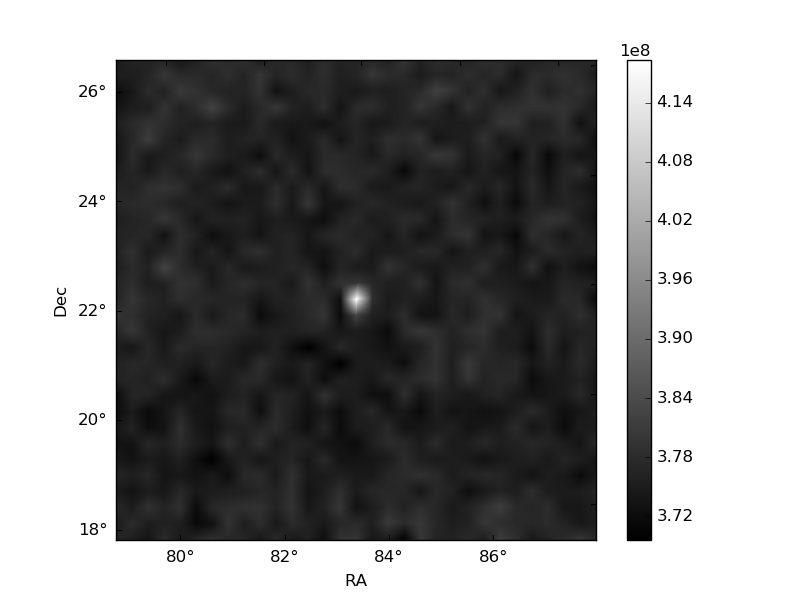
| Quadrant A | 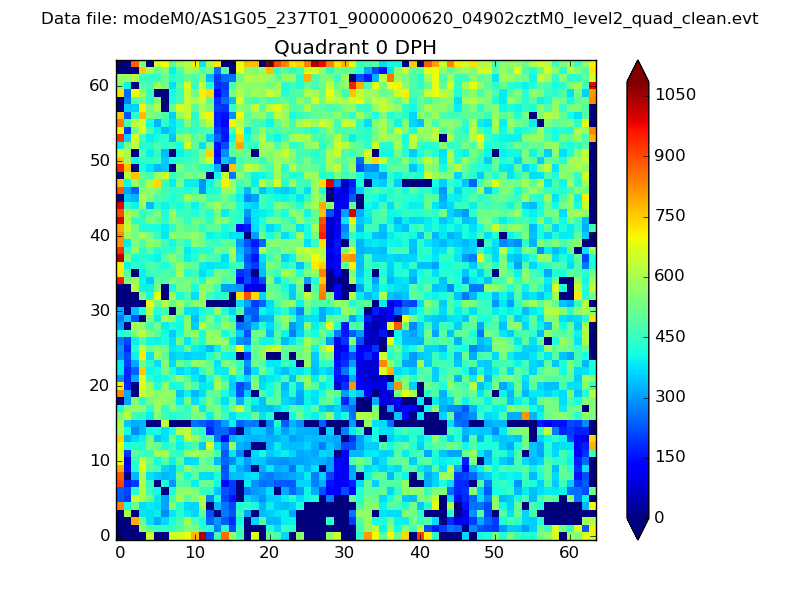 |
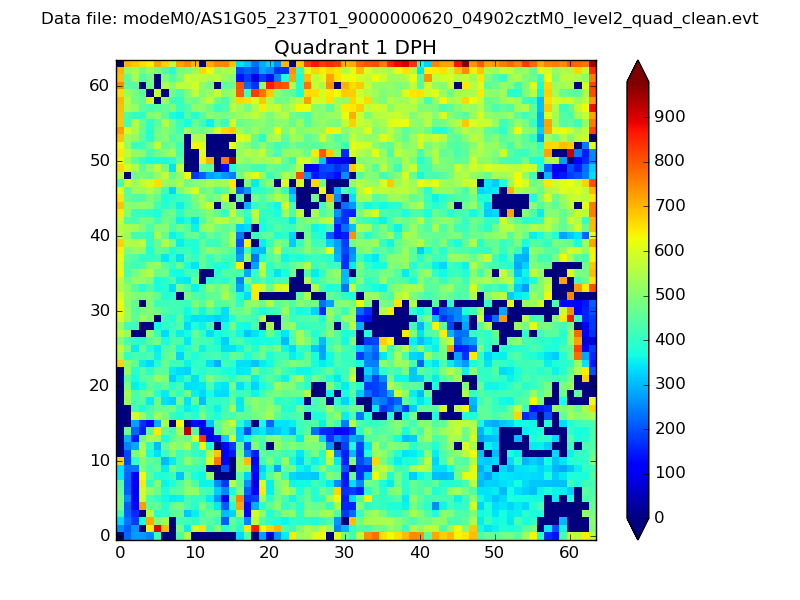 |
Quadrant B |
|---|---|---|---|
| Quadrant D | 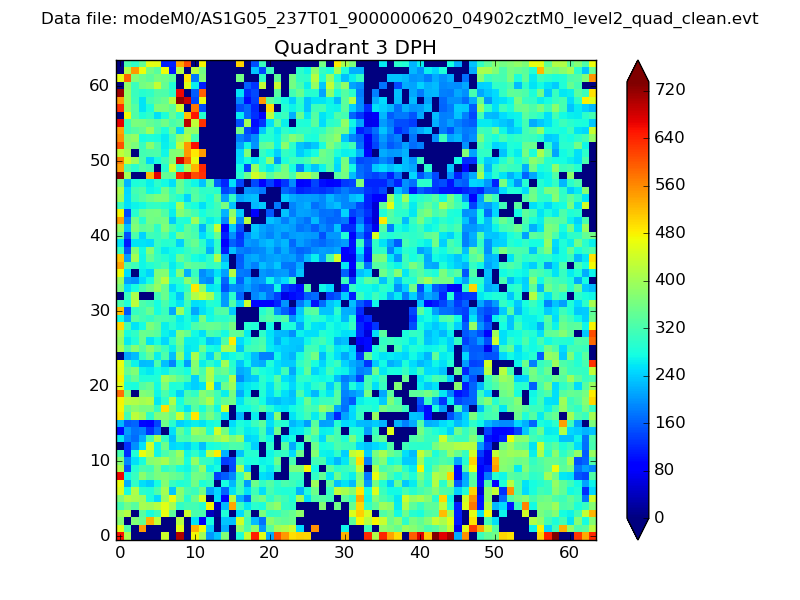 |
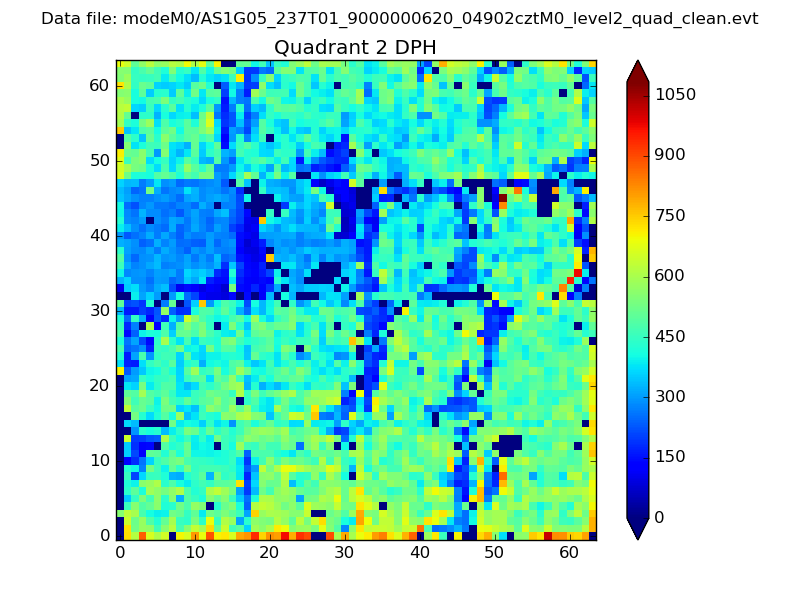 |
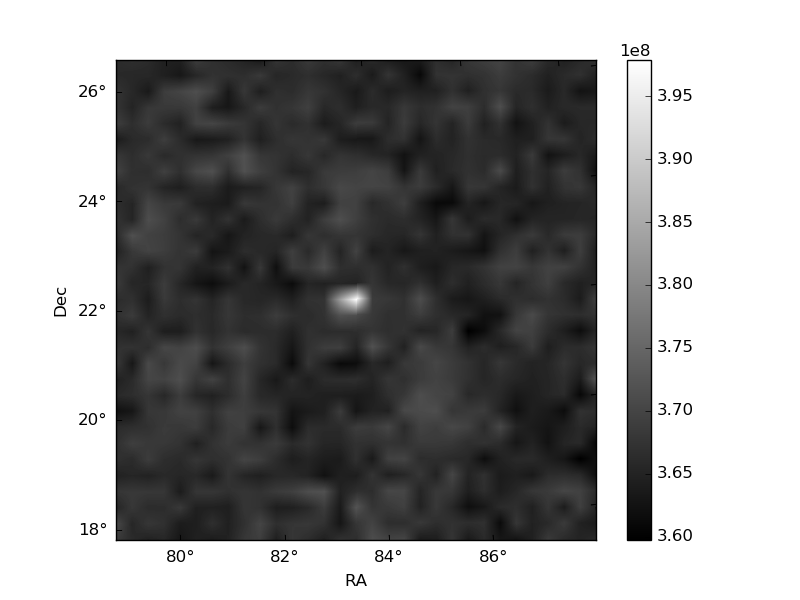
Quadrant C |
| Plot type | Count rate plots | Images |
|---|---|---|
| Comparison with Poisson distribution Blue bars denote a histogram of data divided into 1 sec bins. Red curve is a Poisson curve with rate = median count rate of data. |
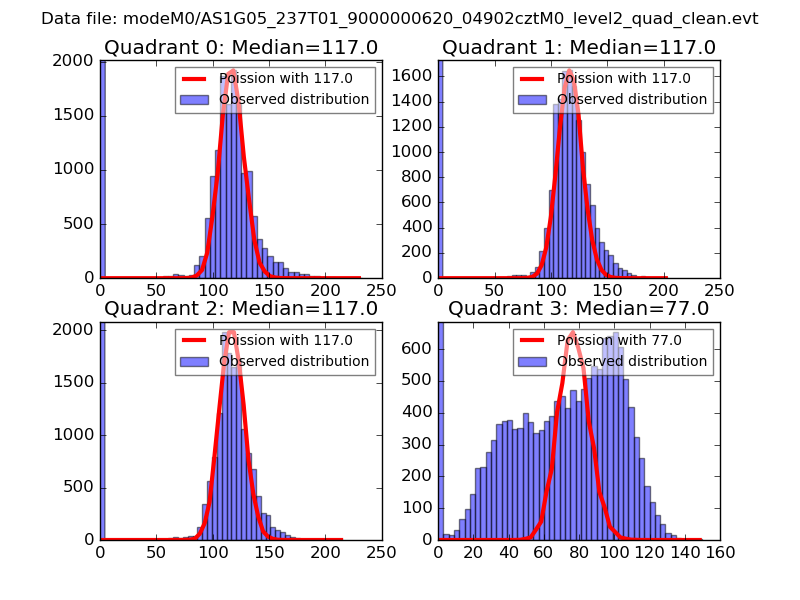 |
 |
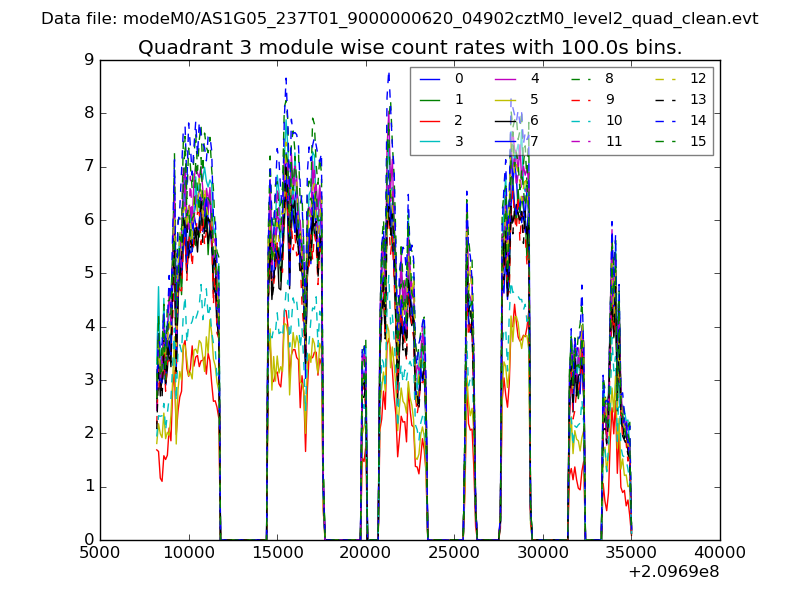
| Quadrant-wise count rates Data is divided into 100 sec bins |
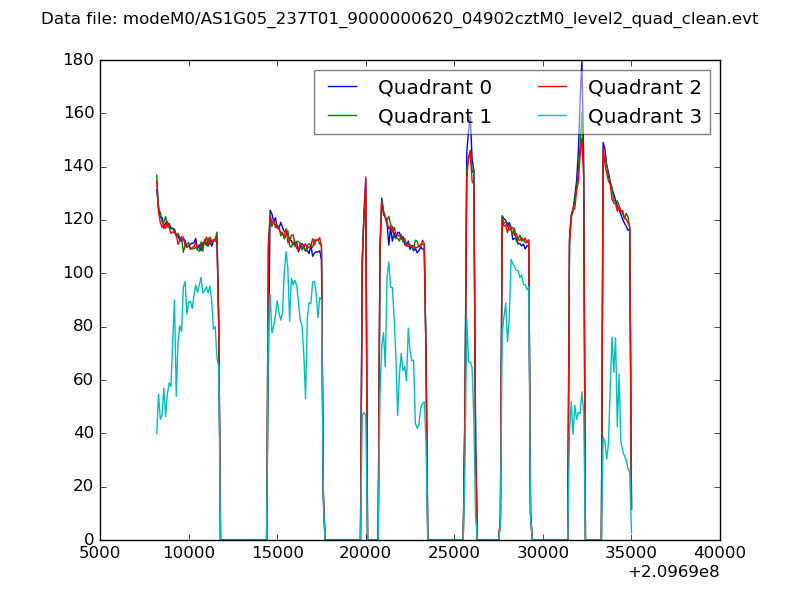 |
|
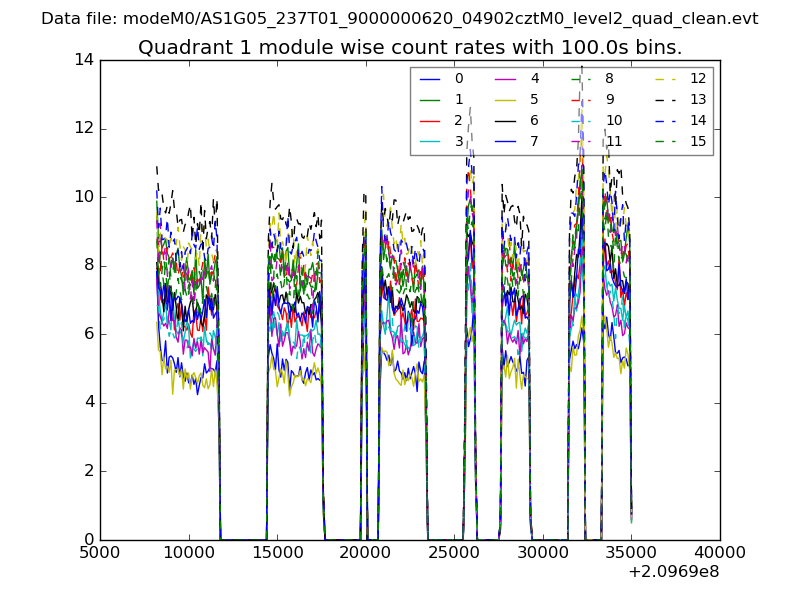
| Module-wise count rates for Quadrant A Data is divided into 100 sec bins |
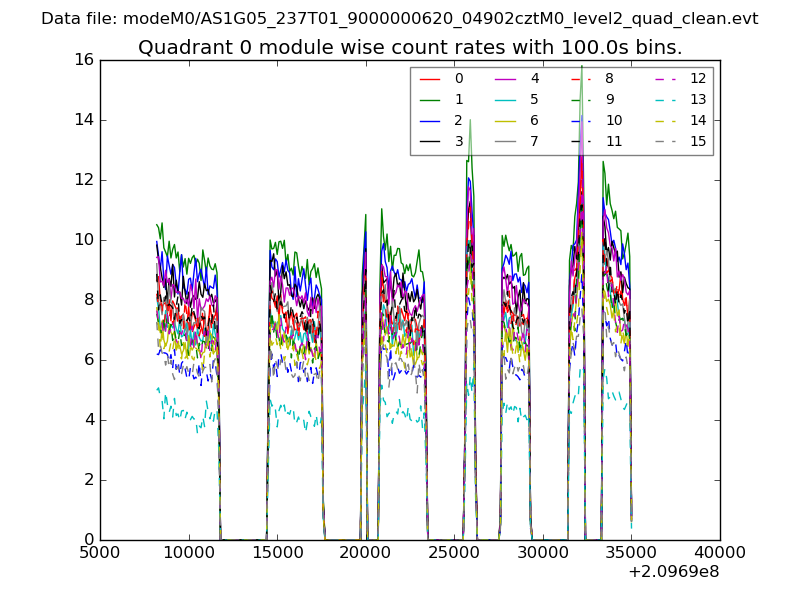 |
 |
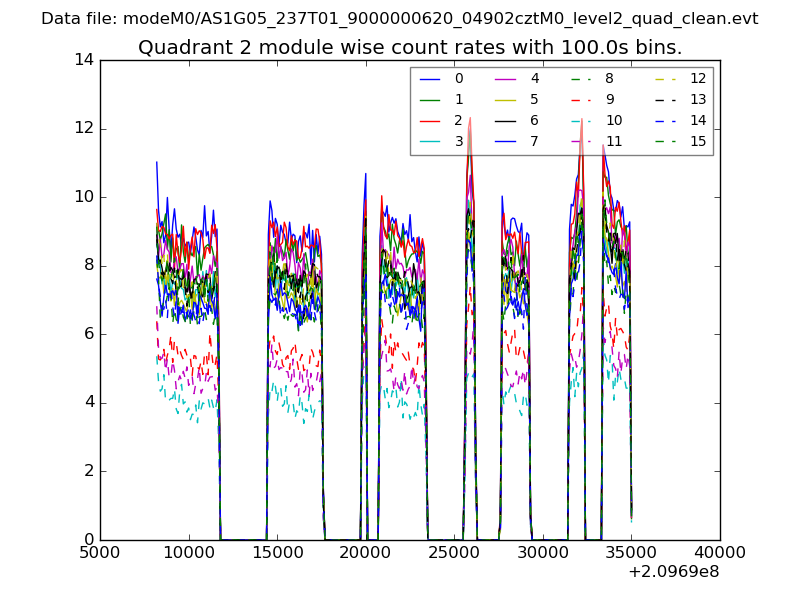
| Module-wise count rates for Quadrant B Data is divided into 100 sec bins |
 |
 |
| Module-wise count rates for Quadrant C Data is divided into 100 sec bins |
 |
 |
| Module-wise count rates for Quadrant D Data is divided into 100 sec bins |
 |
 |
| Parameter | Plot |
|---|---|
| CZT HV Monitor | 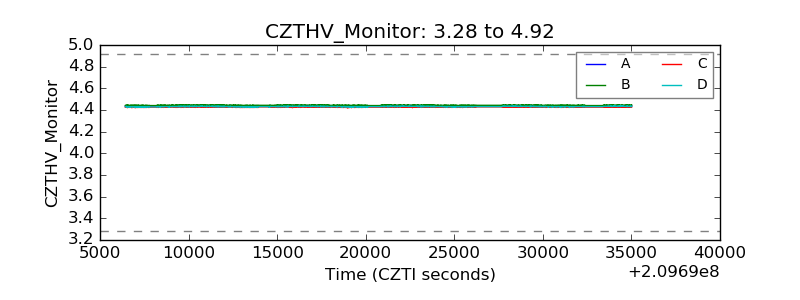 |
| D_VDD | 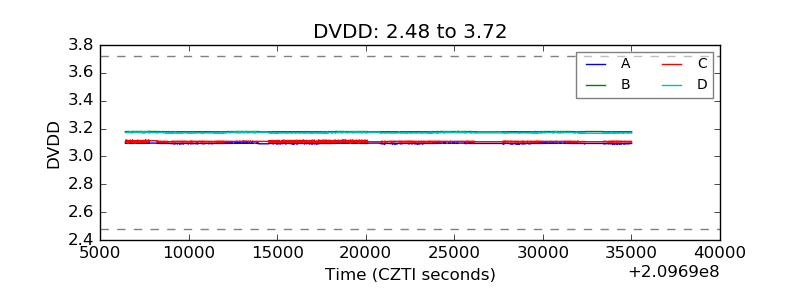 |
| Temperature 1 | 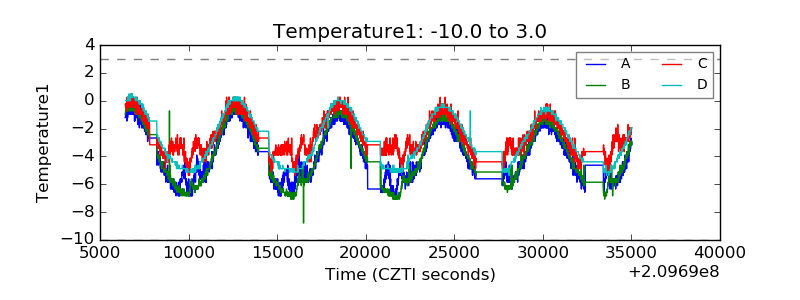 |
| Veto HV Monitor | 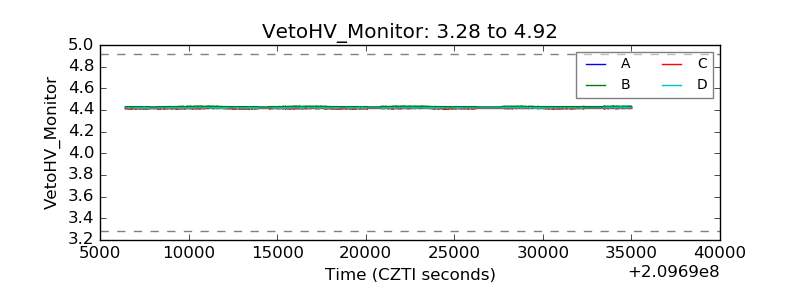 |
| Veto LLD | 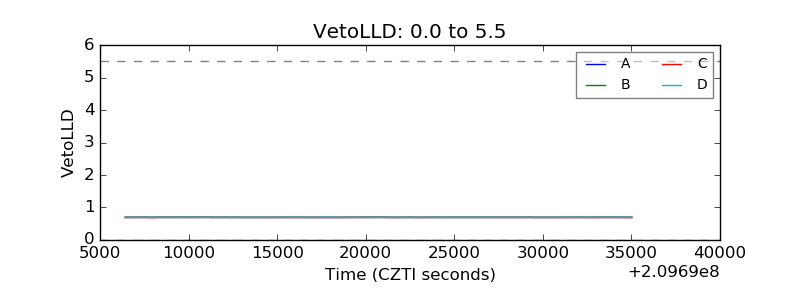 |
| Alpha Counter | 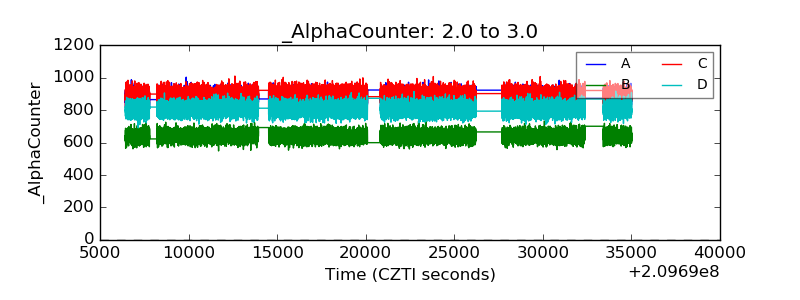 |
| _CPM_Rate | 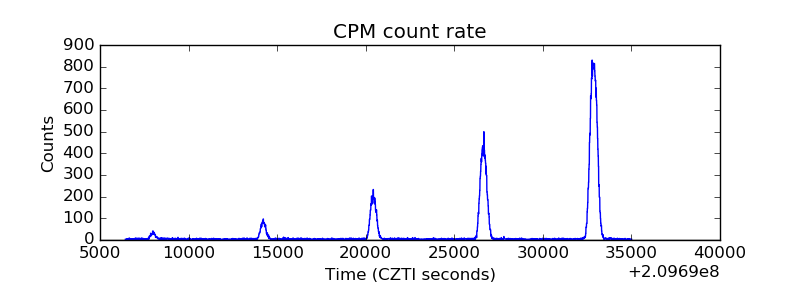 |
| CZT Counter | 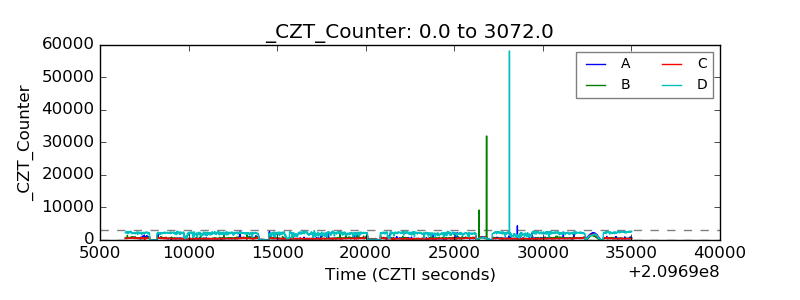 |
| +2.5 Volts monitor |  |
| +5 Volts monitor |  |
| _ROLL_ROT | 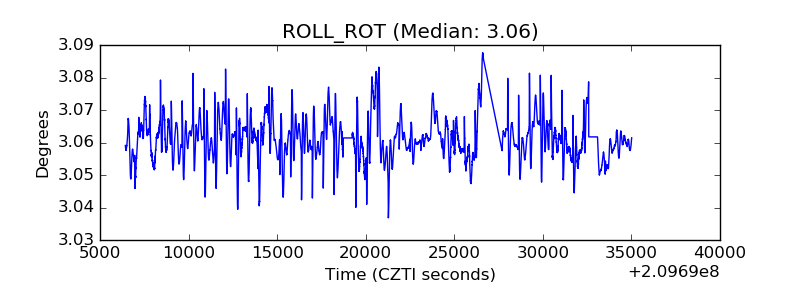 |
| _Roll_DEC | 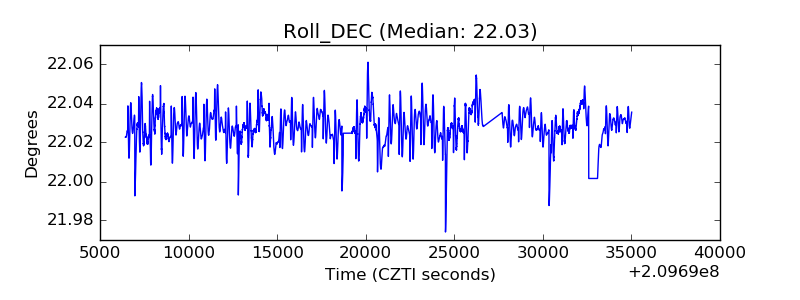 |
| _Roll_RA | 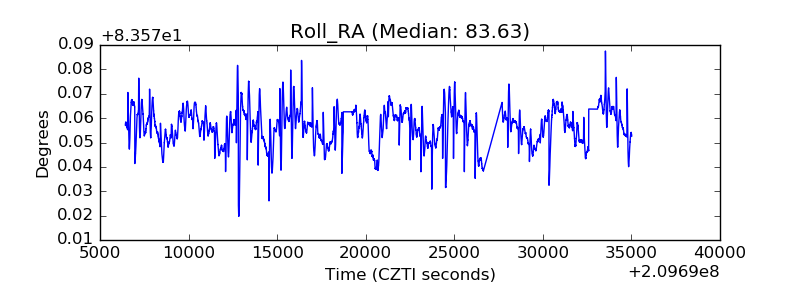 |
| Veto Counter | 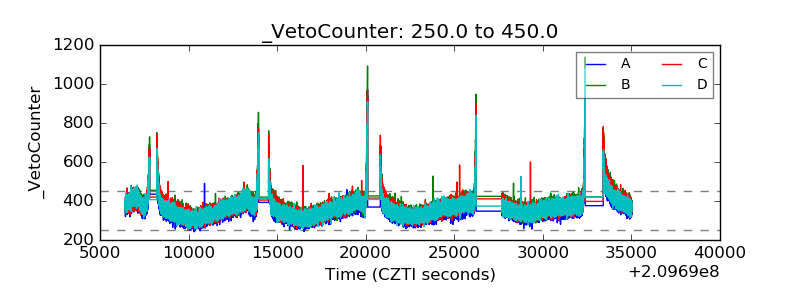 |