| Param | Original file | Final file |
|---|---|---|
| Filename | modeM0/AS1G05_237T01_9000000620_04905cztM0_level2.evt | modeM0/AS1G05_237T01_9000000620_04905cztM0_level2_quad_clean.evt |
| Size (bytes) | 722,292,480 | 59,313,600 |
| Size | 688.8 MB | 56.6 MB |
| Events in quadrant A | 2,815,089 | 409,676 |
| Events in quadrant B | 2,913,784 | 411,420 |
| Events in quadrant C | 2,672,574 | 405,258 |
| Events in quadrant D | 13,089,335 | 172,461 |
| Mode M9 | |||
|---|---|---|---|
| Quadrant | BADHDUFLAG | Total packets | Discarded packets |
| A | 0 | 12 | 0 |
| B | 0 | 12 | 0 |
| C | 0 | 12 | 0 |
| D | 0 | 12 | 0 |
| Mode SS | |||
|---|---|---|---|
| Quadrant | BADHDUFLAG | Total packets | Discarded packets |
| A | 0 | 116 | 0 |
| B | 0 | 116 | 0 |
| C | 0 | 116 | 0 |
| D | 0 | 116 | 0 |
| Mode M0 | |||
|---|---|---|---|
| Quadrant | BADHDUFLAG | Total packets | Discarded packets |
| A | 0 | 11773 | 2 |
| B | 0 | 11924 | 1 |
| C | 0 | 11554 | 1 |
| D | 0 | 42742 | 1 |
| Quadrant | Total seconds | Saturated seconds | Saturation percentage |
|---|---|---|---|
| A | 5652 | 60 | 1.061571% |
| B | 5652 | 53 | 0.937721% |
| C | 5652 | 31 | 0.548478% |
| D | 5652 | 5364 | 94.904459% |
Noise dominated data is calculated using 1-second bins in cleaned event files. If a bin has >2000 counts, and if more than 50% of those come from <1% of pixels, then it is considered to be noise-dominated and hence unusable.
| Quadrant | # 1 sec bins | Bins with >0 counts | Bins with >2000 counts | High rate bins dominated by noise | Noise dominated (total time) | Noise dominated (detector-on time) | Marked lightcurve |
|---|---|---|---|---|---|---|---|
| A | 6867 | 5652 | 2 | 2 | 0.03% | 0.04% | 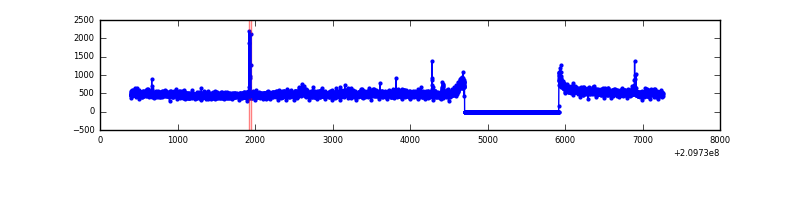 |
| B | 6867 | 5652 | 0 | 0 | 0.00% | 0.00% | 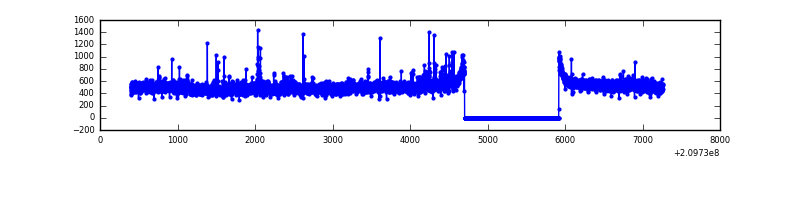 |
| C | 6867 | 5652 | 1 | 1 | 0.01% | 0.02% | 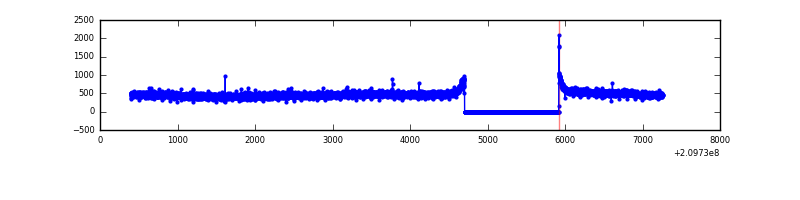 |
| D | 6866 | 5651 | 5039 | 5039 | 73.39% | 89.17% | 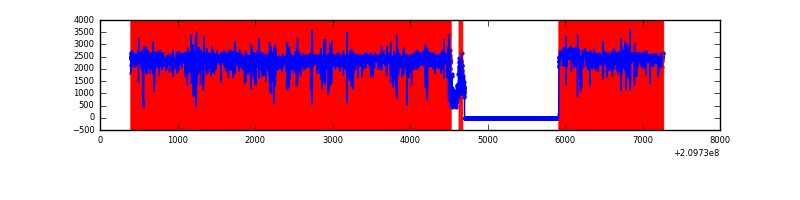 |
Top three noisy pixels from each quadrant. If the there are fewer than three noisy pixels in the level2.evt file, extra rows are filled as -1
| Pixel properties | Quadrant properties | ||||||
|---|---|---|---|---|---|---|---|
| Quadrant | DetID | PixID | Counts | Sigma | Mean | Median | Sigma |
| A | 0 | 31 | 22593 | 150.51 | 714 | 701 | 145.4 |
| A | 13 | 251 | 13531 | 88.21 | 714 | 701 | 145.4 |
| A | 0 | 50 | 10570 | 67.85 | 714 | 701 | 145.4 |
| B | 15 | 204 | 40372 | 292.39 | 714 | 700 | 135.7 |
| B | 4 | 172 | 36836 | 266.33 | 714 | 700 | 135.7 |
| B | 15 | 54 | 25065 | 179.58 | 714 | 700 | 135.7 |
| C | 13 | 61 | 5495 | 30.46 | 683 | 689 | 157.8 |
| C | 12 | 2 | 4960 | 27.07 | 683 | 689 | 157.8 |
| C | 8 | 222 | 2986 | 14.56 | 683 | 689 | 157.8 |
| D | 2 | 63 | 11231892 | 132608.39 | 340 | 330 | 84.7 |
| D | 2 | 33 | 303262 | 3576.65 | 340 | 330 | 84.7 |
| D | 2 | 234 | 109888 | 1293.53 | 340 | 330 | 84.7 |
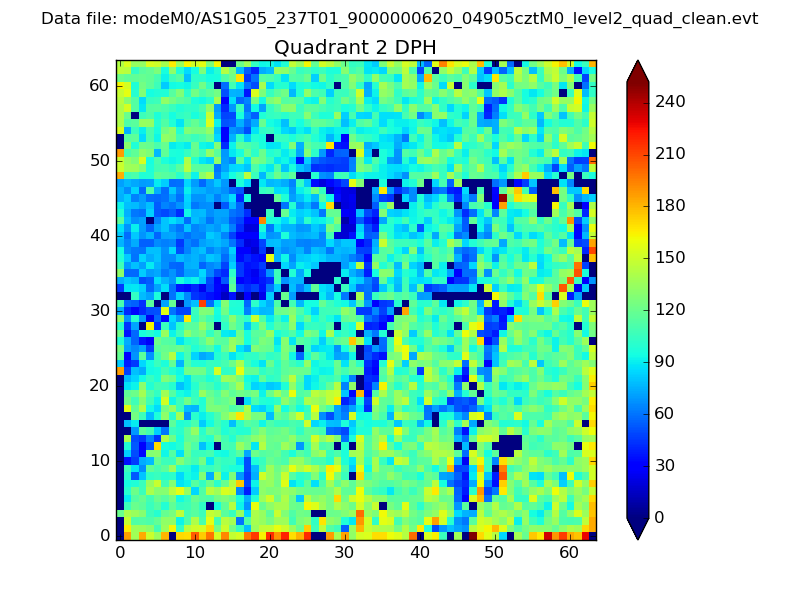
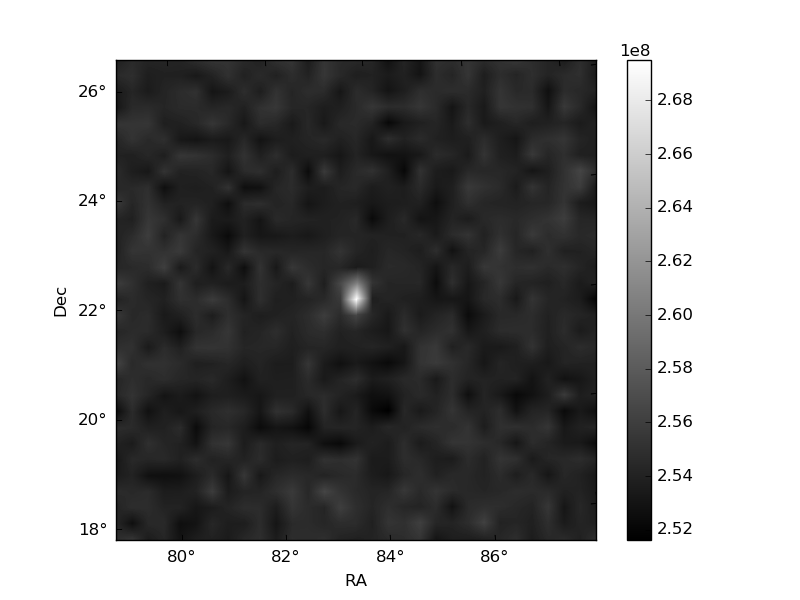
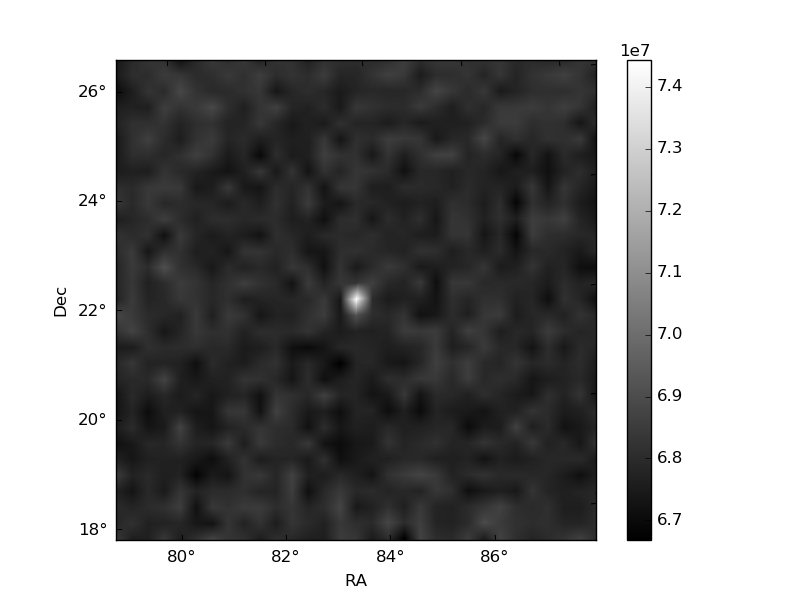
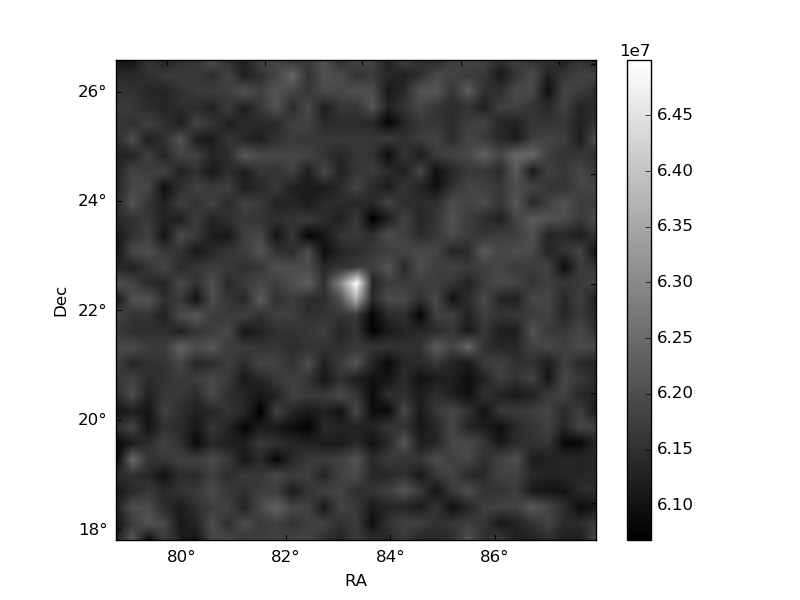
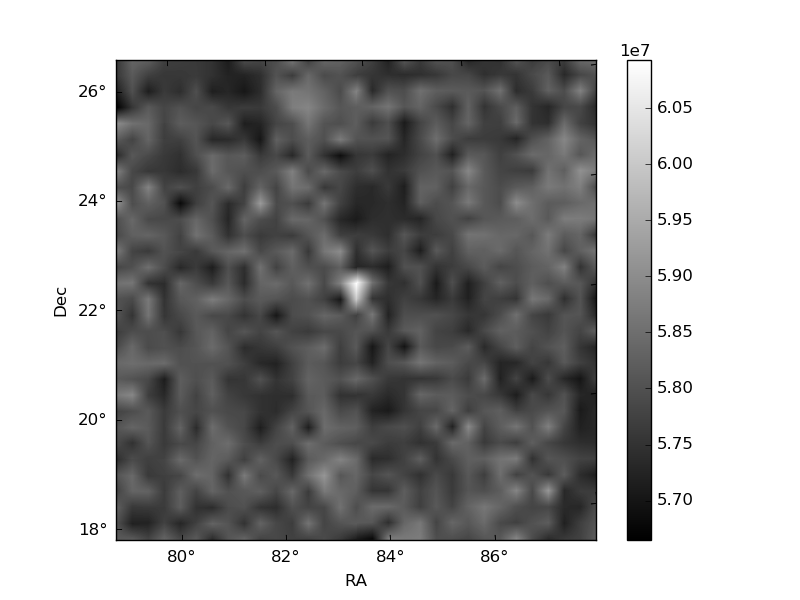
Histogram calculated using DETX and DETY for each event in the final _common_clean file
| Quadrant A | 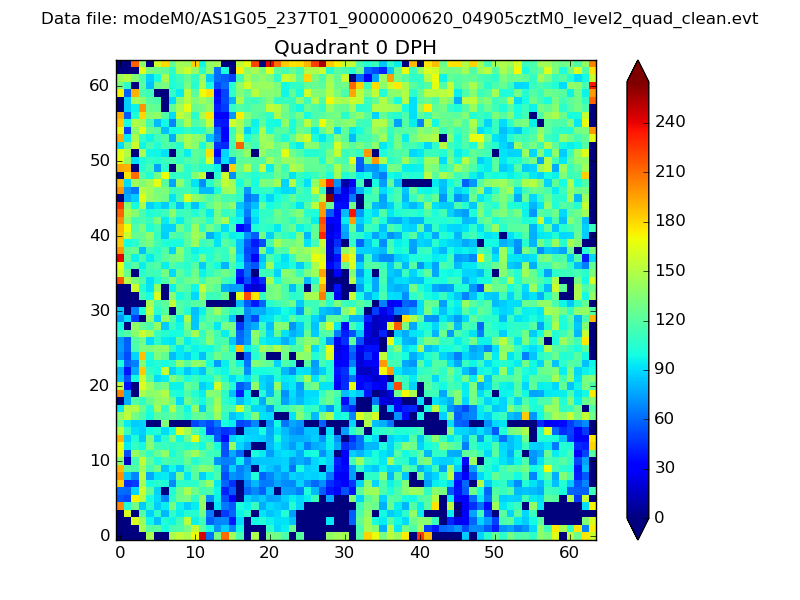 |
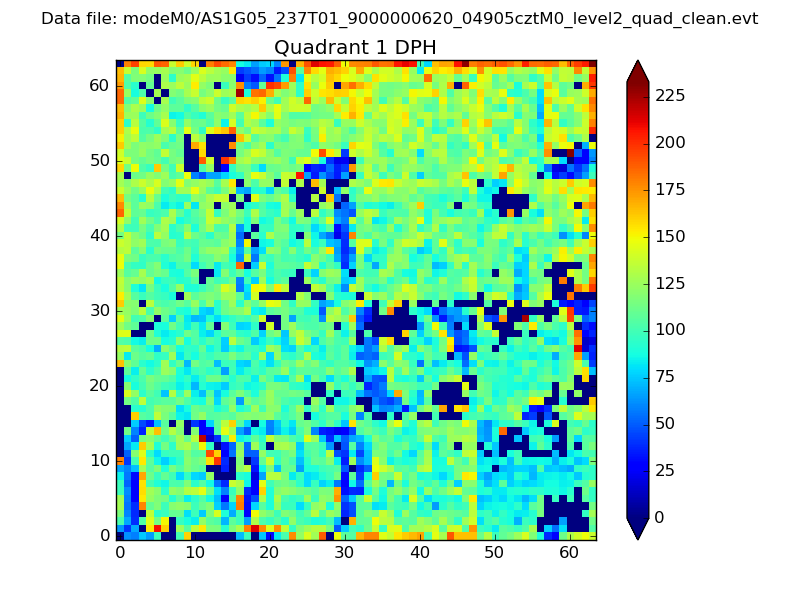 |
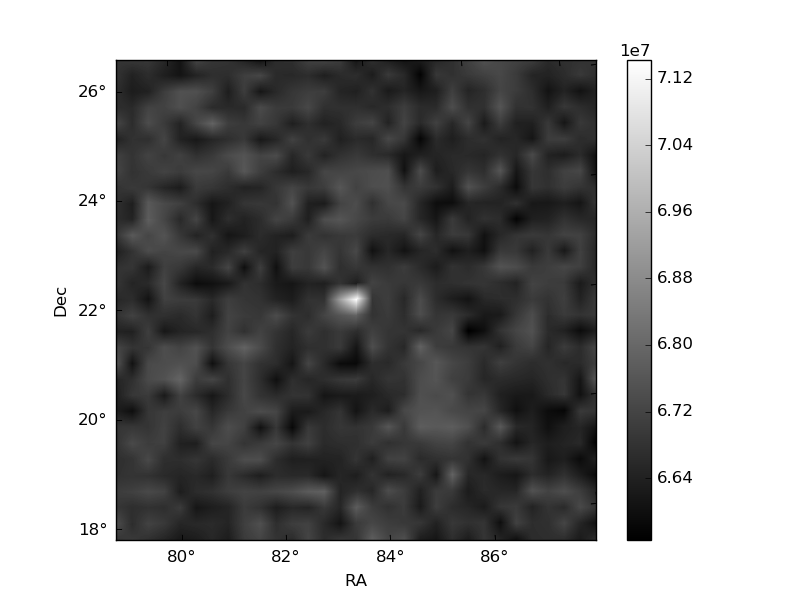
Quadrant B |
|---|---|---|---|
| Quadrant D | 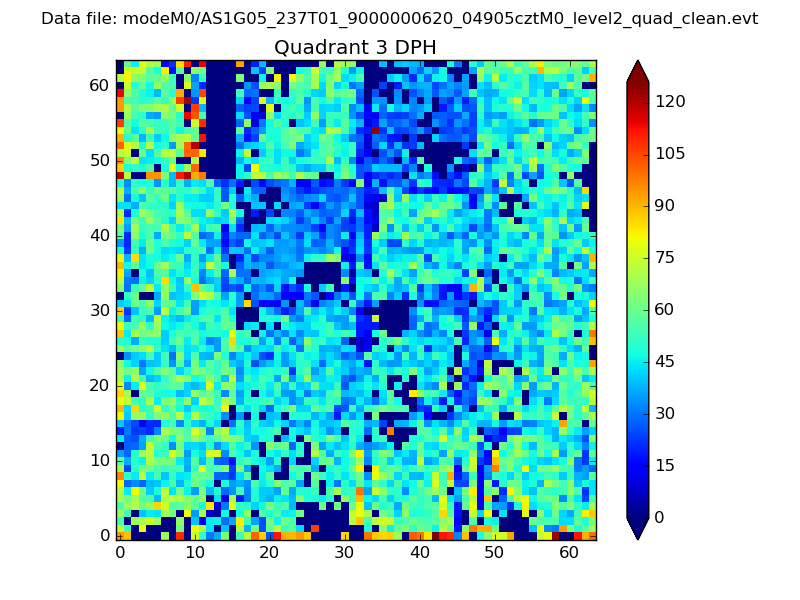 |
 |
Quadrant C |
| Plot type | Count rate plots | Images |
|---|---|---|
| Comparison with Poisson distribution Blue bars denote a histogram of data divided into 1 sec bins. Red curve is a Poisson curve with rate = median count rate of data. |
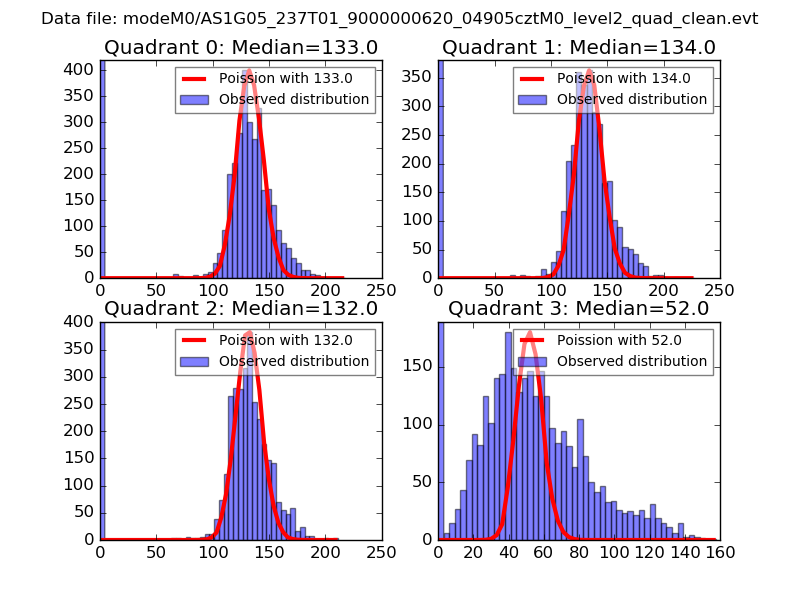 |
 |
| Quadrant-wise count rates Data is divided into 100 sec bins |
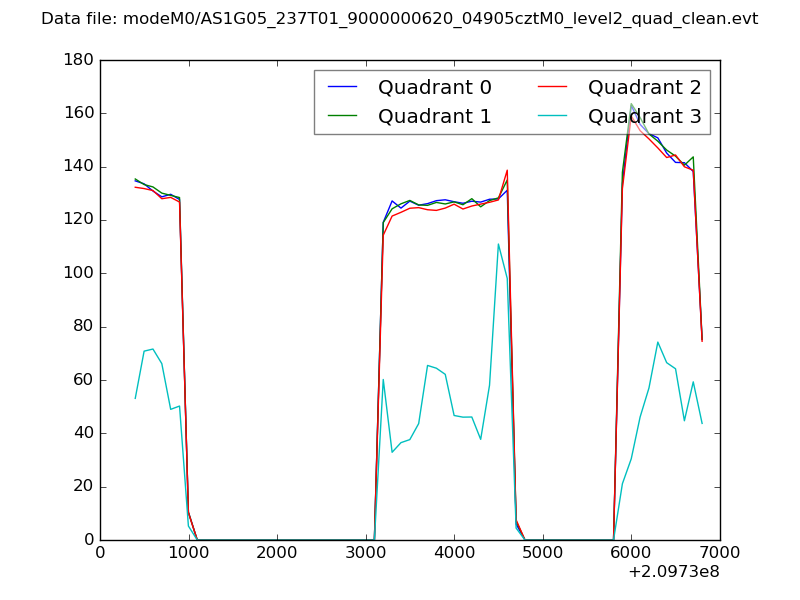 |
|
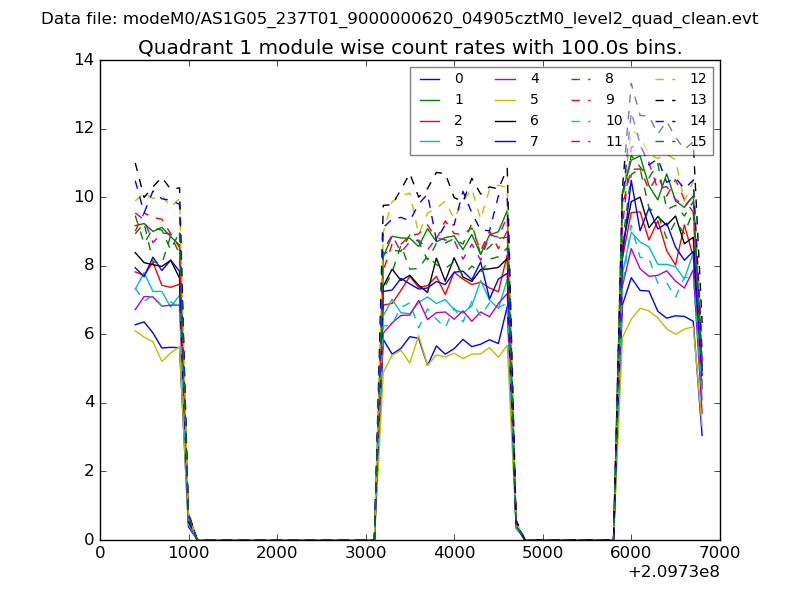
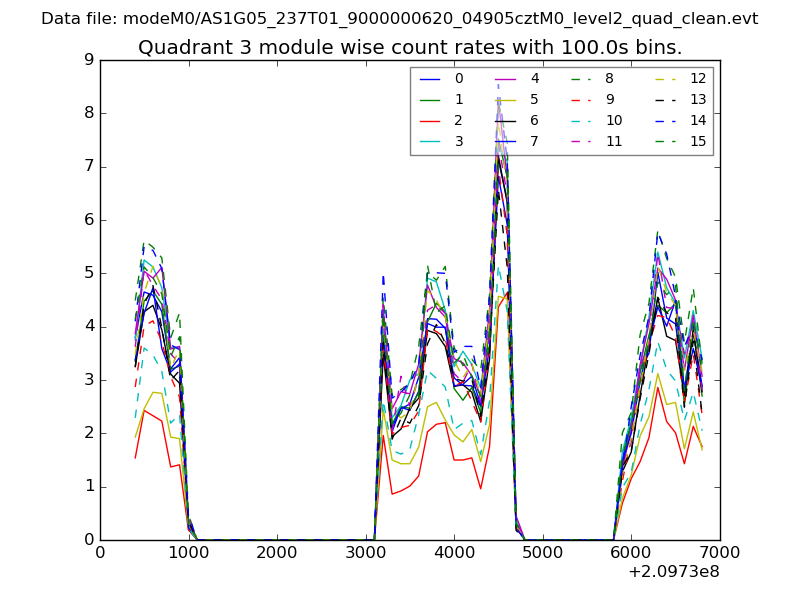
| Module-wise count rates for Quadrant A Data is divided into 100 sec bins |
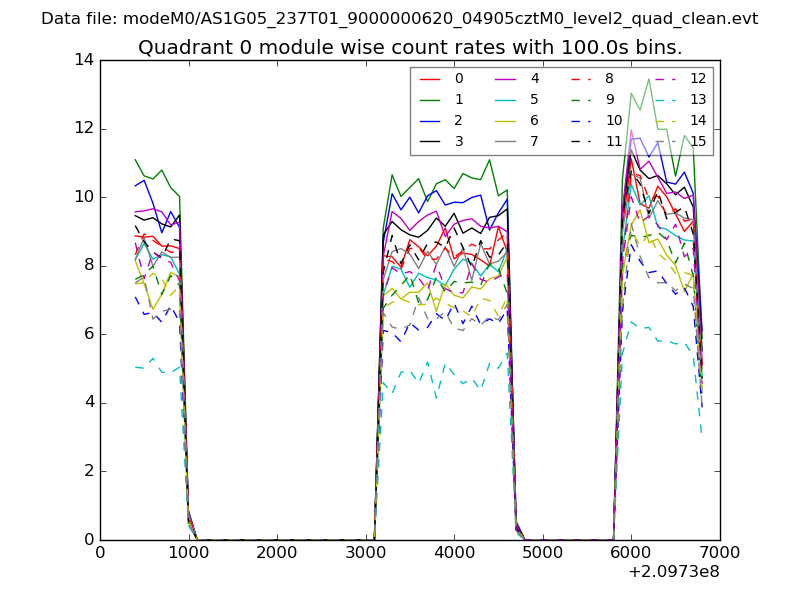 |
 |
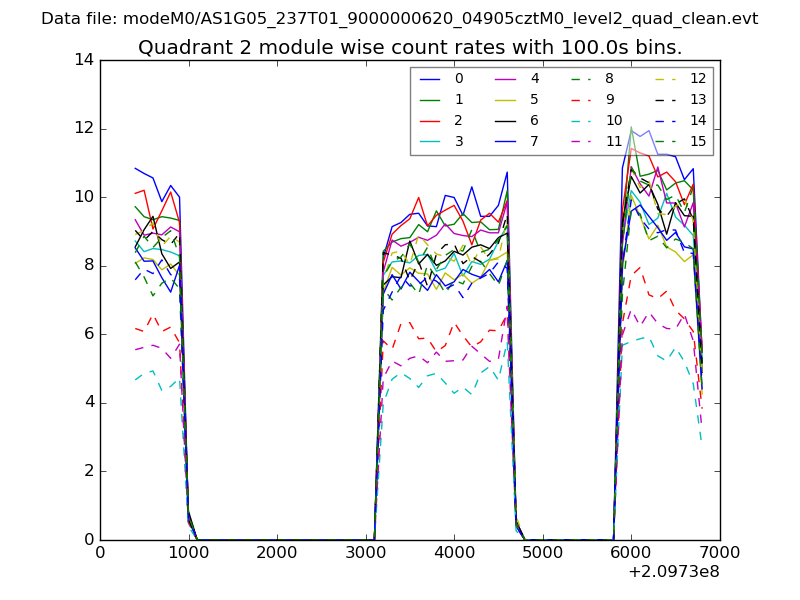
| Module-wise count rates for Quadrant B Data is divided into 100 sec bins |
 |
 |
| Module-wise count rates for Quadrant C Data is divided into 100 sec bins |
 |
 |
| Module-wise count rates for Quadrant D Data is divided into 100 sec bins |
 |
 |
| Parameter | Plot |
|---|---|
| CZT HV Monitor | 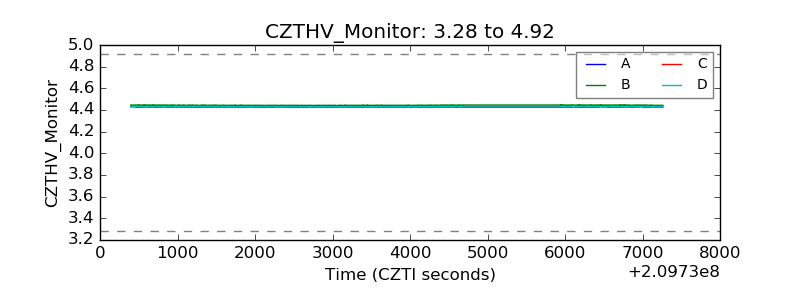 |
| D_VDD | 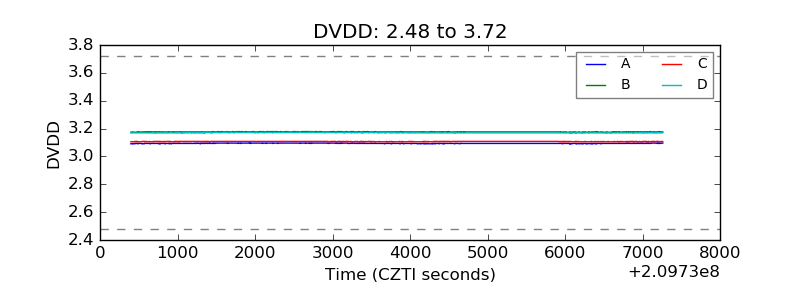 |
| Temperature 1 | 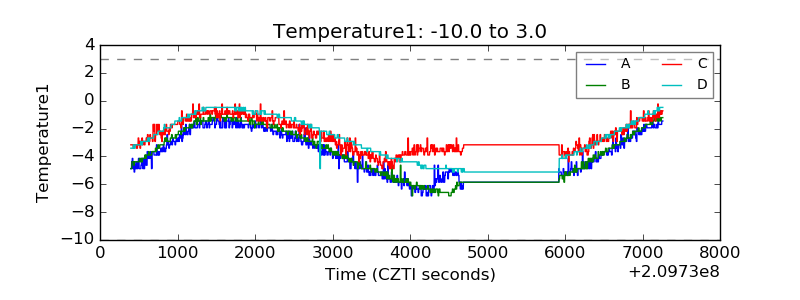 |
| Veto HV Monitor | 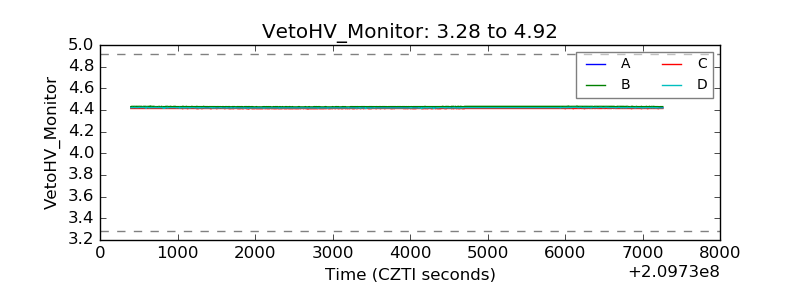 |
| Veto LLD |  |
| Alpha Counter | 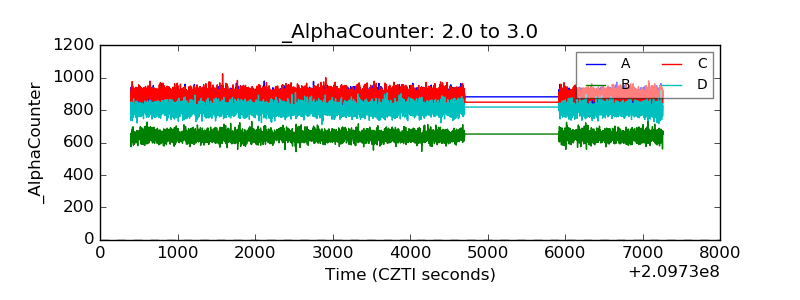 |
| _CPM_Rate | 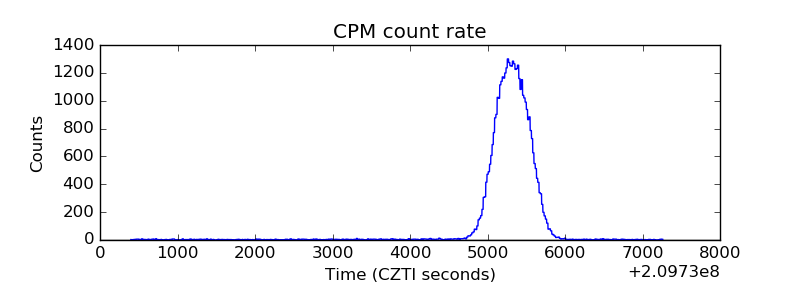 |
| CZT Counter | 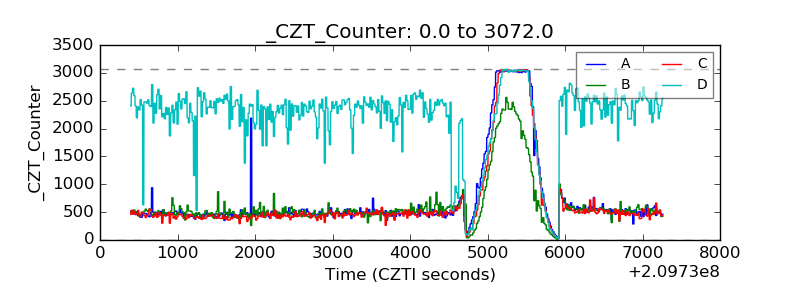 |
| +2.5 Volts monitor |  |
| +5 Volts monitor |  |
| _ROLL_ROT | 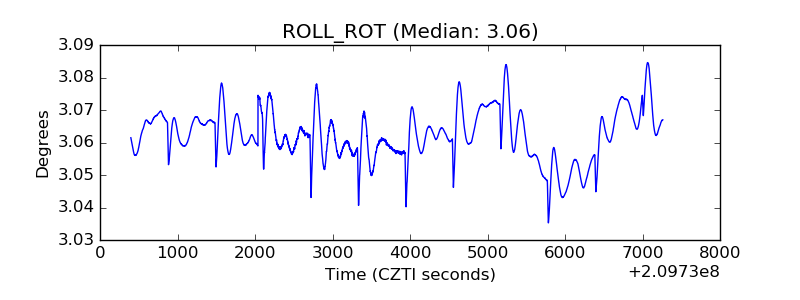 |
| _Roll_DEC | 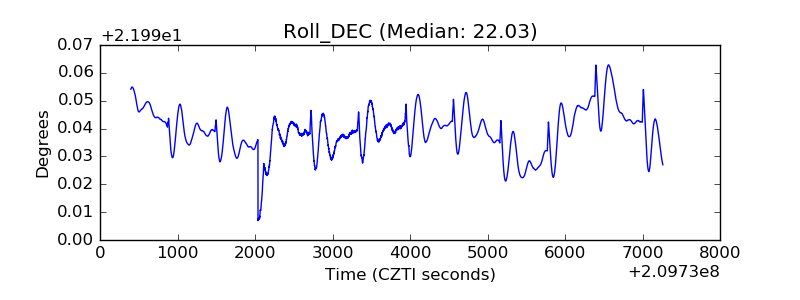 |
| _Roll_RA | 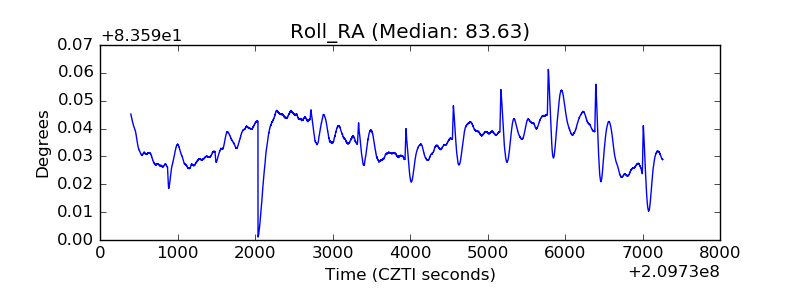 |
| Veto Counter | 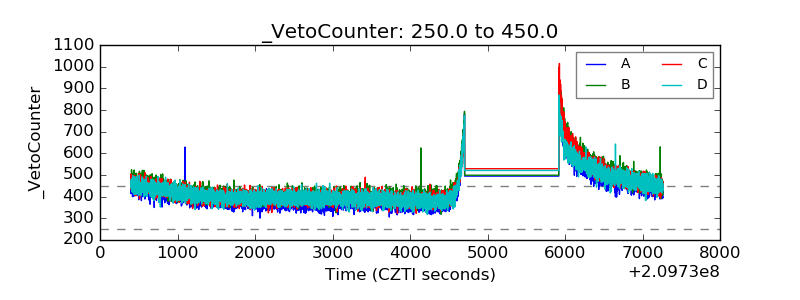 |