| Param | Original file | Final file |
|---|---|---|
| Filename | modeM0/AS1G05_237T01_9000000620_04906cztM0_level2.evt | modeM0/AS1G05_237T01_9000000620_04906cztM0_level2_quad_clean.evt |
| Size (bytes) | 811,696,320 | 62,772,480 |
| Size | 774.1 MB | 59.9 MB |
| Events in quadrant A | 3,398,362 | 425,490 |
| Events in quadrant B | 3,348,999 | 425,624 |
| Events in quadrant C | 3,083,703 | 421,896 |
| Events in quadrant D | 14,319,025 | 181,160 |
| Mode M9 | |||
|---|---|---|---|
| Quadrant | BADHDUFLAG | Total packets | Discarded packets |
| A | 0 | 12 | 0 |
| B | 0 | 12 | 0 |
| C | 0 | 12 | 0 |
| D | 0 | 12 | 0 |
| Mode SS | |||
|---|---|---|---|
| Quadrant | BADHDUFLAG | Total packets | Discarded packets |
| A | 0 | 130 | 0 |
| B | 0 | 130 | 0 |
| C | 0 | 130 | 0 |
| D | 0 | 130 | 0 |
| Mode M0 | |||
|---|---|---|---|
| Quadrant | BADHDUFLAG | Total packets | Discarded packets |
| A | 0 | 13802 | 2 |
| B | 0 | 13533 | 1 |
| C | 0 | 13068 | 1 |
| D | 0 | 46833 | 1 |
| Quadrant | Total seconds | Saturated seconds | Saturation percentage |
|---|---|---|---|
| A | 6376 | 82 | 1.286073% |
| B | 6376 | 71 | 1.113551% |
| C | 6376 | 46 | 0.721455% |
| D | 6376 | 5639 | 88.441029% |
Noise dominated data is calculated using 1-second bins in cleaned event files. If a bin has >2000 counts, and if more than 50% of those come from <1% of pixels, then it is considered to be noise-dominated and hence unusable.
| Quadrant | # 1 sec bins | Bins with >0 counts | Bins with >2000 counts | High rate bins dominated by noise | Noise dominated (total time) | Noise dominated (detector-on time) | Marked lightcurve |
|---|---|---|---|---|---|---|---|
| A | 7651 | 6376 | 3 | 3 | 0.04% | 0.05% | 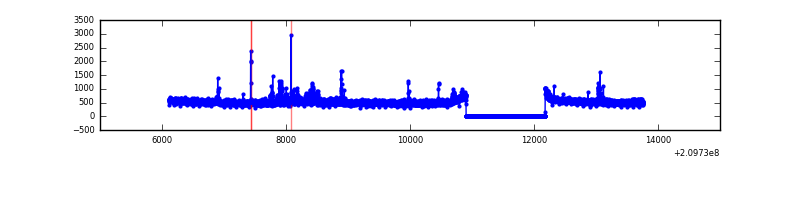 |
| B | 7651 | 6376 | 1 | 1 | 0.01% | 0.02% | 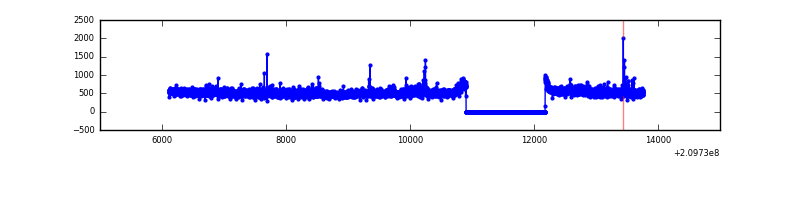 |
| C | 7651 | 6376 | 0 | 0 | 0.00% | 0.00% | 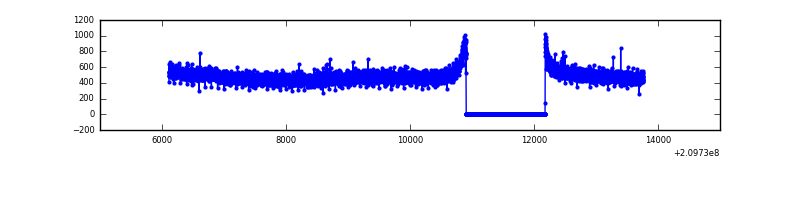 |
| D | 7650 | 6375 | 5348 | 5348 | 69.91% | 83.89% | 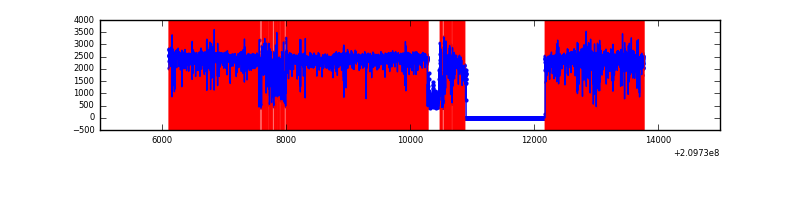 |
Top three noisy pixels from each quadrant. If the there are fewer than three noisy pixels in the level2.evt file, extra rows are filled as -1
| Pixel properties | Quadrant properties | ||||||
|---|---|---|---|---|---|---|---|
| Quadrant | DetID | PixID | Counts | Sigma | Mean | Median | Sigma |
| A | 8 | 15 | 74500 | 443.74 | 823 | 807 | 166.1 |
| A | 0 | 31 | 61041 | 362.7 | 823 | 807 | 166.1 |
| A | 13 | 251 | 49730 | 294.59 | 823 | 807 | 166.1 |
| B | 15 | 204 | 42942 | 271.69 | 820 | 804 | 155.1 |
| B | 15 | 54 | 42361 | 267.94 | 820 | 804 | 155.1 |
| B | 5 | 6 | 40906 | 258.56 | 820 | 804 | 155.1 |
| C | 13 | 61 | 6316 | 30.48 | 789 | 796 | 181.1 |
| C | 8 | 222 | 2640 | 10.18 | 789 | 796 | 181.1 |
| C | 9 | 54 | 2275 | 8.17 | 789 | 796 | 181.1 |
| D | 2 | 63 | 11704197 | 117365.51 | 396 | 384 | 99.7 |
| D | 2 | 33 | 615528 | 6168.65 | 396 | 384 | 99.7 |
| D | 2 | 234 | 95079 | 949.6 | 396 | 384 | 99.7 |
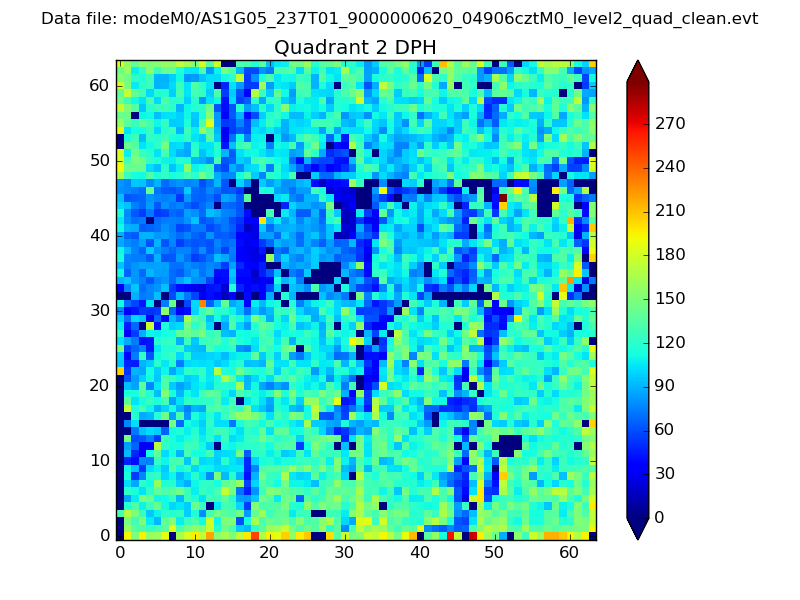
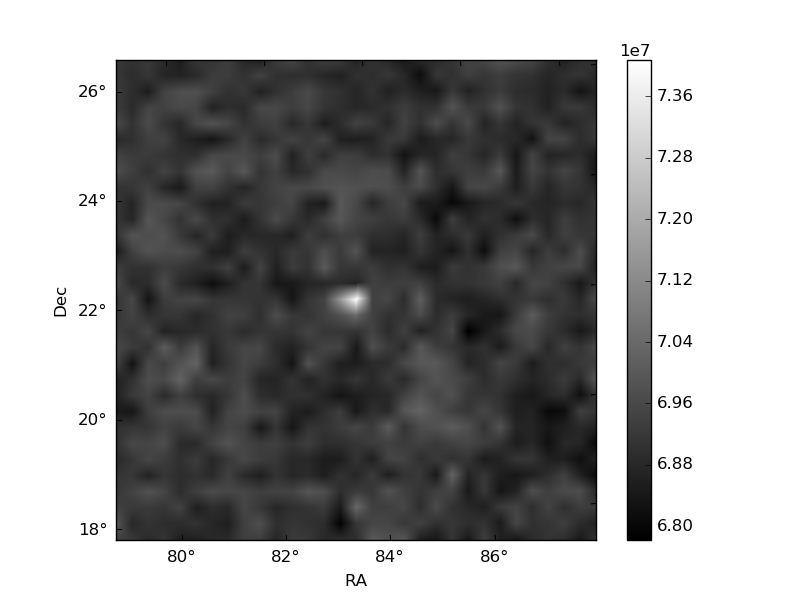
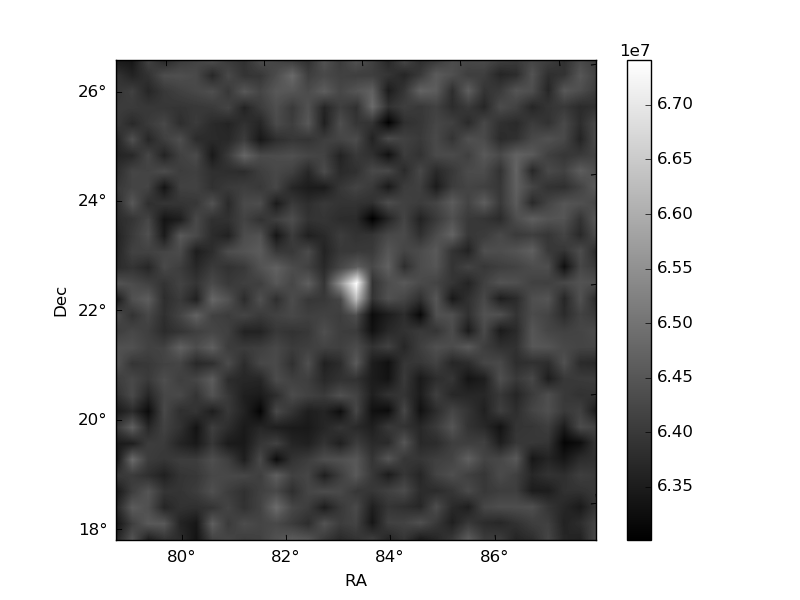
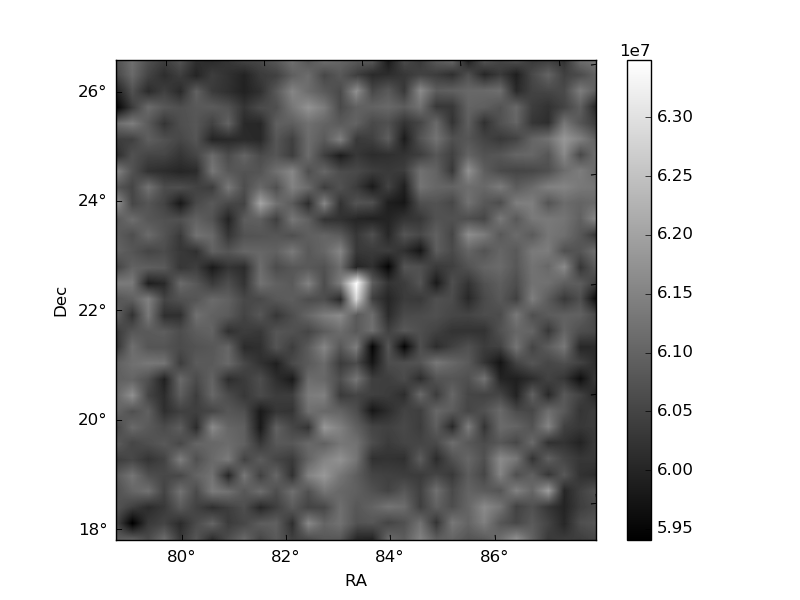
Histogram calculated using DETX and DETY for each event in the final _common_clean file
| Quadrant A |  |
 |
Quadrant B |
|---|---|---|---|
| Quadrant D | 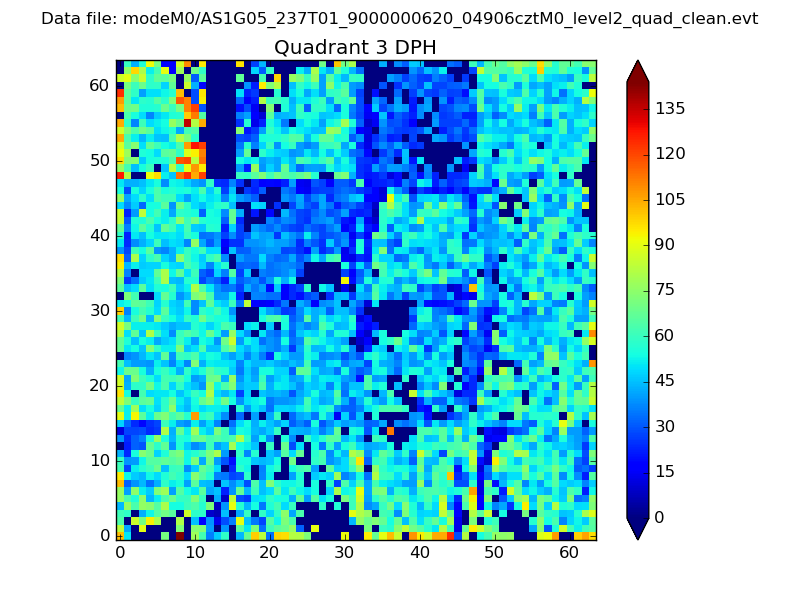 |
 |
Quadrant C |
| Plot type | Count rate plots | Images |
|---|---|---|
| Comparison with Poisson distribution Blue bars denote a histogram of data divided into 1 sec bins. Red curve is a Poisson curve with rate = median count rate of data. |
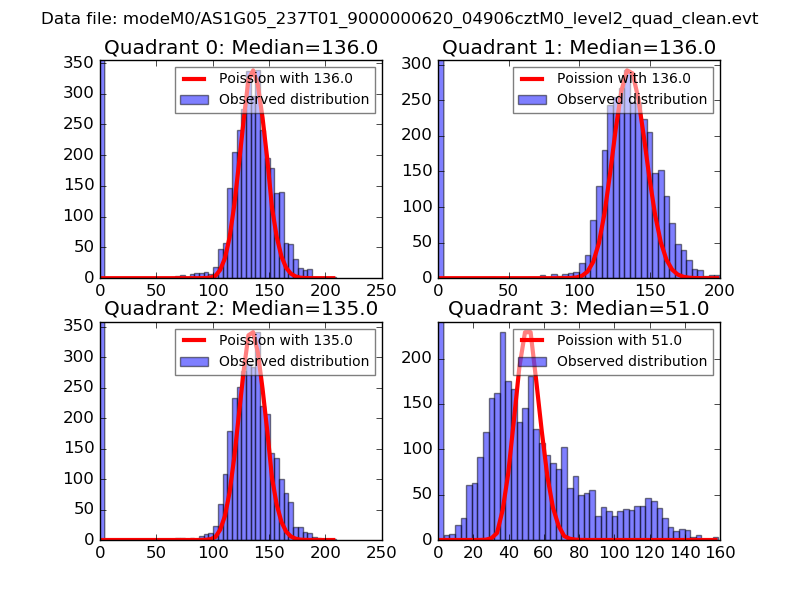 |
 |
| Quadrant-wise count rates Data is divided into 100 sec bins |
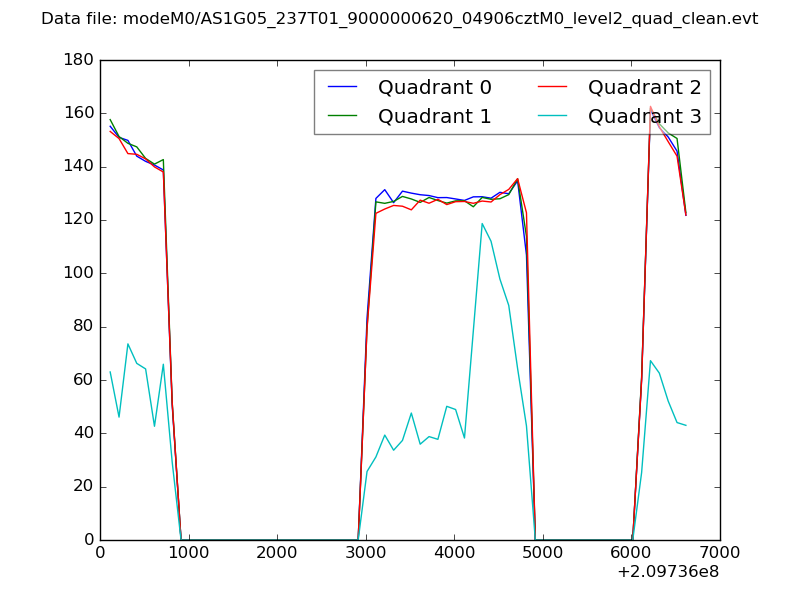 |
|
| Module-wise count rates for Quadrant A Data is divided into 100 sec bins |
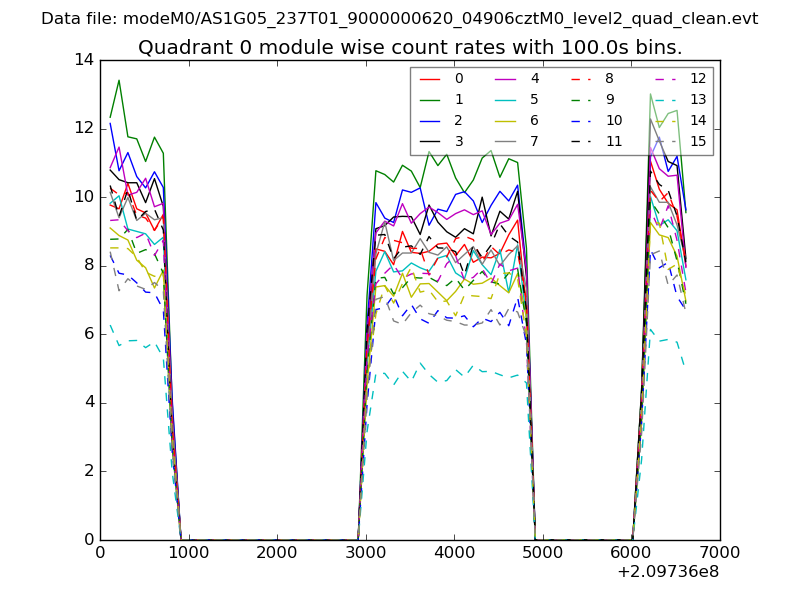 |
 |
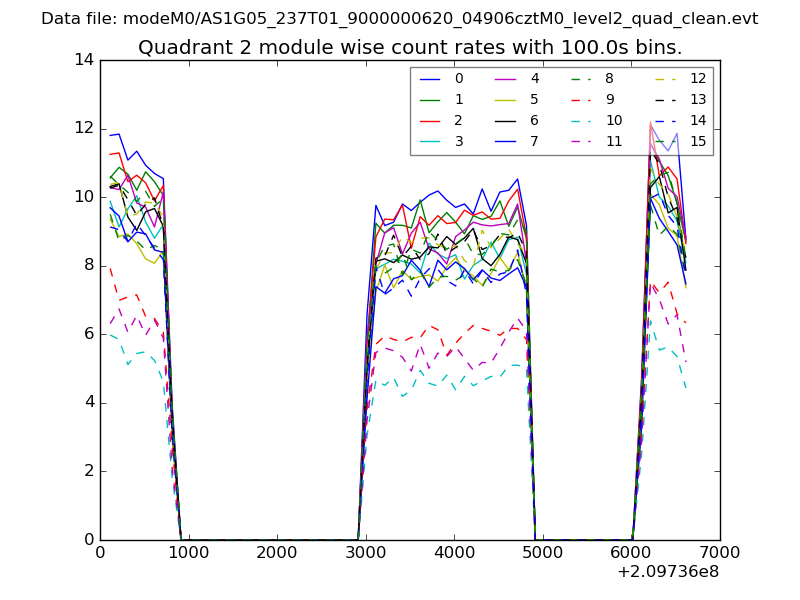
| Module-wise count rates for Quadrant B Data is divided into 100 sec bins |
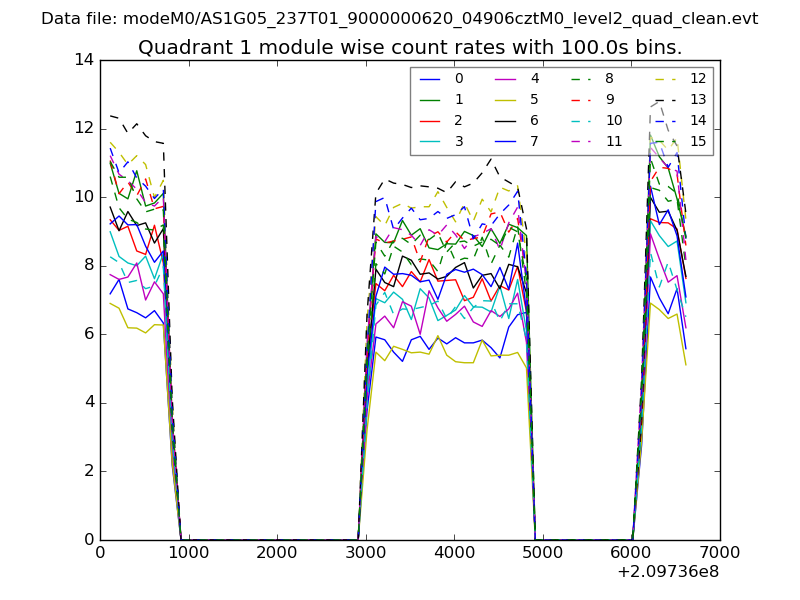 |
 |
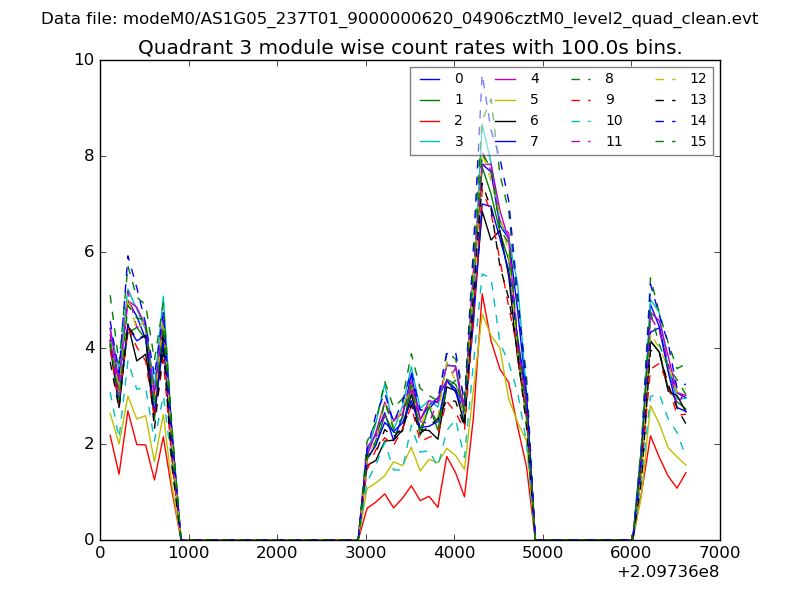
| Module-wise count rates for Quadrant C Data is divided into 100 sec bins |
 |
 |
| Module-wise count rates for Quadrant D Data is divided into 100 sec bins |
 |
 |
| Parameter | Plot |
|---|---|
| CZT HV Monitor | 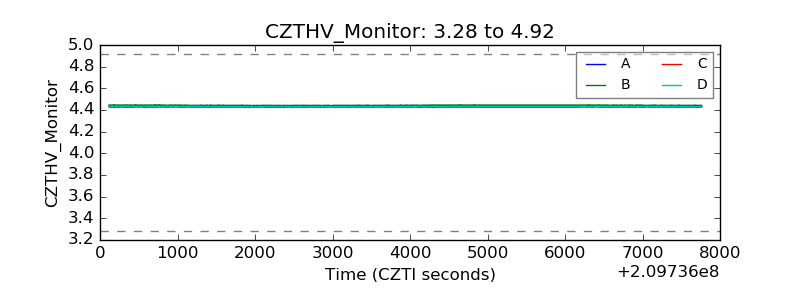 |
| D_VDD | 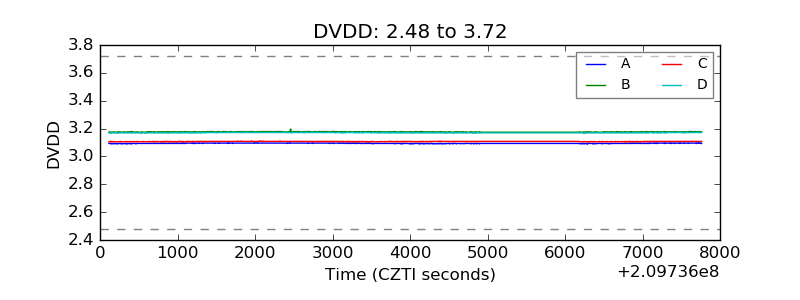 |
| Temperature 1 | 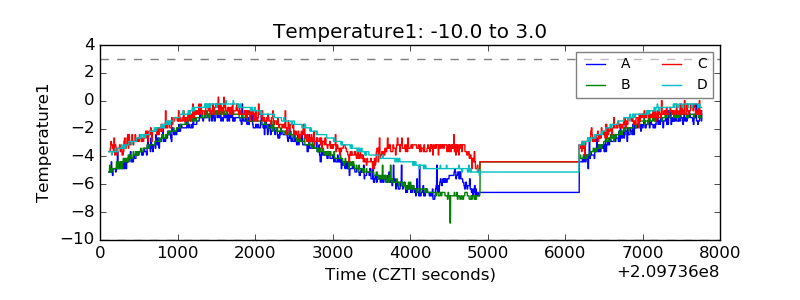 |
| Veto HV Monitor | 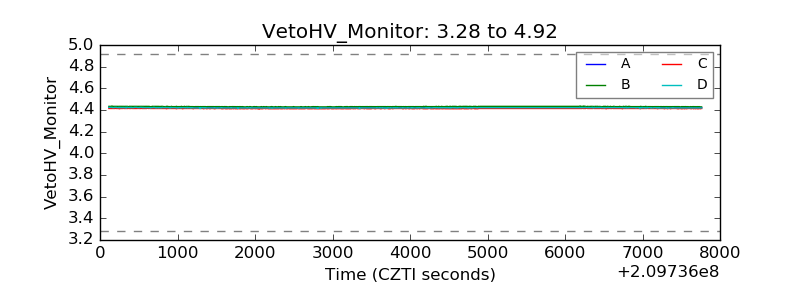 |
| Veto LLD | 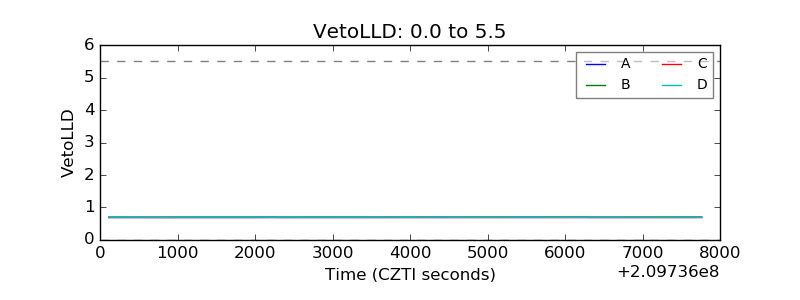 |
| Alpha Counter | 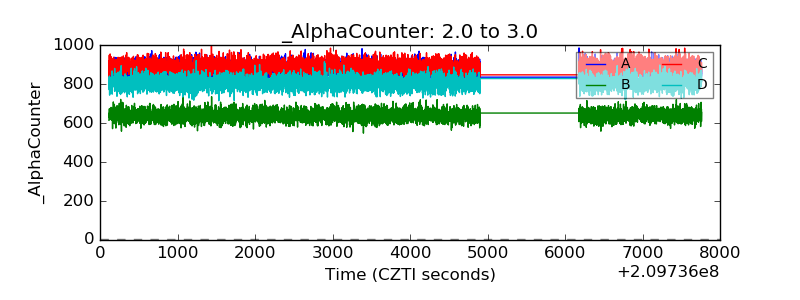 |
| _CPM_Rate | 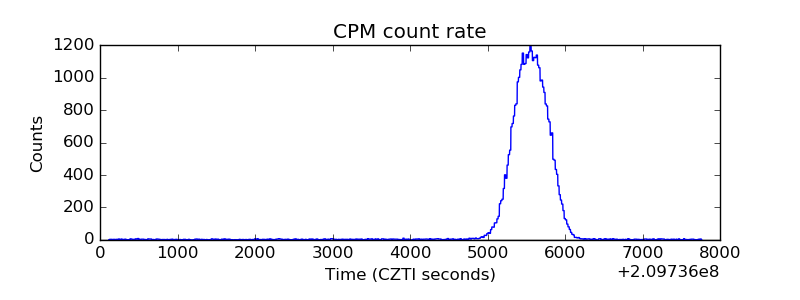 |
| CZT Counter | 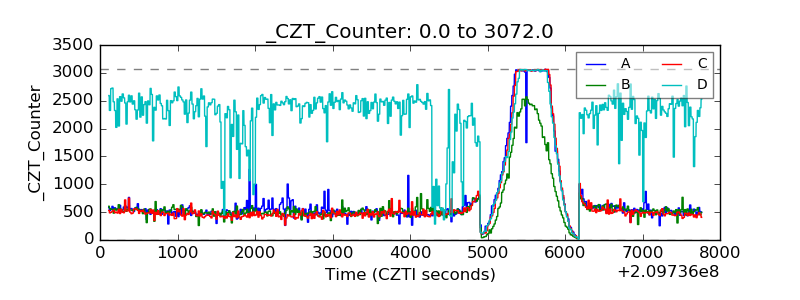 |
| +2.5 Volts monitor |  |
| +5 Volts monitor |  |
| _ROLL_ROT | 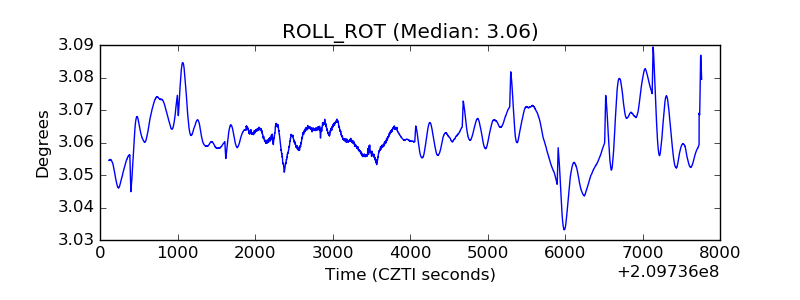 |
| _Roll_DEC | 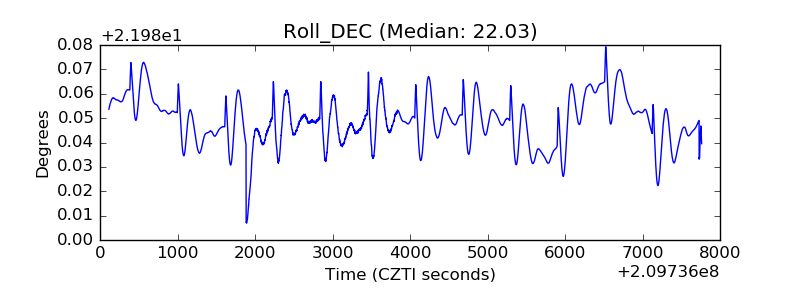 |
| _Roll_RA | 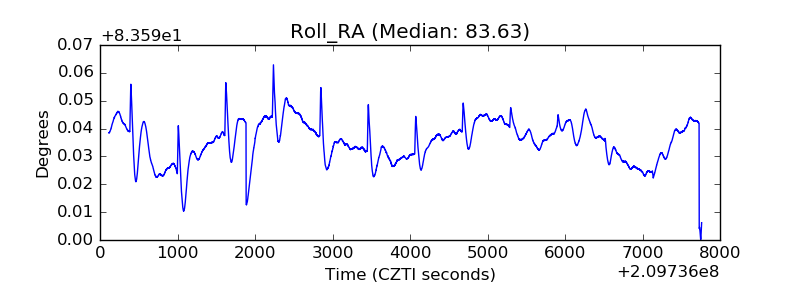 |
| Veto Counter | 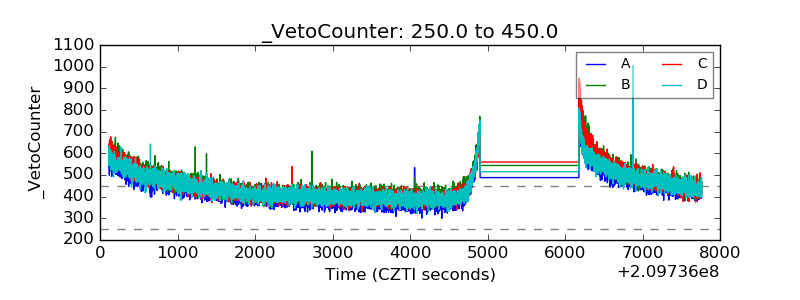 |