| Param | Original file | Final file |
|---|---|---|
| Filename | modeM0/AS1G05_237T01_9000000620_04907cztM0_level2.evt | modeM0/AS1G05_237T01_9000000620_04907cztM0_level2_quad_clean.evt |
| Size (bytes) | 813,628,800 | 53,663,040 |
| Size | 775.9 MB | 51.2 MB |
| Events in quadrant A | 3,414,184 | 354,776 |
| Events in quadrant B | 3,375,934 | 356,859 |
| Events in quadrant C | 3,095,714 | 350,195 |
| Events in quadrant D | 14,321,633 | 115,301 |
| Mode M9 | |||
|---|---|---|---|
| Quadrant | BADHDUFLAG | Total packets | Discarded packets |
| A | 0 | 13 | 0 |
| B | 0 | 13 | 0 |
| C | 0 | 13 | 0 |
| D | 0 | 13 | 0 |
| Mode SS | |||
|---|---|---|---|
| Quadrant | BADHDUFLAG | Total packets | Discarded packets |
| A | 0 | 128 | 0 |
| B | 0 | 128 | 0 |
| C | 0 | 128 | 0 |
| D | 0 | 128 | 0 |
| Mode M0 | |||
|---|---|---|---|
| Quadrant | BADHDUFLAG | Total packets | Discarded packets |
| A | 0 | 13994 | 2 |
| B | 0 | 13761 | 1 |
| C | 0 | 13177 | 1 |
| D | 0 | 46821 | 1 |
| Quadrant | Total seconds | Saturated seconds | Saturation percentage |
|---|---|---|---|
| A | 6398 | 139 | 2.172554% |
| B | 6398 | 109 | 1.703657% |
| C | 6398 | 73 | 1.140982% |
| D | 6398 | 5796 | 90.590810% |
Noise dominated data is calculated using 1-second bins in cleaned event files. If a bin has >2000 counts, and if more than 50% of those come from <1% of pixels, then it is considered to be noise-dominated and hence unusable.
| Quadrant | # 1 sec bins | Bins with >0 counts | Bins with >2000 counts | High rate bins dominated by noise | Noise dominated (total time) | Noise dominated (detector-on time) | Marked lightcurve |
|---|---|---|---|---|---|---|---|
| A | 7638 | 6398 | 19 | 19 | 0.25% | 0.30% | 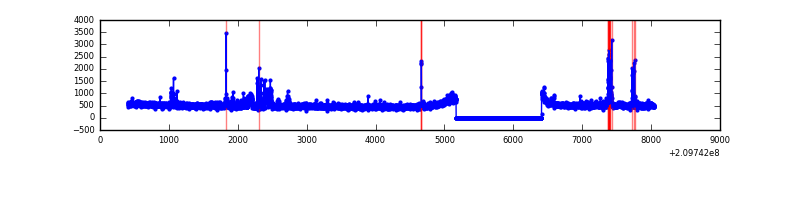 |
| B | 7638 | 6398 | 5 | 5 | 0.07% | 0.08% | 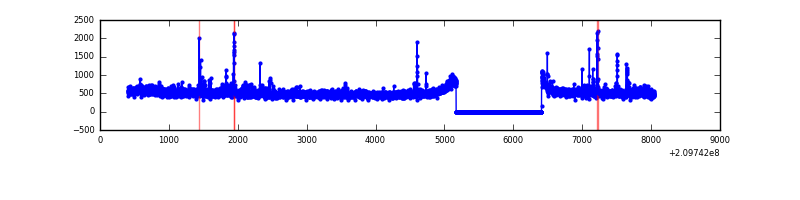 |
| C | 7638 | 6398 | 0 | 0 | 0.00% | 0.00% |  |
| D | 7638 | 6398 | 5299 | 5299 | 69.38% | 82.82% | 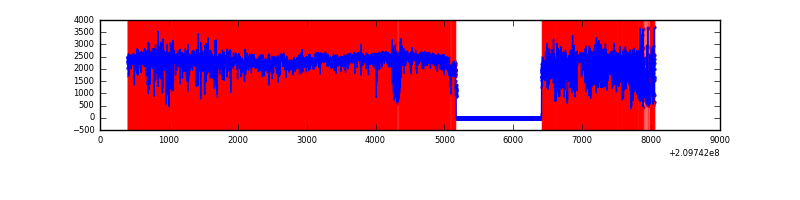 |
Top three noisy pixels from each quadrant. If the there are fewer than three noisy pixels in the level2.evt file, extra rows are filled as -1
| Pixel properties | Quadrant properties | ||||||
|---|---|---|---|---|---|---|---|
| Quadrant | DetID | PixID | Counts | Sigma | Mean | Median | Sigma |
| A | 8 | 15 | 131761 | 789.69 | 819 | 802 | 165.8 |
| A | 0 | 31 | 93765 | 560.57 | 819 | 802 | 165.8 |
| A | 0 | 50 | 20318 | 117.68 | 819 | 802 | 165.8 |
| B | 15 | 54 | 59494 | 375.87 | 821 | 805 | 156.1 |
| B | 15 | 204 | 53761 | 339.15 | 821 | 805 | 156.1 |
| B | 4 | 239 | 36081 | 225.92 | 821 | 805 | 156.1 |
| C | 13 | 61 | 6579 | 31.63 | 790 | 796 | 182.8 |
| C | 1 | 16 | 6439 | 30.87 | 790 | 796 | 182.8 |
| C | 8 | 222 | 3165 | 12.96 | 790 | 796 | 182.8 |
| D | 2 | 63 | 11729400 | 123315.44 | 384 | 373 | 95.1 |
| D | 2 | 33 | 452135 | 4749.69 | 384 | 373 | 95.1 |
| D | 2 | 234 | 191828 | 2012.9 | 384 | 373 | 95.1 |
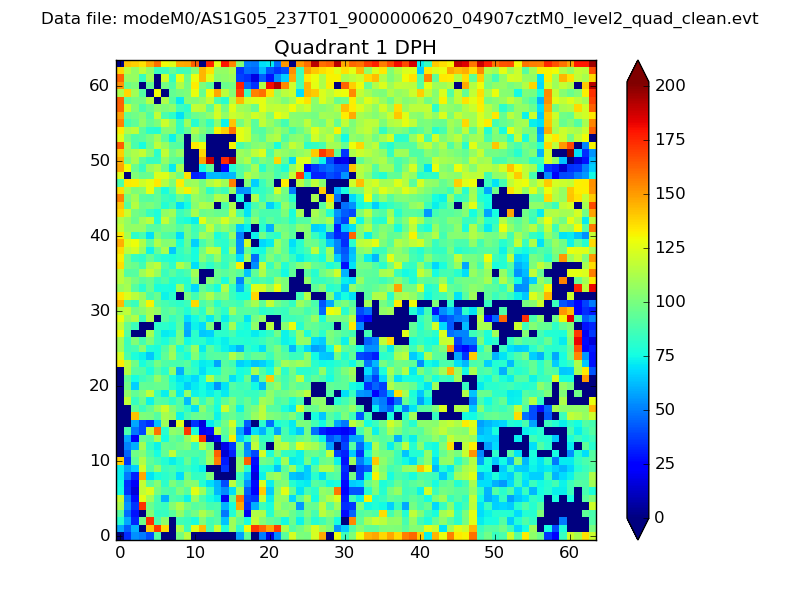
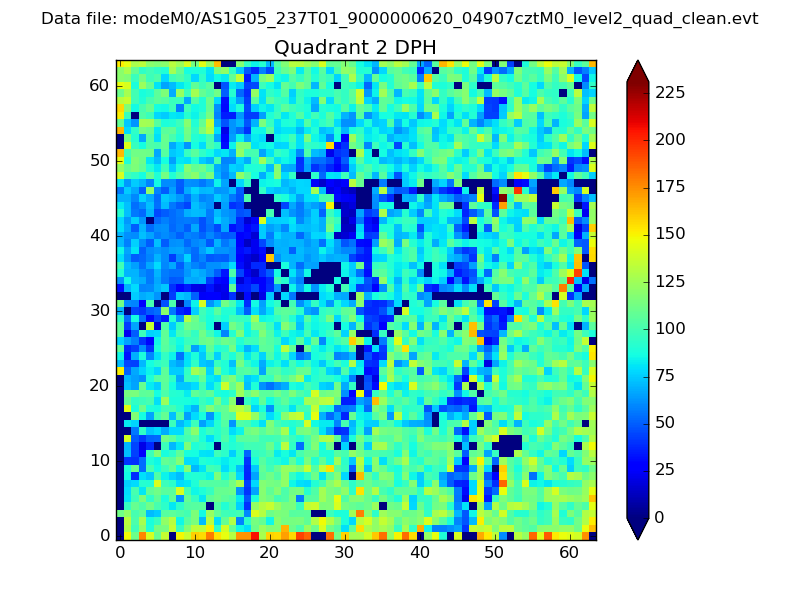
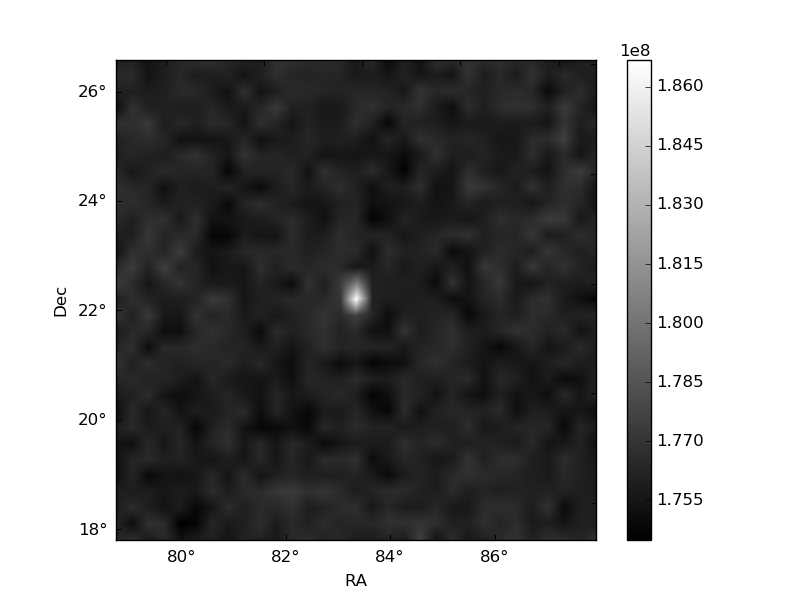
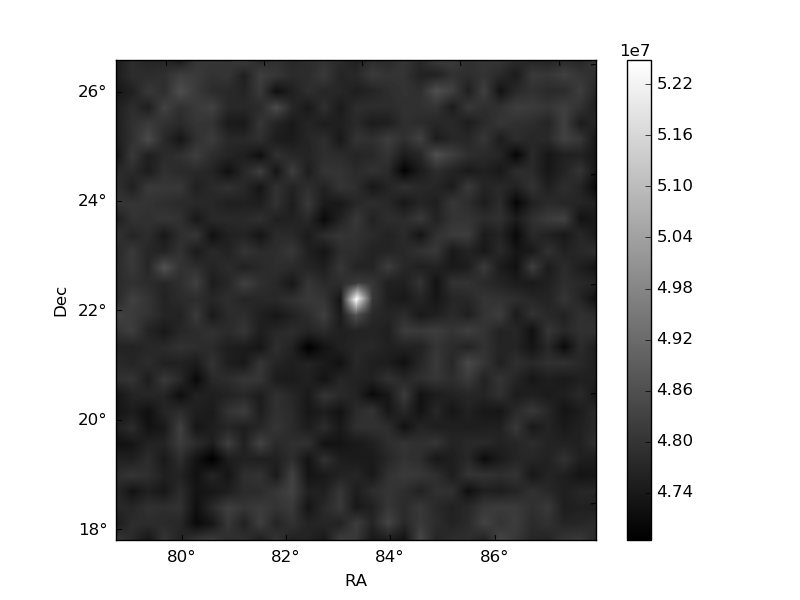
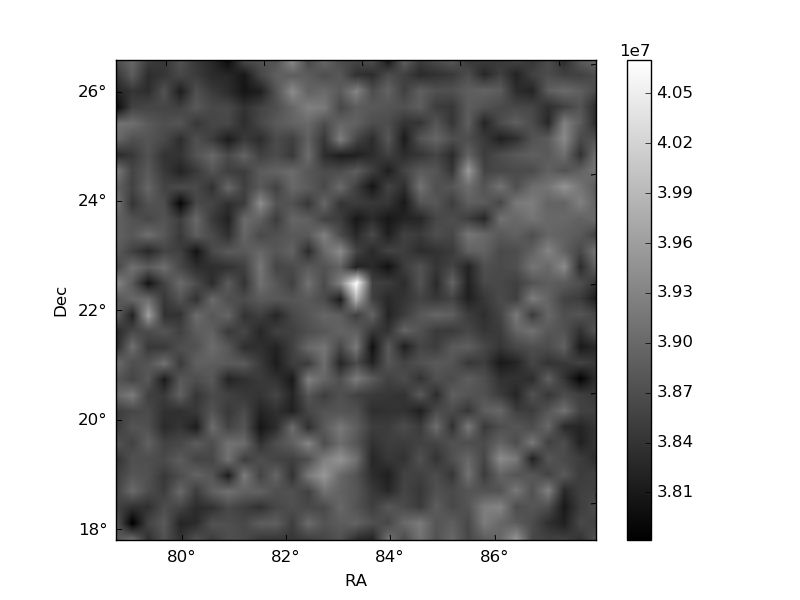
Histogram calculated using DETX and DETY for each event in the final _common_clean file
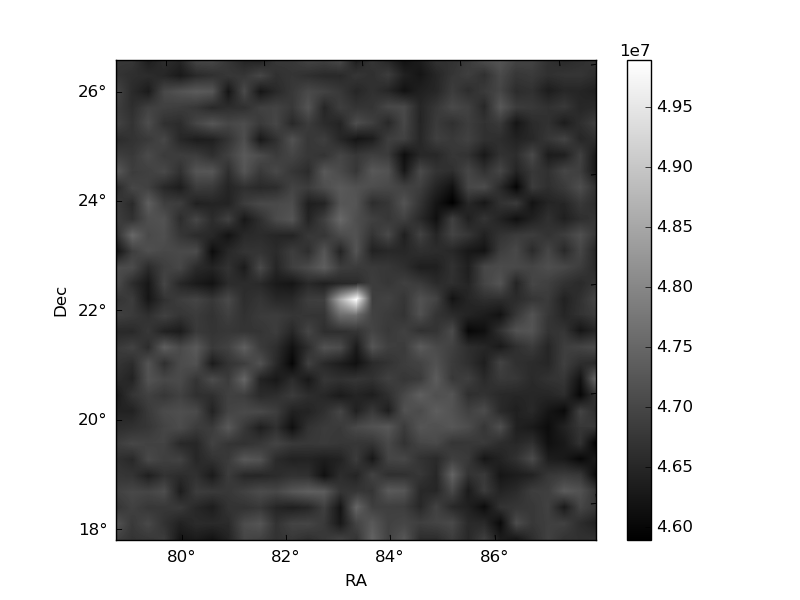
| Quadrant A | 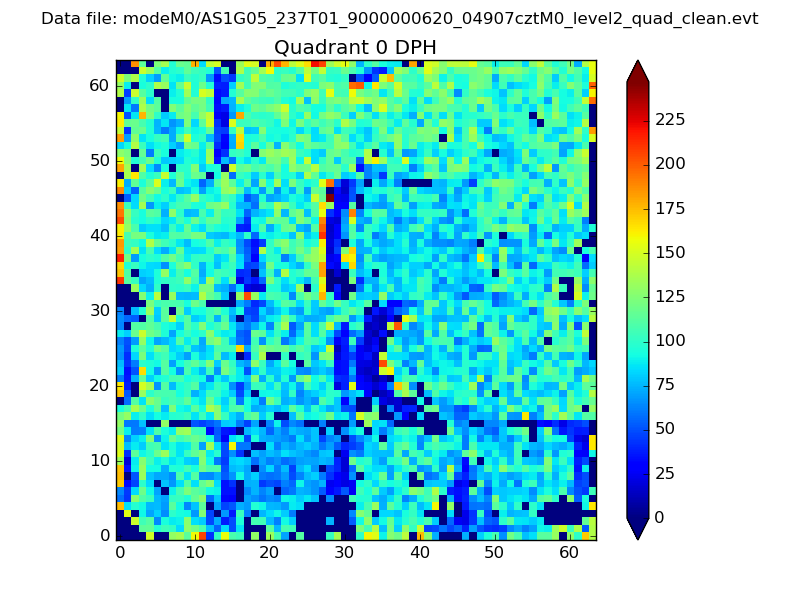 |
 |
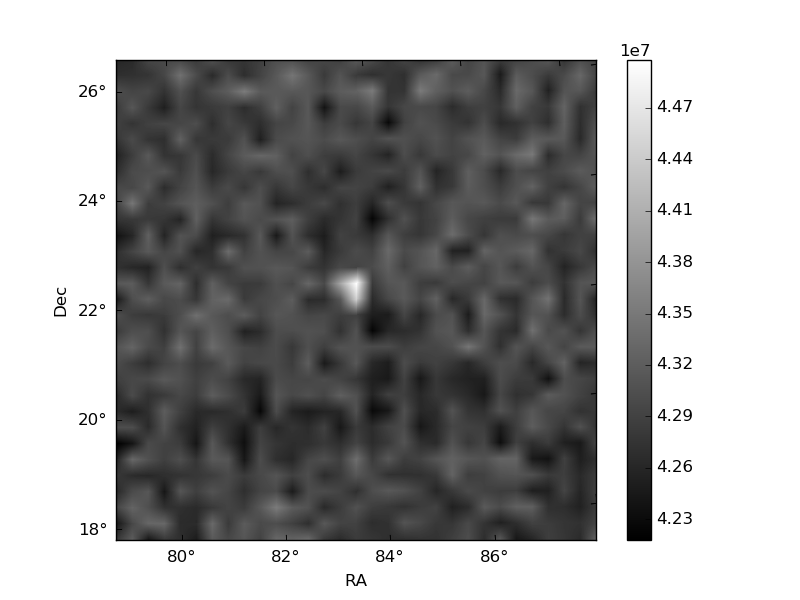
Quadrant B |
|---|---|---|---|
| Quadrant D | 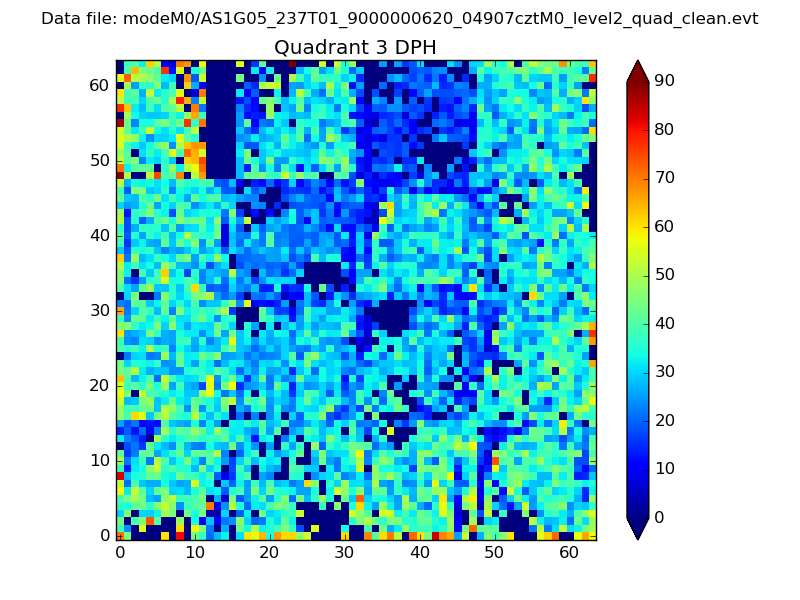 |
 |
Quadrant C |
| Plot type | Count rate plots | Images |
|---|---|---|
| Comparison with Poisson distribution Blue bars denote a histogram of data divided into 1 sec bins. Red curve is a Poisson curve with rate = median count rate of data. |
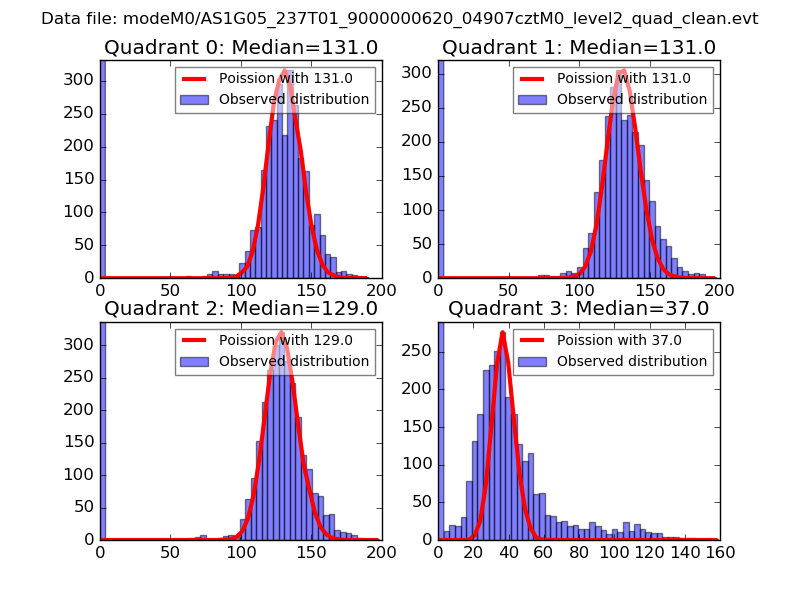 |
 |
| Quadrant-wise count rates Data is divided into 100 sec bins |
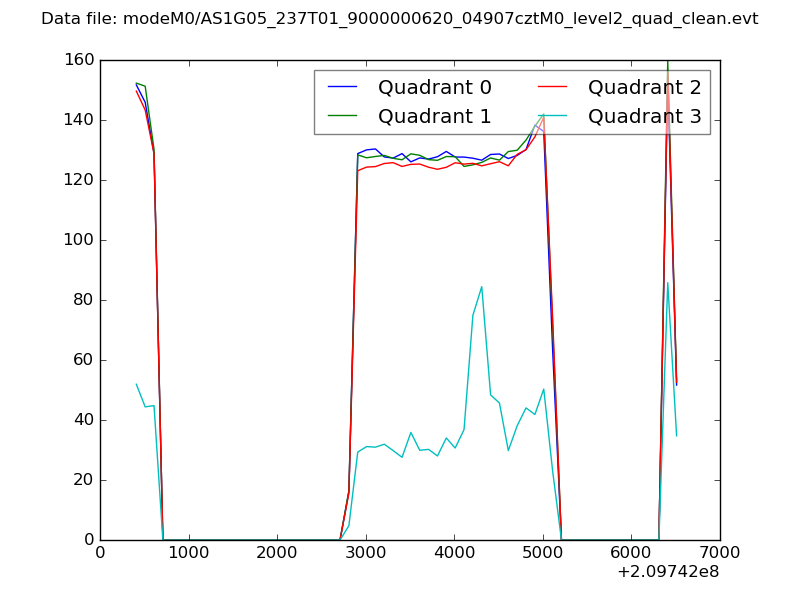 |
|
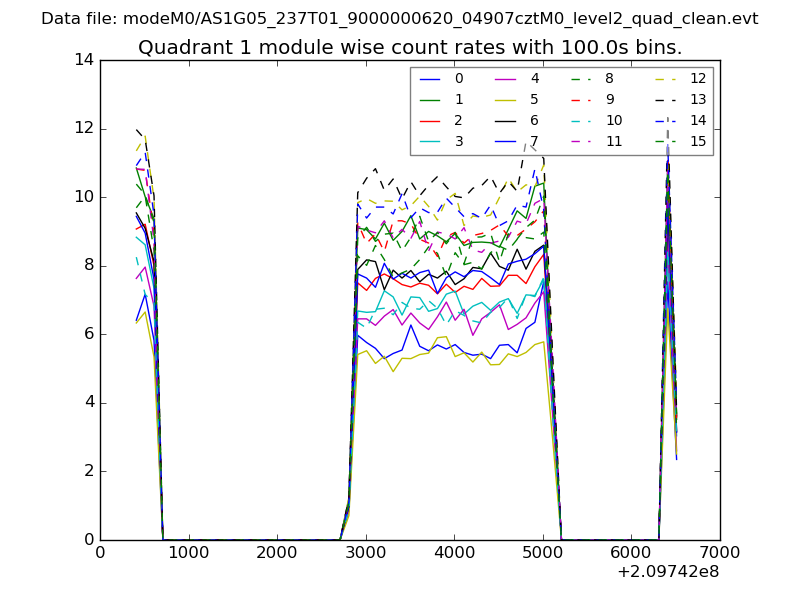
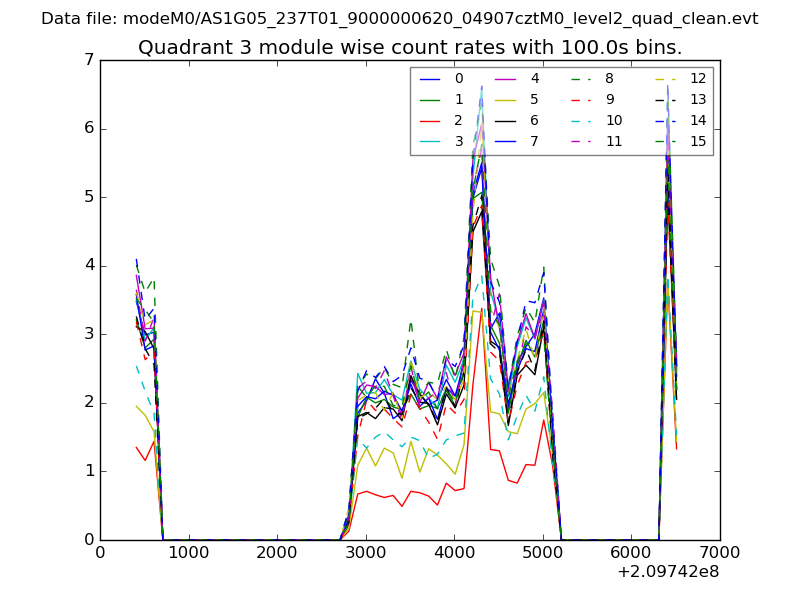
| Module-wise count rates for Quadrant A Data is divided into 100 sec bins |
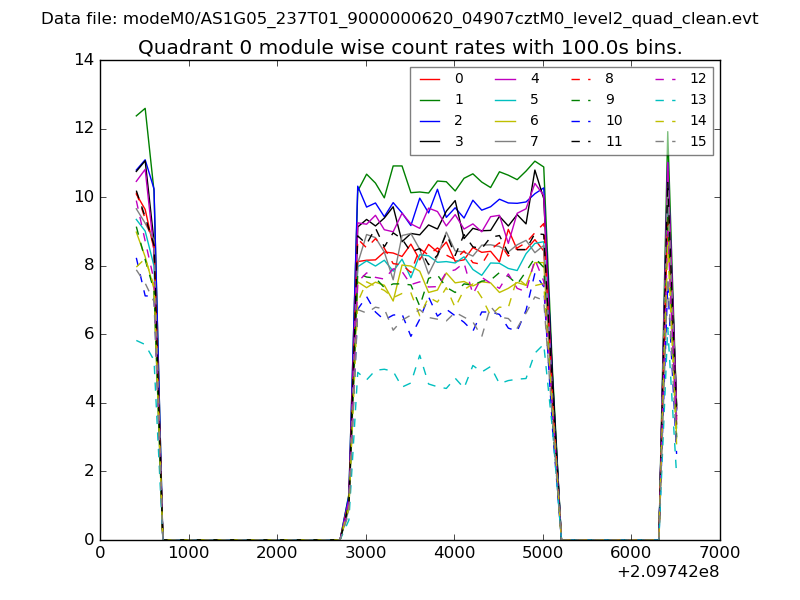 |
 |
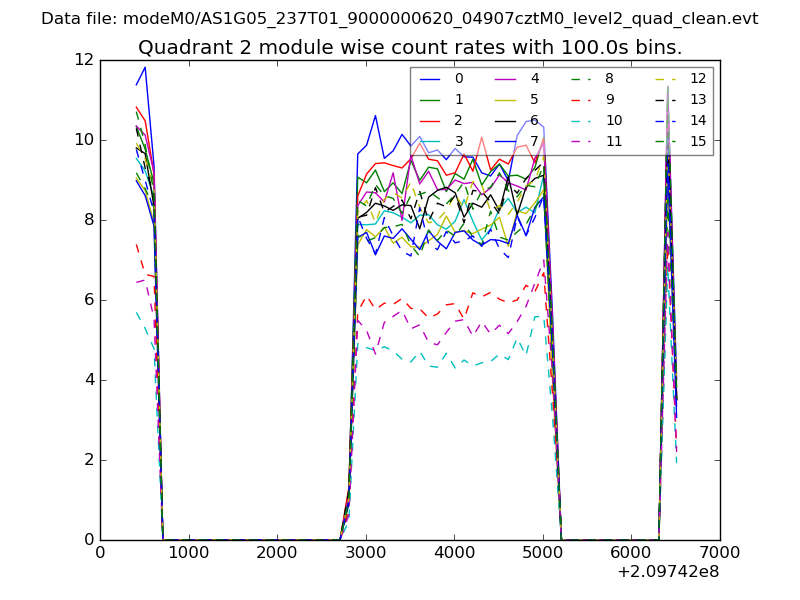
| Module-wise count rates for Quadrant B Data is divided into 100 sec bins |
 |
 |
| Module-wise count rates for Quadrant C Data is divided into 100 sec bins |
 |
 |
| Module-wise count rates for Quadrant D Data is divided into 100 sec bins |
 |
 |
| Parameter | Plot |
|---|---|
| CZT HV Monitor | 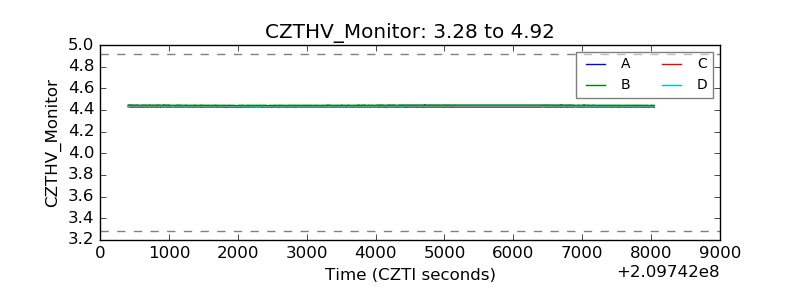 |
| D_VDD |  |
| Temperature 1 | 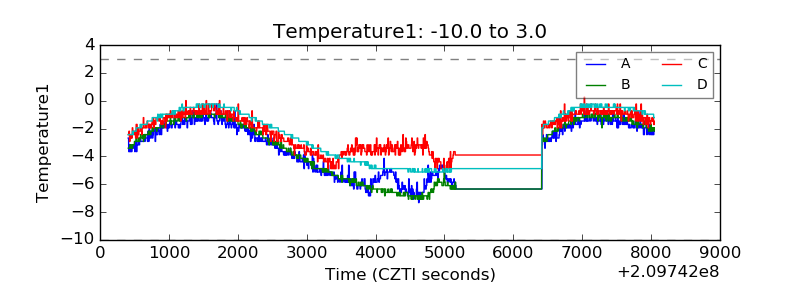 |
| Veto HV Monitor | 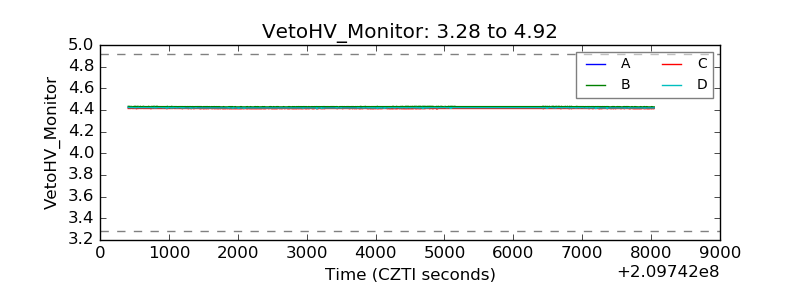 |
| Veto LLD | 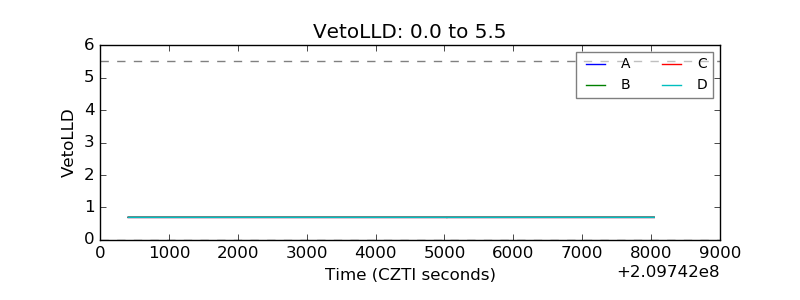 |
| Alpha Counter | 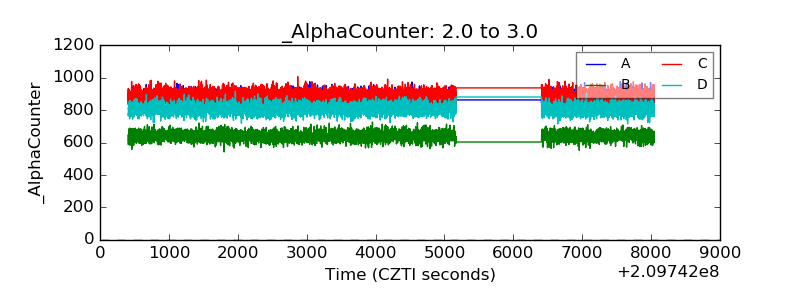 |
| _CPM_Rate | 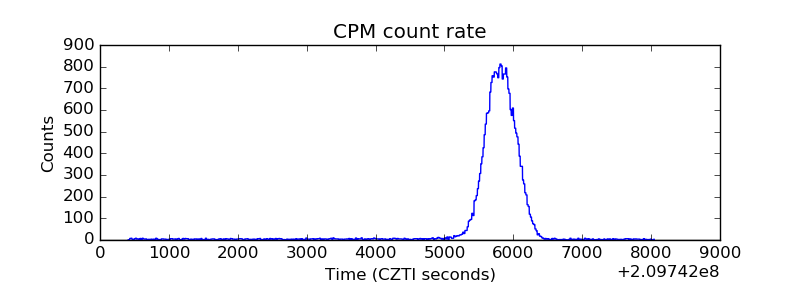 |
| CZT Counter | 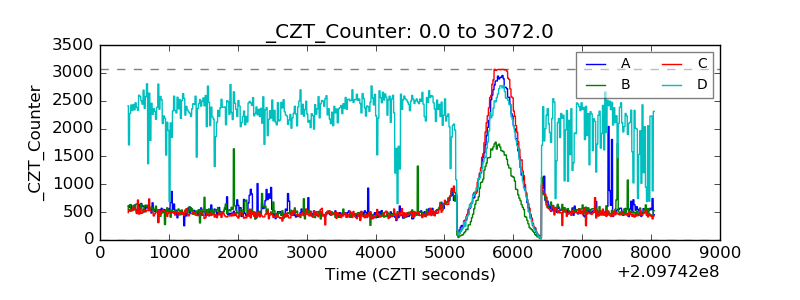 |
| +2.5 Volts monitor |  |
| +5 Volts monitor |  |
| _ROLL_ROT | 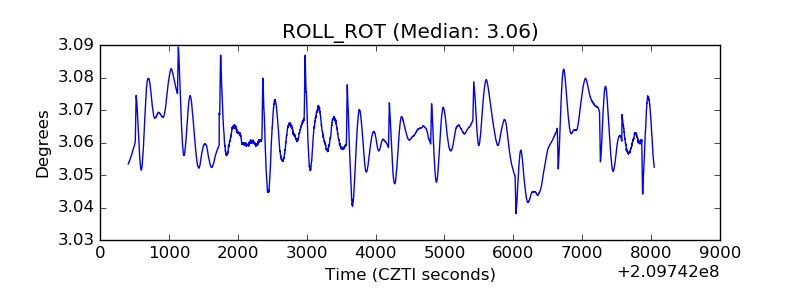 |
| _Roll_DEC |  |
| _Roll_RA | 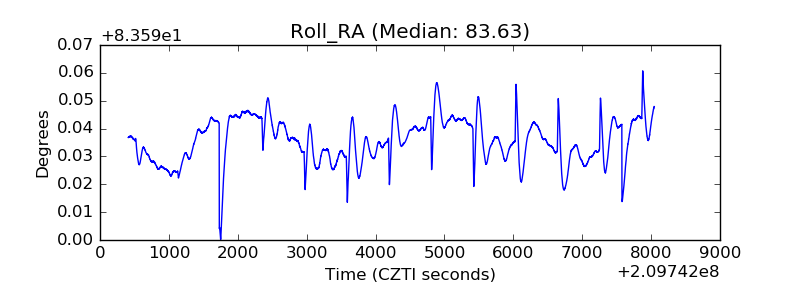 |
| Veto Counter | 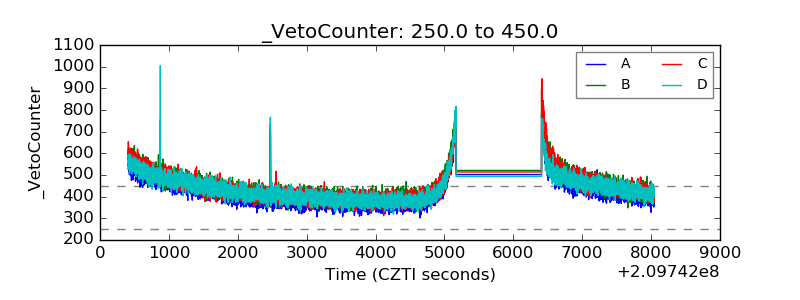 |