| Param | Original file | Final file |
|---|---|---|
| Filename | modeM0/AS1G05_237T01_9000000620_04908cztM0_level2.evt | modeM0/AS1G05_237T01_9000000620_04908cztM0_level2_quad_clean.evt |
| Size (bytes) | 499,821,120 | 53,089,920 |
| Size | 476.7 MB | 50.6 MB |
| Events in quadrant A | 2,738,107 | 334,405 |
| Events in quadrant B | 2,327,327 | 336,042 |
| Events in quadrant C | 2,186,974 | 334,790 |
| Events in quadrant D | 7,563,749 | 269,891 |
| Mode SS | |||
|---|---|---|---|
| Quadrant | BADHDUFLAG | Total packets | Discarded packets |
| A | 0 | 94 | 0 |
| B | 0 | 94 | 0 |
| C | 0 | 94 | 0 |
| D | 0 | 94 | 0 |
| Mode M0 | |||
|---|---|---|---|
| Quadrant | BADHDUFLAG | Total packets | Discarded packets |
| A | 0 | 11073 | 0 |
| B | 0 | 9835 | 0 |
| C | 0 | 9588 | 0 |
| D | 0 | 25713 | 0 |
| Quadrant | Total seconds | Saturated seconds | Saturation percentage |
|---|---|---|---|
| A | 4724 | 60 | 1.270110% |
| B | 4724 | 15 | 0.317528% |
| C | 4724 | 0 | 0.000000% |
| D | 4724 | 2270 | 48.052498% |
Noise dominated data is calculated using 1-second bins in cleaned event files. If a bin has >2000 counts, and if more than 50% of those come from <1% of pixels, then it is considered to be noise-dominated and hence unusable.
| Quadrant | # 1 sec bins | Bins with >0 counts | Bins with >2000 counts | High rate bins dominated by noise | Noise dominated (total time) | Noise dominated (detector-on time) | Marked lightcurve |
|---|---|---|---|---|---|---|---|
| A | 4724 | 4724 | 66 | 66 | 1.40% | 1.40% | 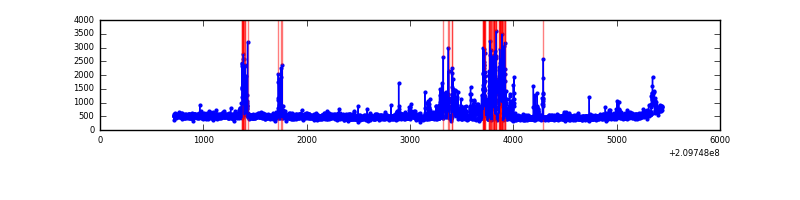 |
| B | 4724 | 4724 | 6 | 6 | 0.13% | 0.13% | 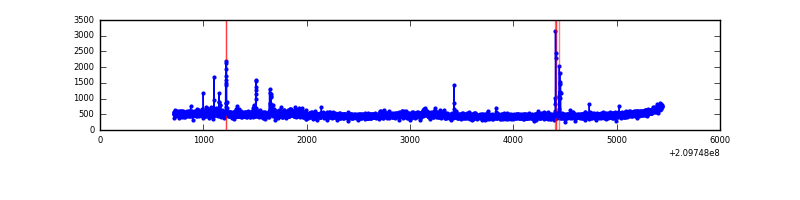 |
| C | 4724 | 4724 | 0 | 0 | 0.00% | 0.00% | 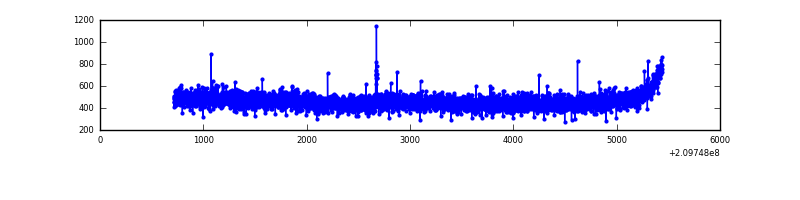 |
| D | 4724 | 4724 | 1934 | 1934 | 40.94% | 40.94% | 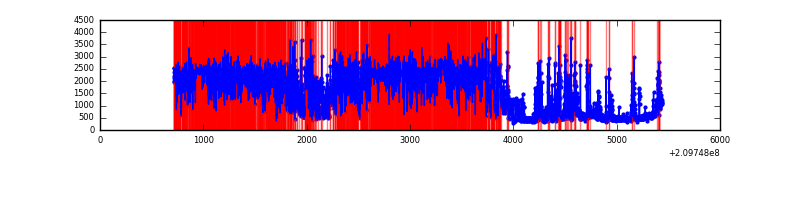 |
Top three noisy pixels from each quadrant. If the there are fewer than three noisy pixels in the level2.evt file, extra rows are filled as -1
| Pixel properties | Quadrant properties | ||||||
|---|---|---|---|---|---|---|---|
| Quadrant | DetID | PixID | Counts | Sigma | Mean | Median | Sigma |
| A | 8 | 15 | 418080 | 3568.49 | 570 | 559 | 117.0 |
| A | 13 | 251 | 92049 | 781.95 | 570 | 559 | 117.0 |
| A | 0 | 31 | 26473 | 221.48 | 570 | 559 | 117.0 |
| B | 15 | 204 | 29656 | 266.53 | 575 | 565 | 109.1 |
| B | 15 | 54 | 27803 | 249.55 | 575 | 565 | 109.1 |
| B | 4 | 48 | 18398 | 163.38 | 575 | 565 | 109.1 |
| C | 1 | 16 | 7567 | 54.0 | 556 | 560 | 129.8 |
| C | 12 | 4 | 6292 | 44.17 | 556 | 560 | 129.8 |
| C | 13 | 61 | 4620 | 31.29 | 556 | 560 | 129.8 |
| D | 2 | 63 | 4915021 | 43142.58 | 455 | 441 | 113.9 |
| D | 2 | 33 | 272757 | 2390.52 | 455 | 441 | 113.9 |
| D | 2 | 136 | 217208 | 1902.89 | 455 | 441 | 113.9 |
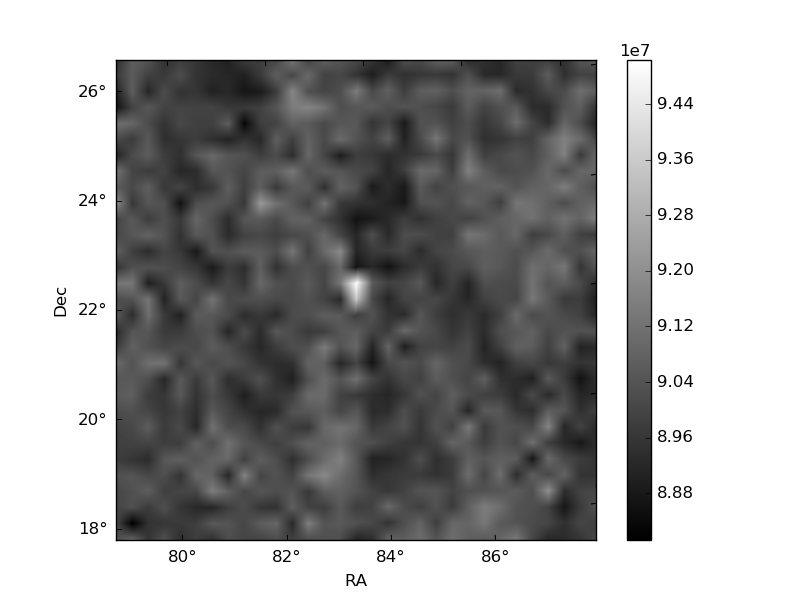
Histogram calculated using DETX and DETY for each event in the final _common_clean file
| Quadrant A | 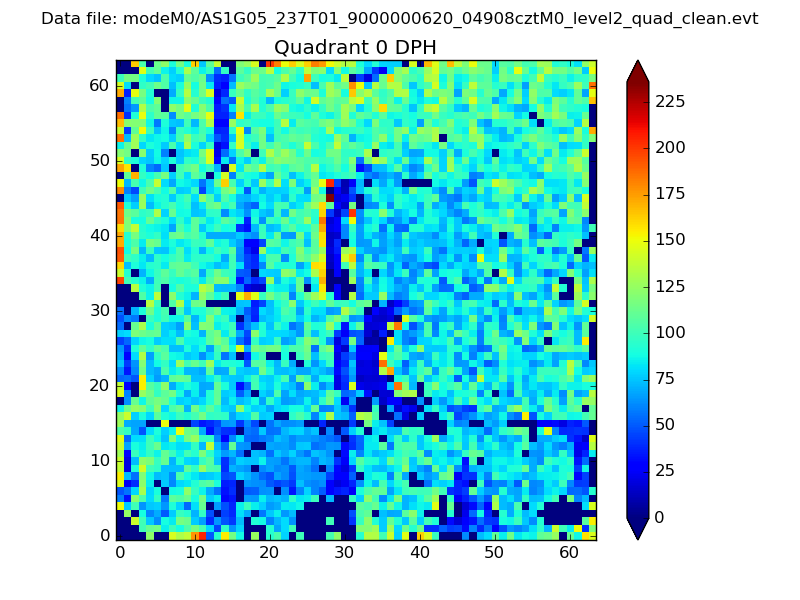 |
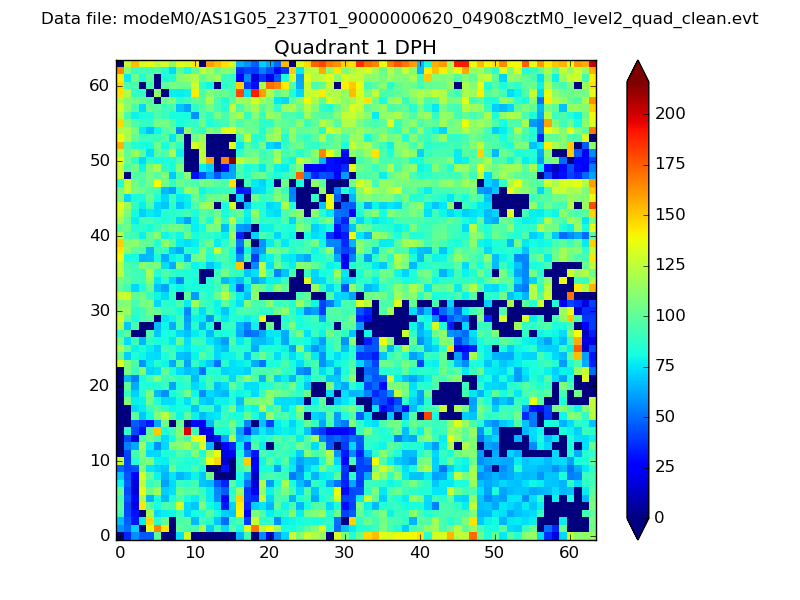 |
Quadrant B |
|---|---|---|---|
| Quadrant D | 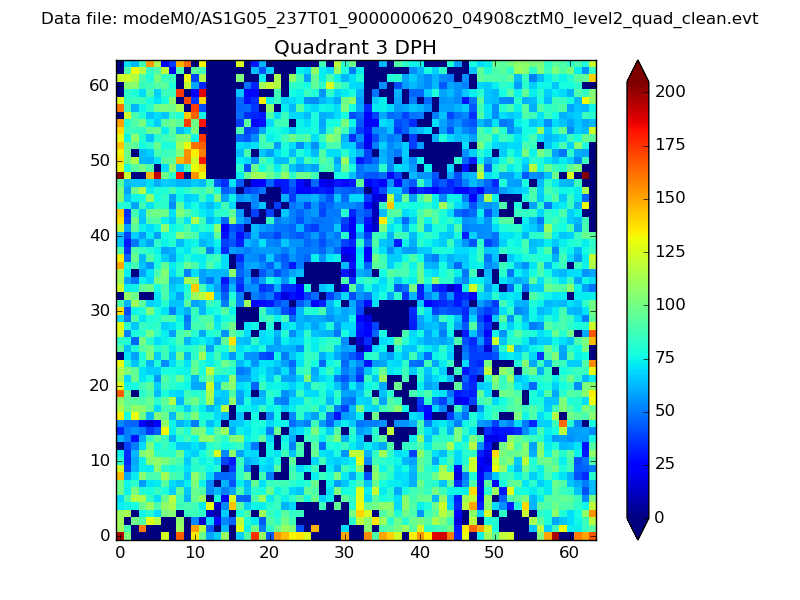 |
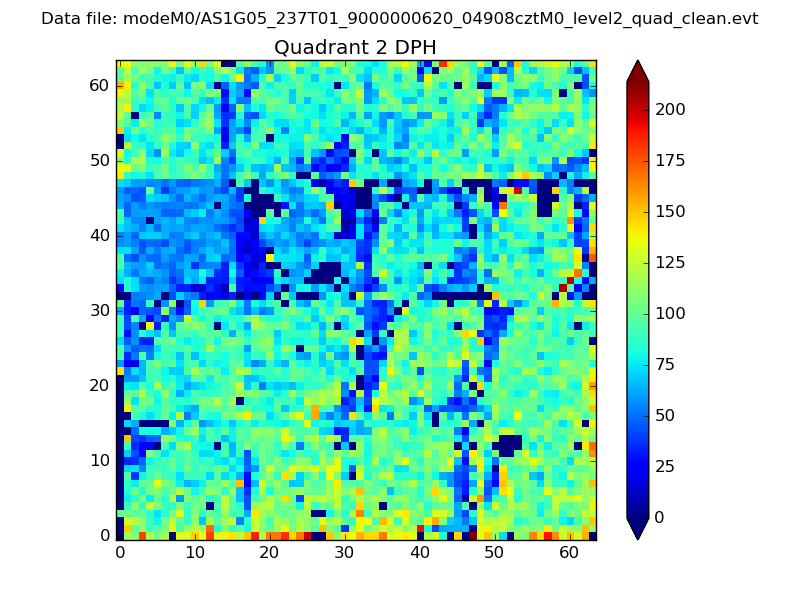 |
Quadrant C |
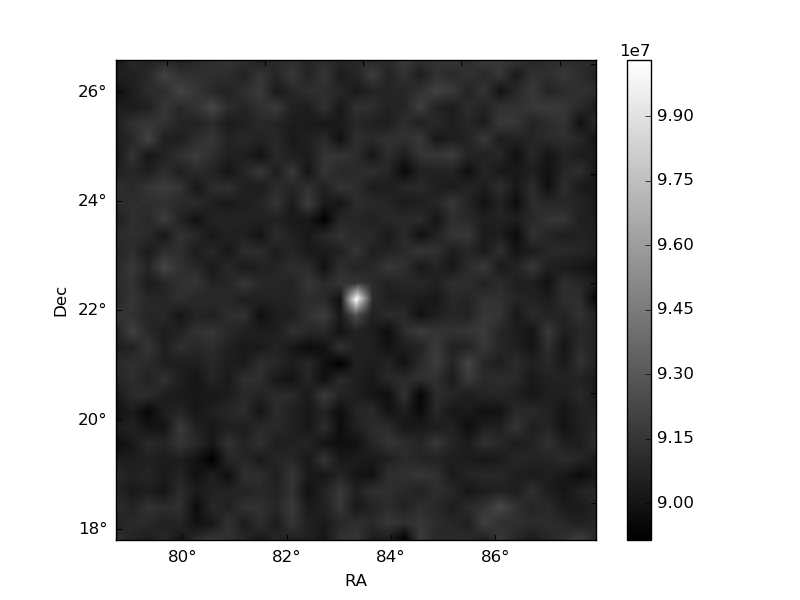
| Plot type | Count rate plots | Images |
|---|---|---|
| Comparison with Poisson distribution Blue bars denote a histogram of data divided into 1 sec bins. Red curve is a Poisson curve with rate = median count rate of data. |
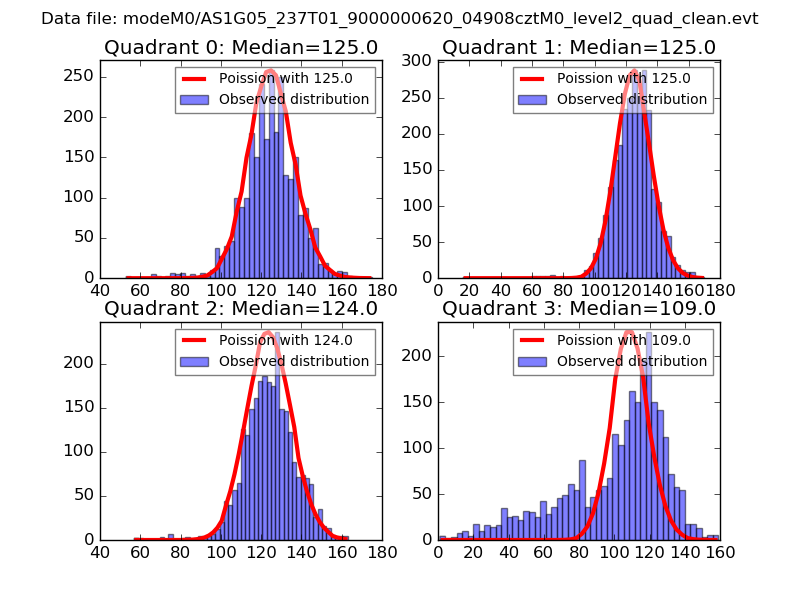 |
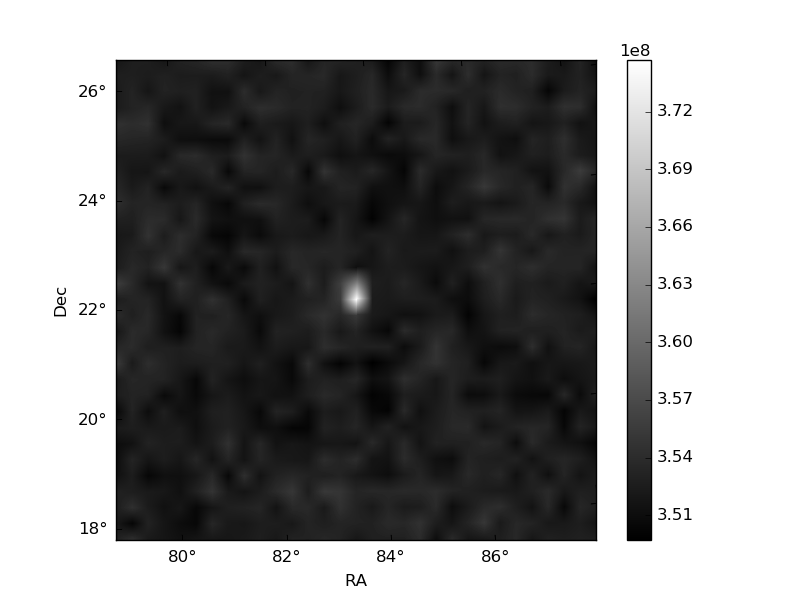 |
| Quadrant-wise count rates Data is divided into 100 sec bins |
 |
|
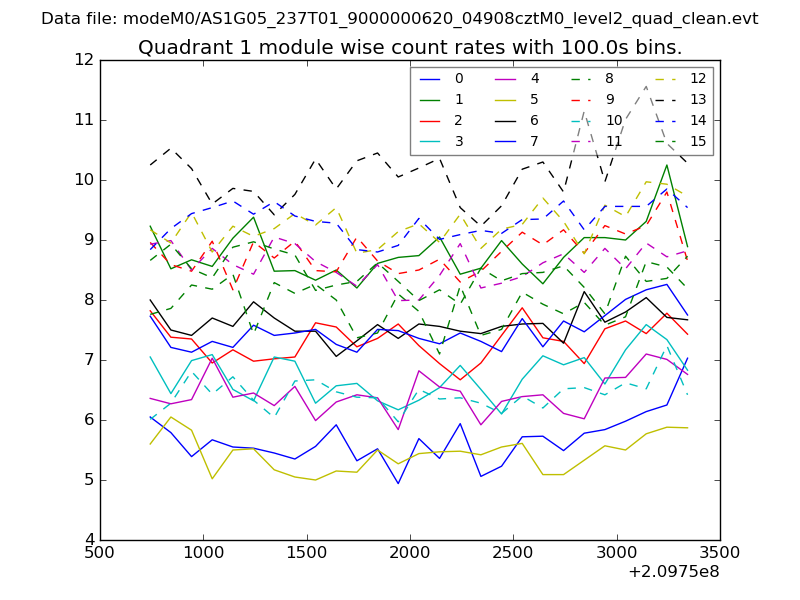
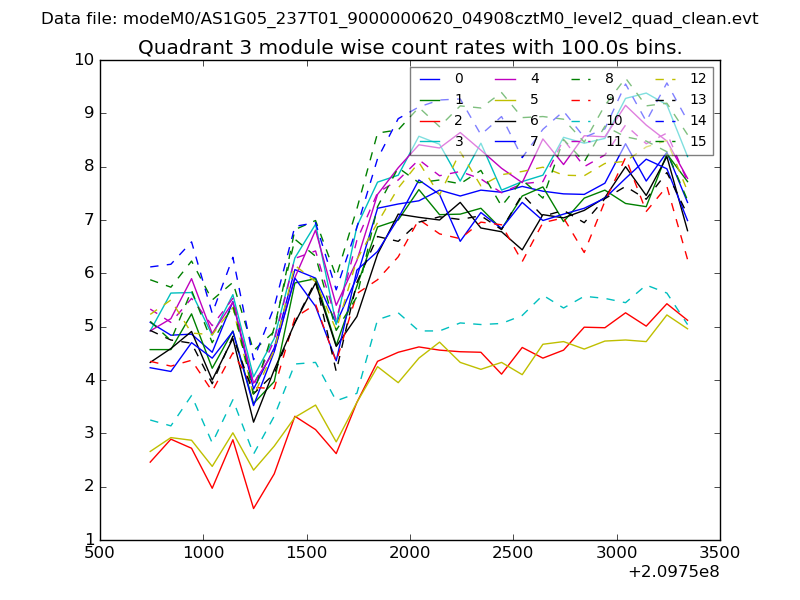
| Module-wise count rates for Quadrant A Data is divided into 100 sec bins |
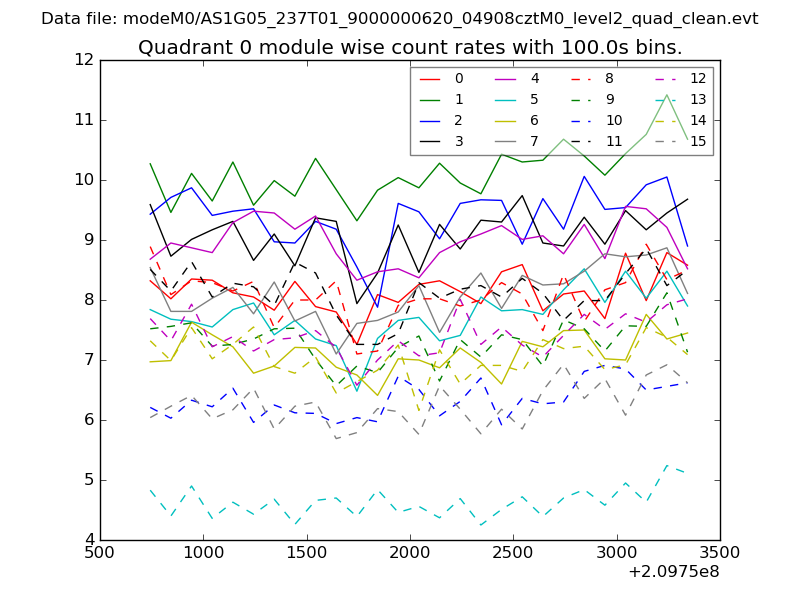 |
 |
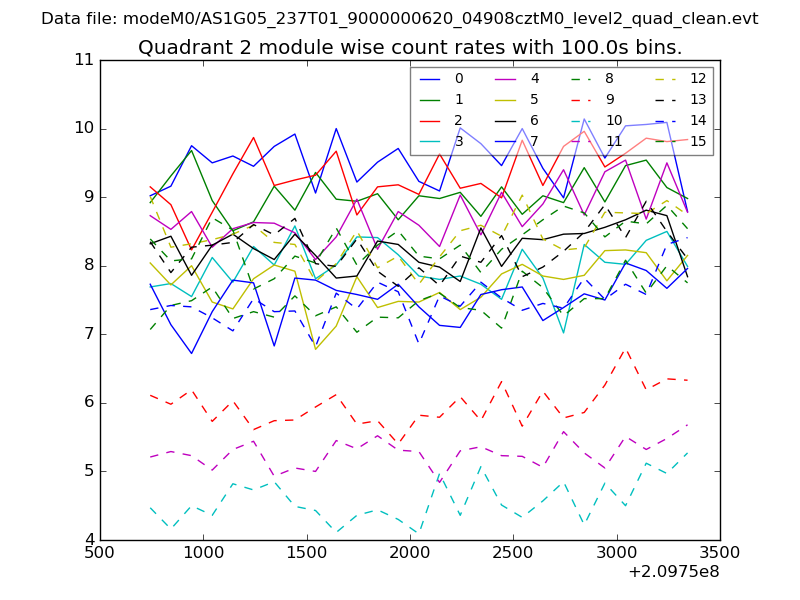
| Module-wise count rates for Quadrant B Data is divided into 100 sec bins |
 |
 |
| Module-wise count rates for Quadrant C Data is divided into 100 sec bins |
 |
 |
| Module-wise count rates for Quadrant D Data is divided into 100 sec bins |
 |
 |
| Parameter | Plot |
|---|---|
| CZT HV Monitor | 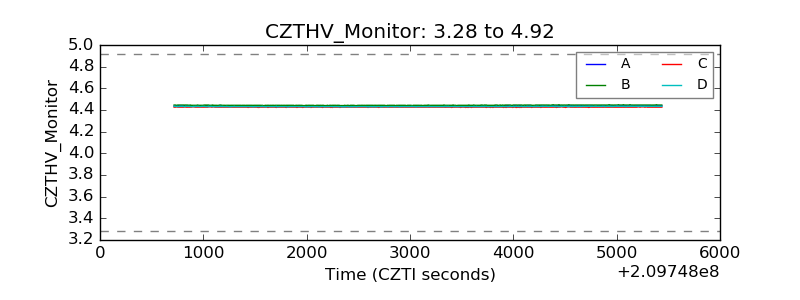 |
| D_VDD | 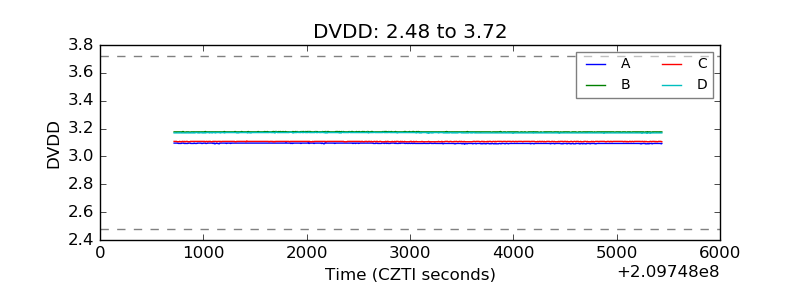 |
| Temperature 1 | 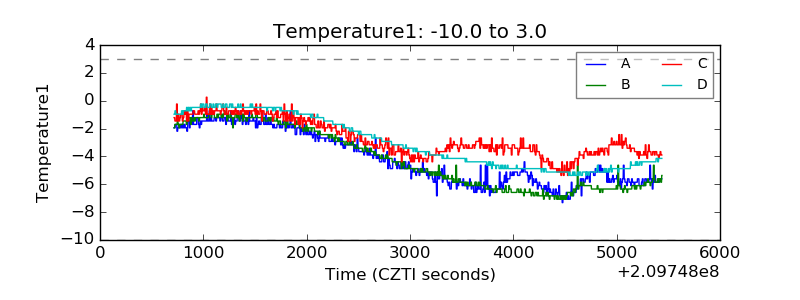 |
| Veto HV Monitor | 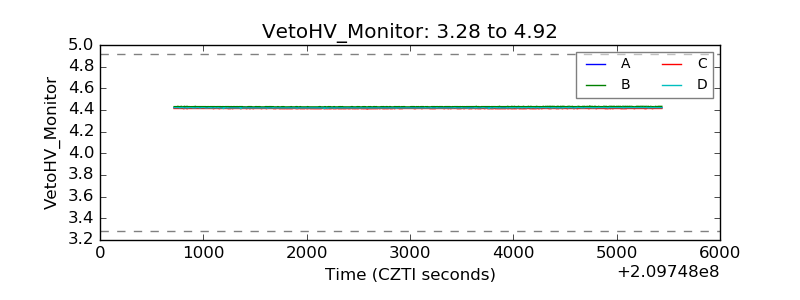 |
| Veto LLD | 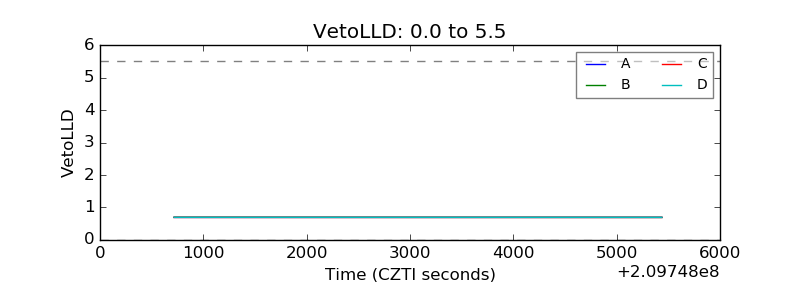 |
| Alpha Counter | 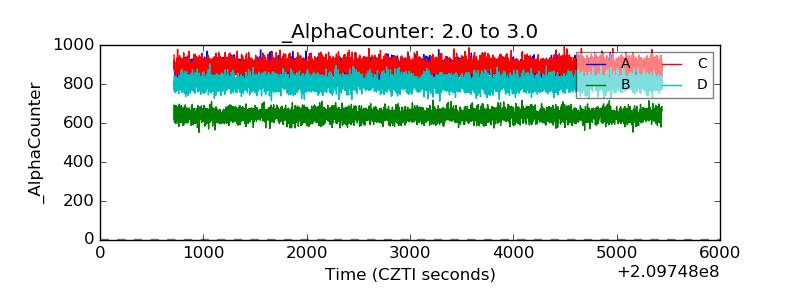 |
| _CPM_Rate | 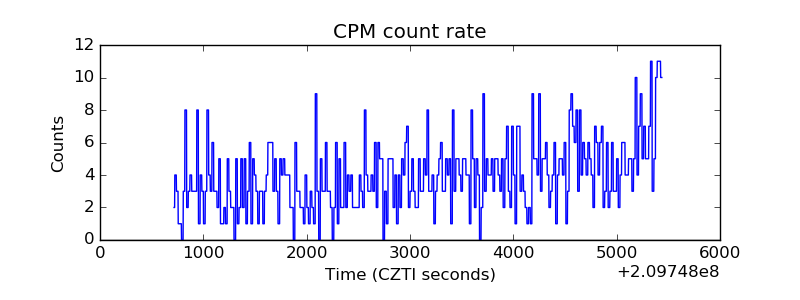 |
| CZT Counter | 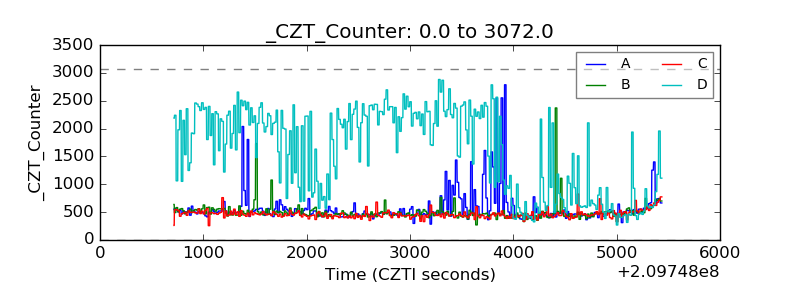 |
| +2.5 Volts monitor |  |
| +5 Volts monitor |  |
| _ROLL_ROT | 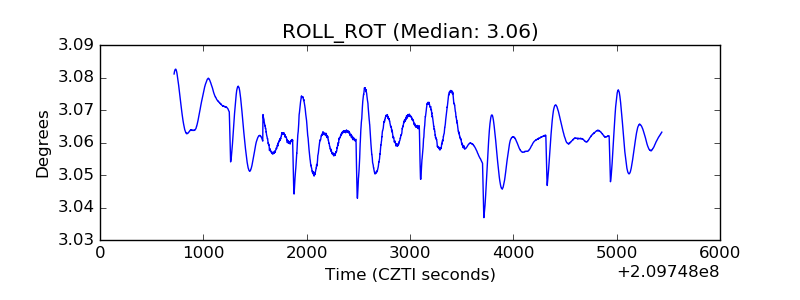 |
| _Roll_DEC |  |
| _Roll_RA | 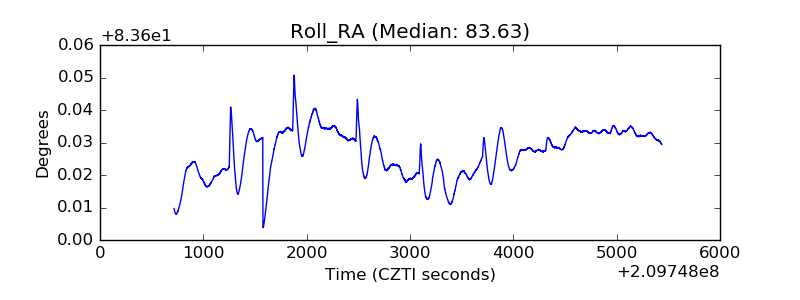 |
| Veto Counter | 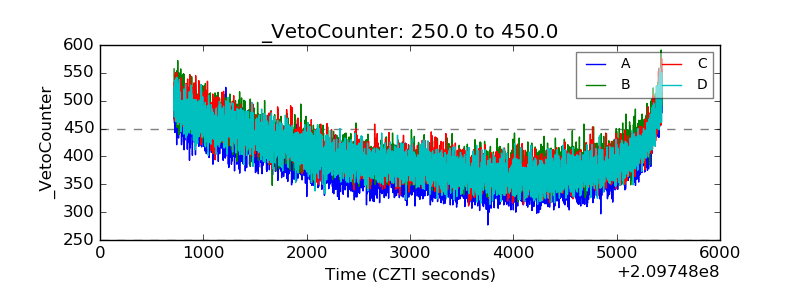 |