| Param | Original file | Final file |
|---|---|---|
| Filename | modeM0/AS1G05_118T01_9000000622_04908cztM0_level2.evt | modeM0/AS1G05_118T01_9000000622_04908cztM0_level2_quad_clean.evt |
| Size (bytes) | 145,293,120 | 6,937,920 |
| Size | 138.6 MB | 6.6 MB |
| Events in quadrant A | 718,606 | 26,187 |
| Events in quadrant B | 687,514 | 26,920 |
| Events in quadrant C | 636,256 | 27,490 |
| Events in quadrant D | 2,258,376 | 22,754 |
| Mode M0 | |||
|---|---|---|---|
| Quadrant | BADHDUFLAG | Total packets | Discarded packets |
| A | 0 | 3008 | 2 |
| B | 0 | 2945 | 1 |
| C | 0 | 2908 | 1 |
| D | 0 | 7678 | 1 |
| Mode M9 | |||
|---|---|---|---|
| Quadrant | BADHDUFLAG | Total packets | Discarded packets |
| A | 0 | 2 | 0 |
| B | 0 | 2 | 0 |
| C | 0 | 2 | 0 |
| D | 0 | 2 | 0 |
| Mode SS | |||
|---|---|---|---|
| Quadrant | BADHDUFLAG | Total packets | Discarded packets |
| A | 0 | 28 | 0 |
| B | 0 | 28 | 0 |
| C | 0 | 28 | 0 |
| D | 0 | 28 | 0 |
| Quadrant | Total seconds | Saturated seconds | Saturation percentage |
|---|---|---|---|
| A | 1424 | 13 | 0.912921% |
| B | 1424 | 3 | 0.210674% |
| C | 1424 | 3 | 0.210674% |
| D | 1424 | 642 | 45.084270% |
Noise dominated data is calculated using 1-second bins in cleaned event files. If a bin has >2000 counts, and if more than 50% of those come from <1% of pixels, then it is considered to be noise-dominated and hence unusable.
| Quadrant | # 1 sec bins | Bins with >0 counts | Bins with >2000 counts | High rate bins dominated by noise | Noise dominated (total time) | Noise dominated (detector-on time) | Marked lightcurve |
|---|---|---|---|---|---|---|---|
| A | 1424 | 1424 | 0 | 0 | 0.00% | 0.00% | 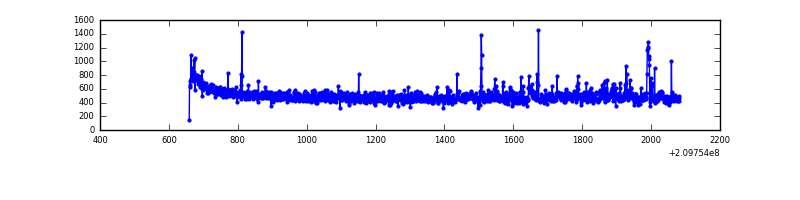 |
| B | 1424 | 1424 | 0 | 0 | 0.00% | 0.00% | 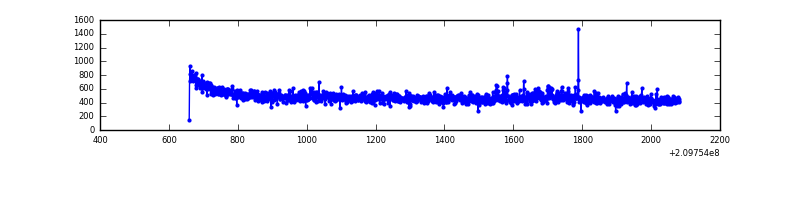 |
| C | 1424 | 1424 | 0 | 0 | 0.00% | 0.00% | 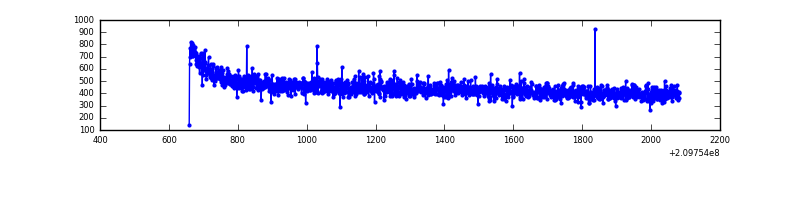 |
| D | 1423 | 1423 | 585 | 585 | 41.11% | 41.11% | 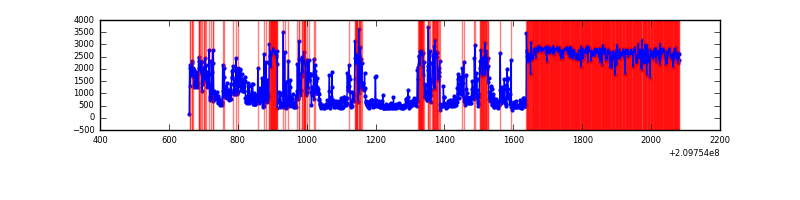 |
Top three noisy pixels from each quadrant. If the there are fewer than three noisy pixels in the level2.evt file, extra rows are filled as -1
| Pixel properties | Quadrant properties | ||||||
|---|---|---|---|---|---|---|---|
| Quadrant | DetID | PixID | Counts | Sigma | Mean | Median | Sigma |
| A | 0 | 31 | 21829 | 590.96 | 172 | 168 | 36.7 |
| A | 8 | 15 | 17971 | 485.71 | 172 | 168 | 36.7 |
| A | 13 | 251 | 15712 | 424.08 | 172 | 168 | 36.7 |
| B | 15 | 204 | 17806 | 508.73 | 171 | 167 | 34.7 |
| B | 4 | 80 | 3151 | 86.06 | 171 | 167 | 34.7 |
| B | 15 | 54 | 2820 | 76.52 | 171 | 167 | 34.7 |
| C | 1 | 16 | 1782 | 42.13 | 162 | 162 | 38.5 |
| C | 13 | 61 | 1347 | 30.82 | 162 | 162 | 38.5 |
| C | 14 | 67 | 657 | 12.87 | 162 | 162 | 38.5 |
| D | 2 | 33 | 1392089 | 41343.78 | 129 | 124 | 33.7 |
| D | 2 | 63 | 204524 | 6071.04 | 129 | 124 | 33.7 |
| D | 12 | 233 | 81001 | 2402.19 | 129 | 124 | 33.7 |
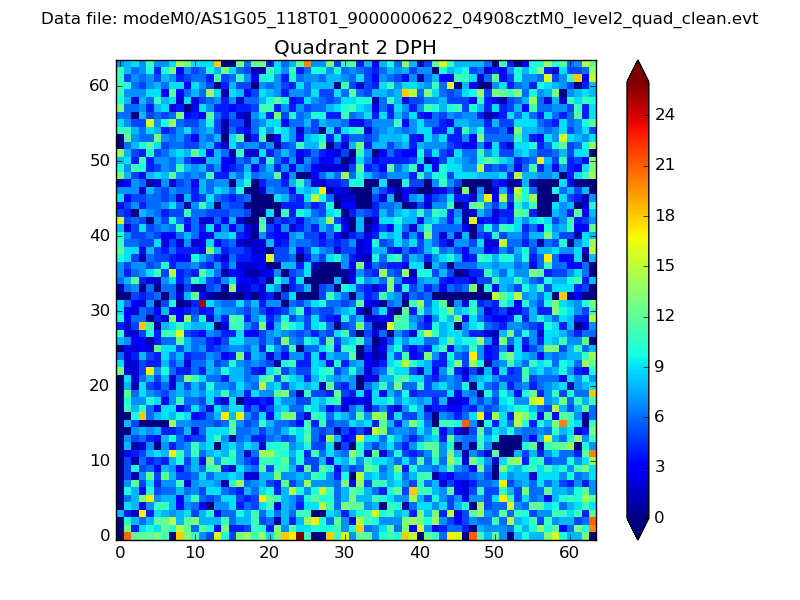
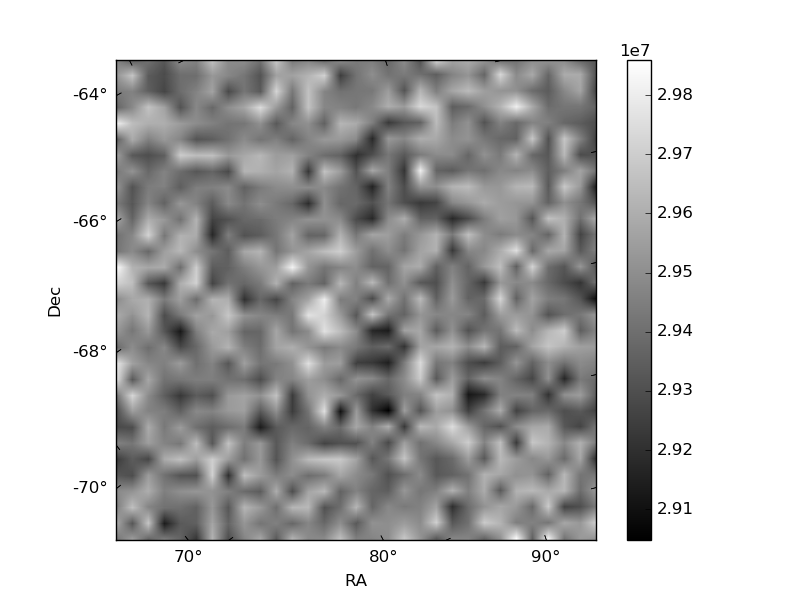
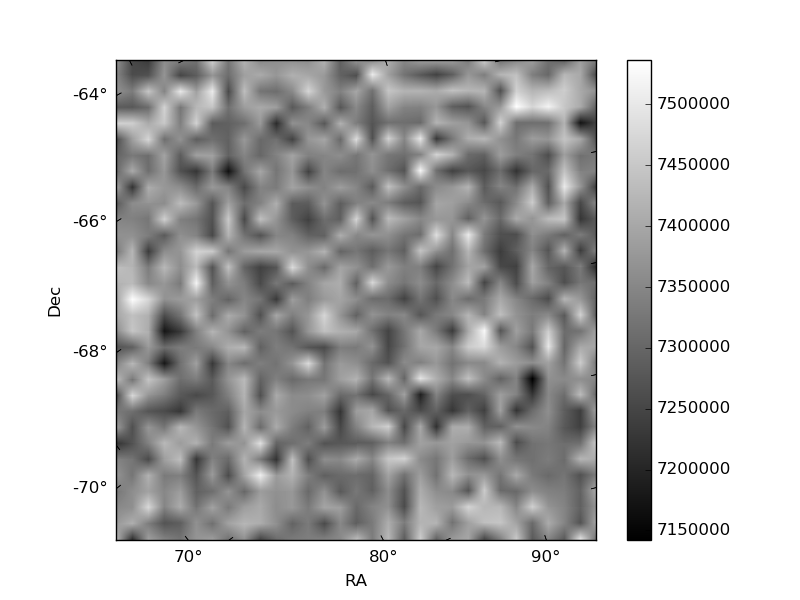
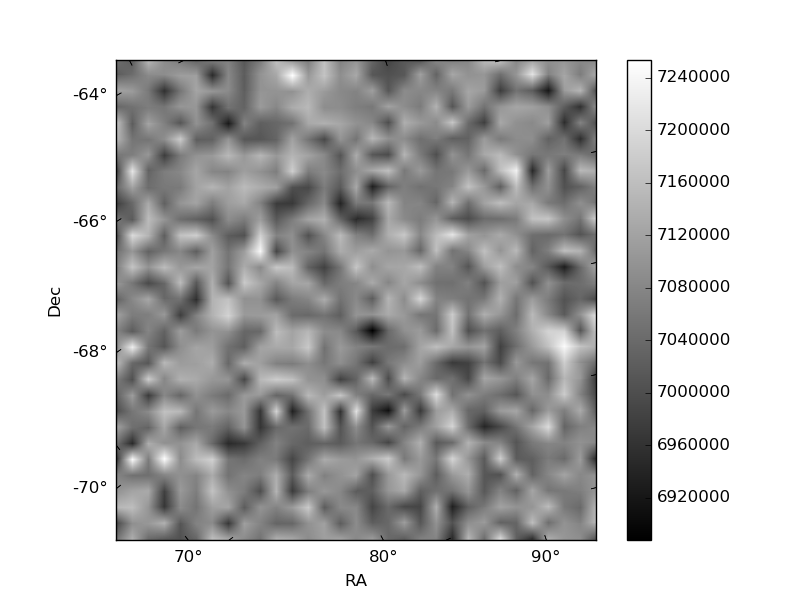
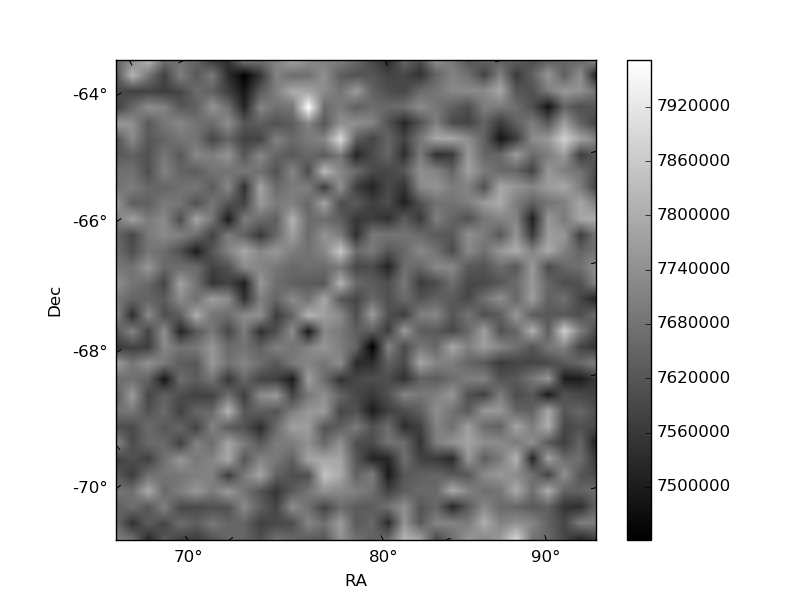
Histogram calculated using DETX and DETY for each event in the final _common_clean file
| Quadrant A | 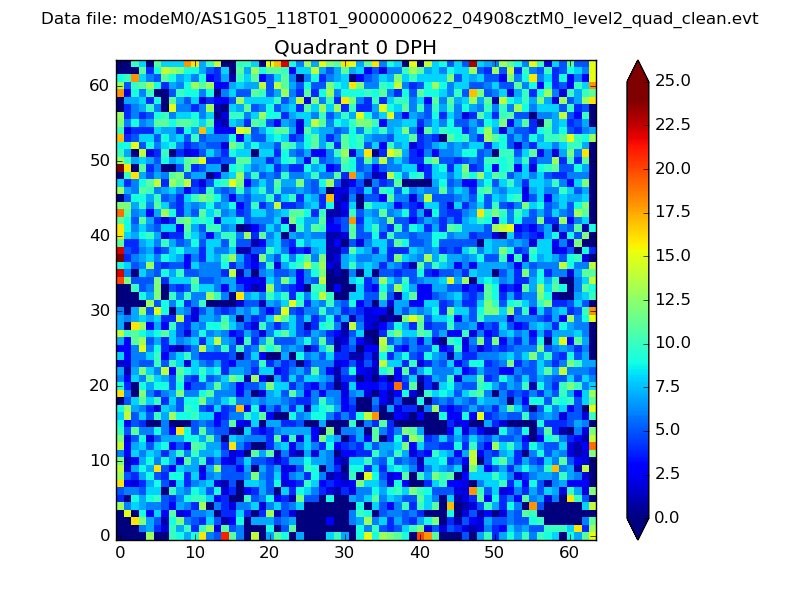 |
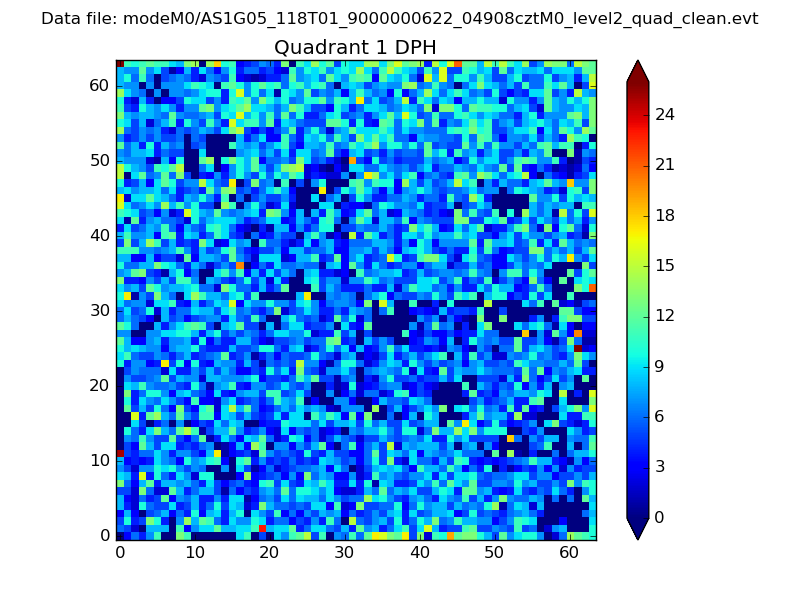 |
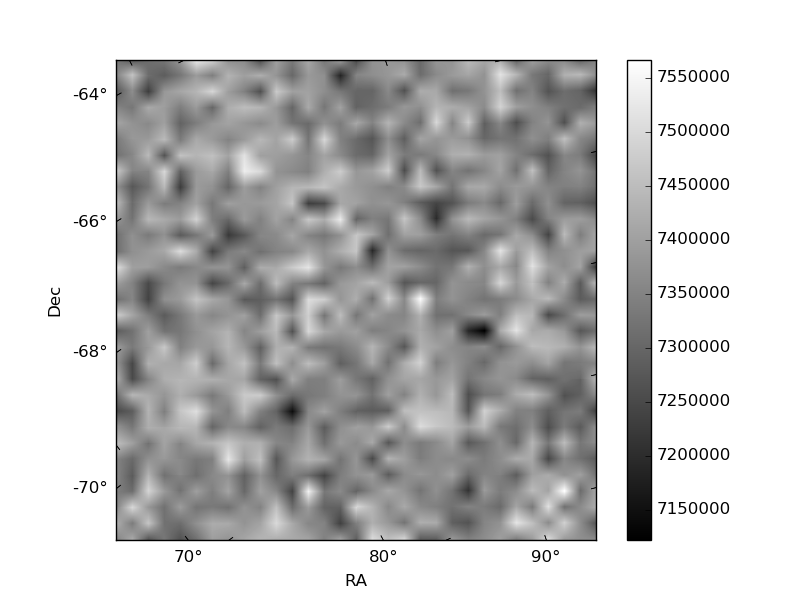
Quadrant B |
|---|---|---|---|
| Quadrant D | 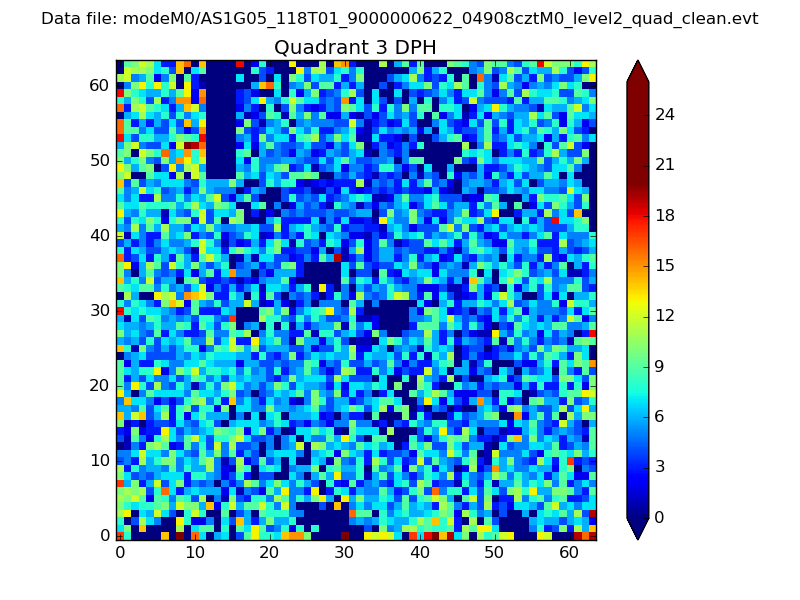 |
 |
Quadrant C |
| Plot type | Count rate plots | Images |
|---|---|---|
| Comparison with Poisson distribution Blue bars denote a histogram of data divided into 1 sec bins. Red curve is a Poisson curve with rate = median count rate of data. |
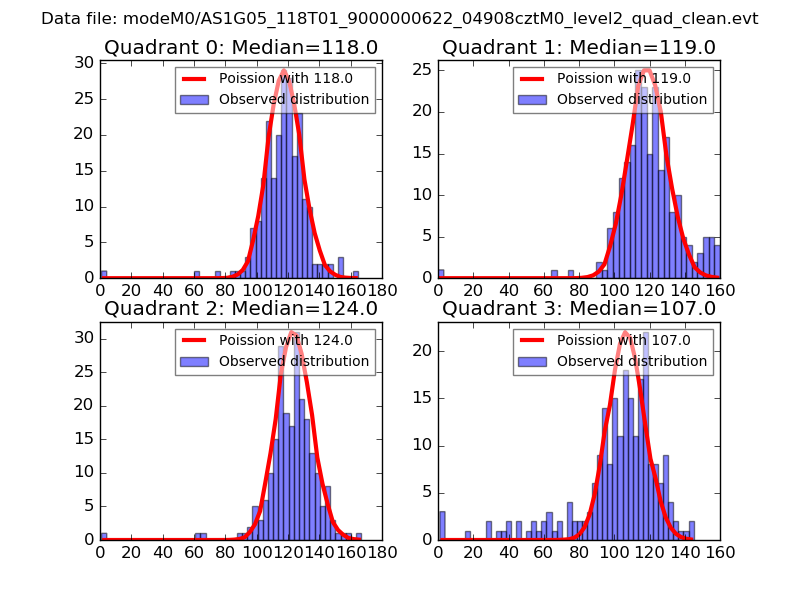 |
 |
| Quadrant-wise count rates Data is divided into 100 sec bins |
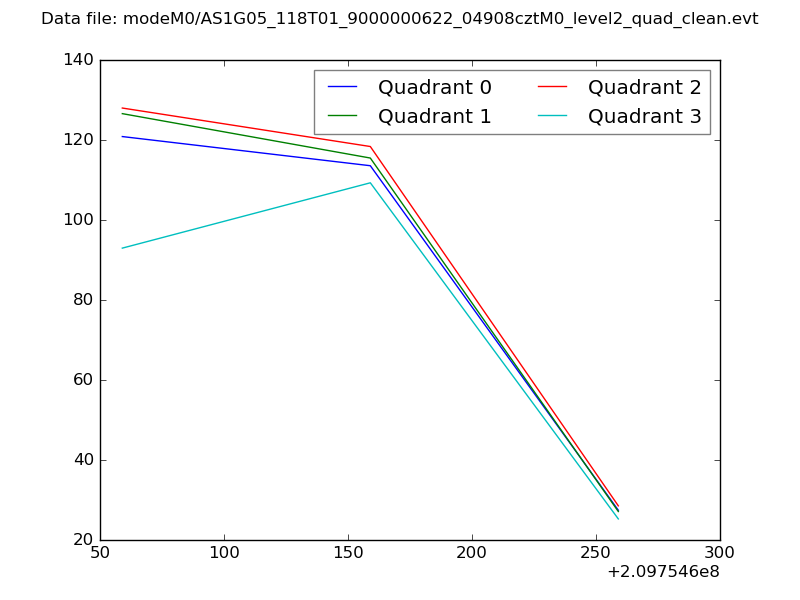 |
|
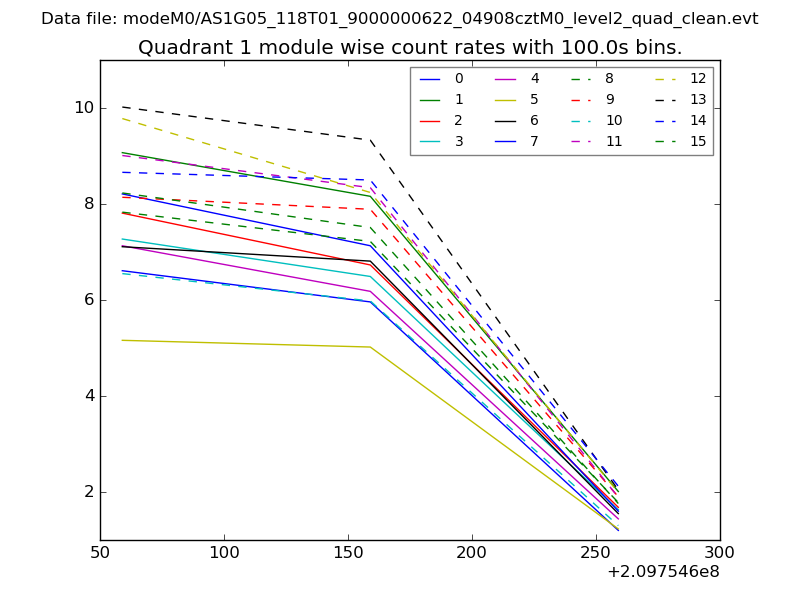
| Module-wise count rates for Quadrant A Data is divided into 100 sec bins |
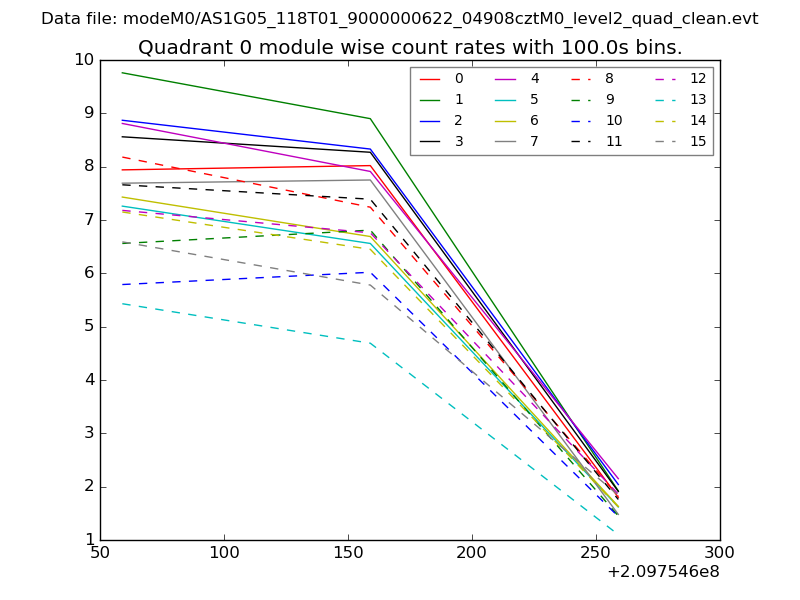 |
 |
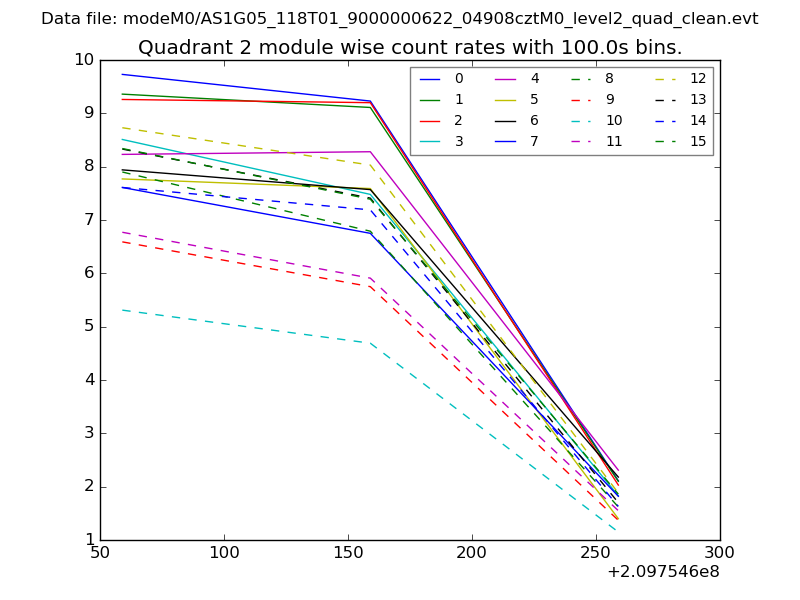
| Module-wise count rates for Quadrant B Data is divided into 100 sec bins |
 |
 |
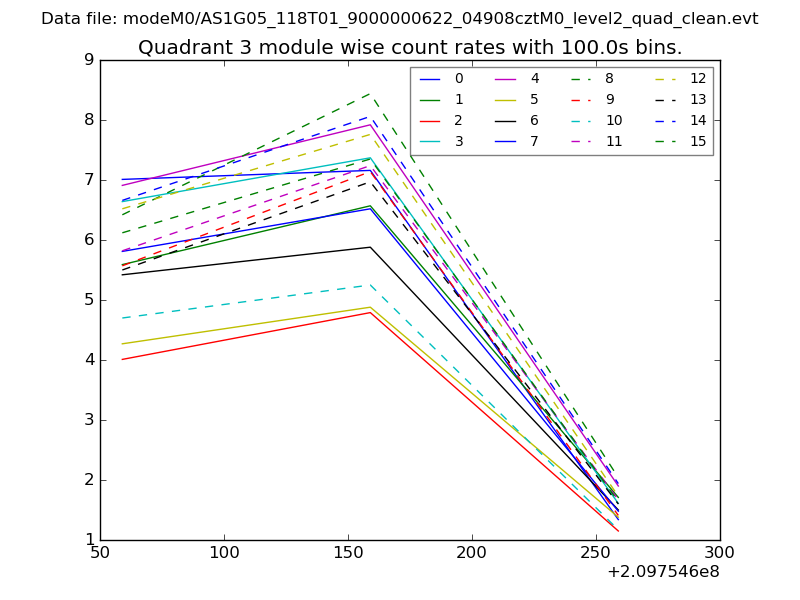
| Module-wise count rates for Quadrant C Data is divided into 100 sec bins |
 |
 |
| Module-wise count rates for Quadrant D Data is divided into 100 sec bins |
 |
 |
| Parameter | Plot |
|---|---|
| CZT HV Monitor | 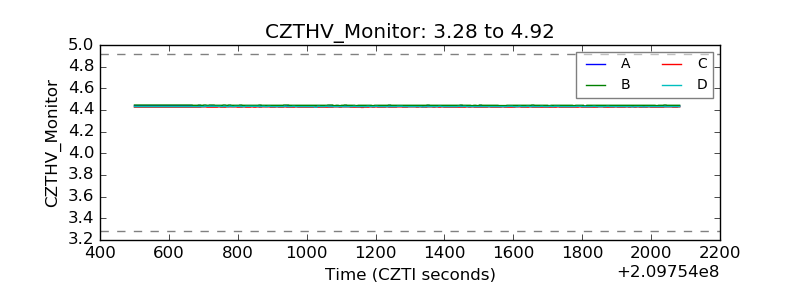 |
| D_VDD | 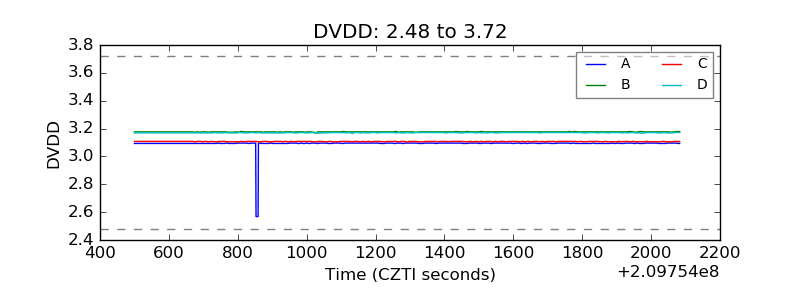 |
| Temperature 1 | 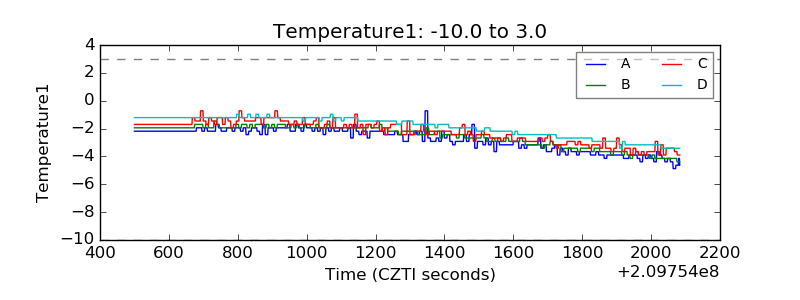 |
| Veto HV Monitor | 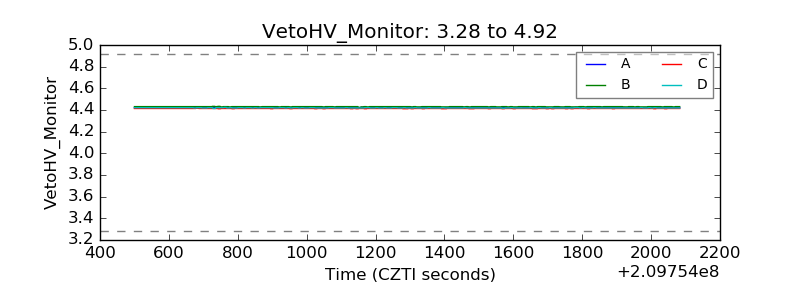 |
| Veto LLD | 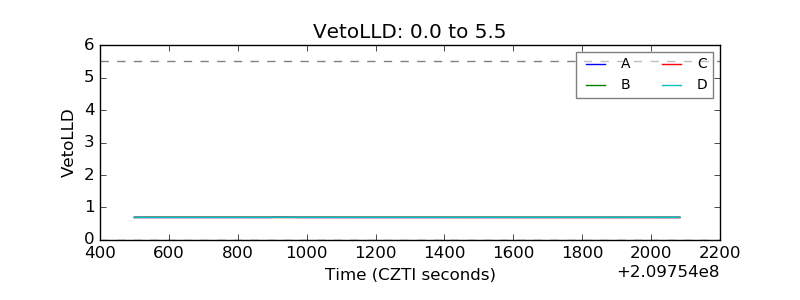 |
| Alpha Counter | 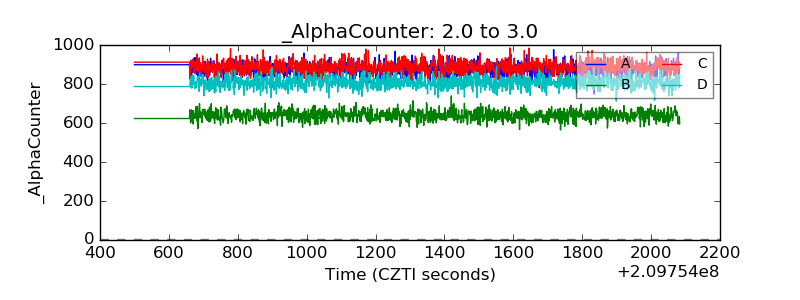 |
| _CPM_Rate | 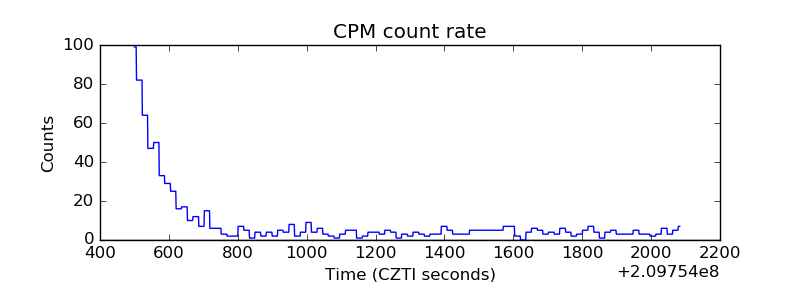 |
| CZT Counter | 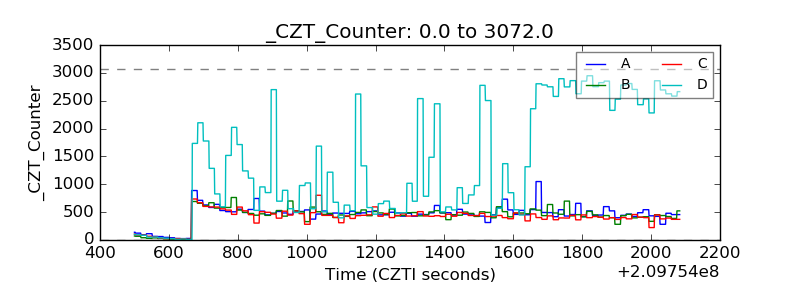 |
| +2.5 Volts monitor |  |
| +5 Volts monitor |  |
| _ROLL_ROT | 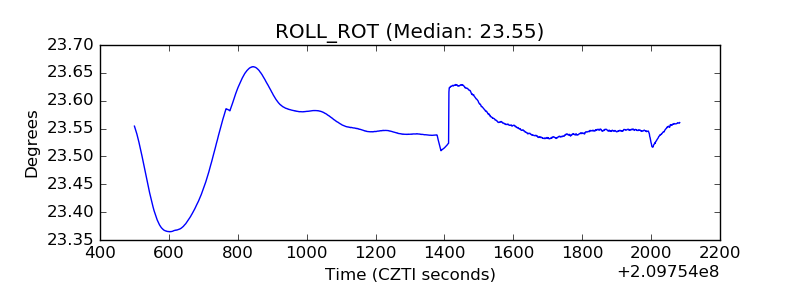 |
| _Roll_DEC | 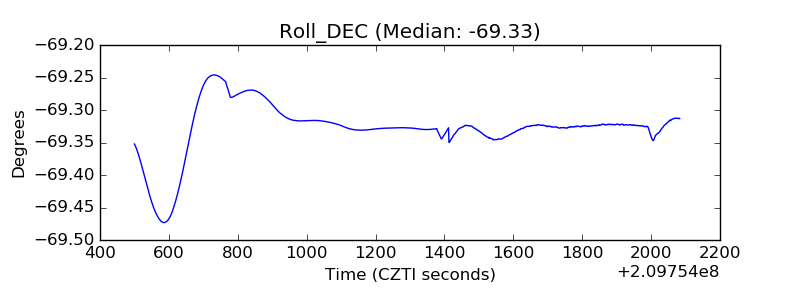 |
| _Roll_RA | 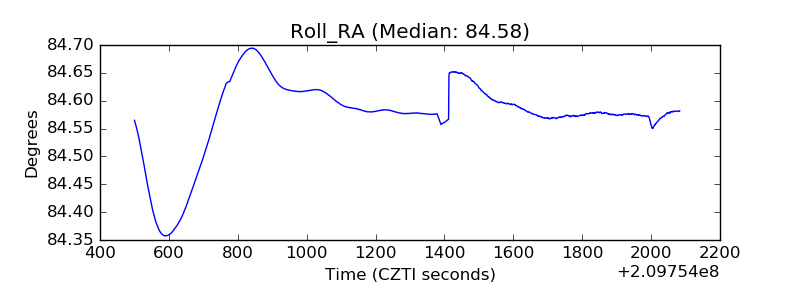 |
| Veto Counter | 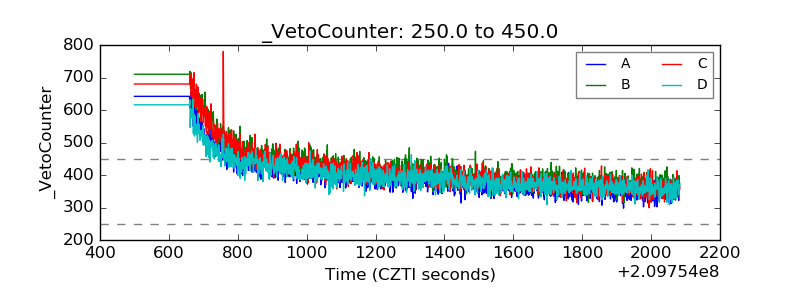 |