| Param | Original file | Final file |
|---|---|---|
| Filename | modeM0/AS1G05_118T01_9000000622_04910cztM0_level2.evt | modeM0/AS1G05_118T01_9000000622_04910cztM0_level2_quad_clean.evt |
| Size (bytes) | 540,074,880 | 82,422,720 |
| Size | 515.1 MB | 78.6 MB |
| Events in quadrant A | 3,541,922 | 505,406 |
| Events in quadrant B | 3,604,128 | 510,166 |
| Events in quadrant C | 3,075,264 | 509,237 |
| Events in quadrant D | 5,653,588 | 476,999 |
| Mode M0 | |||
|---|---|---|---|
| Quadrant | BADHDUFLAG | Total packets | Discarded packets |
| A | 0 | 15575 | 2 |
| B | 0 | 15649 | 1 |
| C | 0 | 14480 | 1 |
| D | 0 | 21742 | 1 |
| Mode M9 | |||
|---|---|---|---|
| Quadrant | BADHDUFLAG | Total packets | Discarded packets |
| A | 0 | 3 | 0 |
| B | 0 | 3 | 0 |
| C | 0 | 3 | 0 |
| D | 0 | 3 | 0 |
| Mode SS | |||
|---|---|---|---|
| Quadrant | BADHDUFLAG | Total packets | Discarded packets |
| A | 0 | 144 | 0 |
| B | 0 | 144 | 0 |
| C | 0 | 144 | 0 |
| D | 0 | 144 | 0 |
| Quadrant | Total seconds | Saturated seconds | Saturation percentage |
|---|---|---|---|
| A | 7090 | 217 | 3.060649% |
| B | 7090 | 182 | 2.566996% |
| C | 7090 | 55 | 0.775740% |
| D | 7090 | 577 | 8.138223% |
Noise dominated data is calculated using 1-second bins in cleaned event files. If a bin has >2000 counts, and if more than 50% of those come from <1% of pixels, then it is considered to be noise-dominated and hence unusable.
| Quadrant | # 1 sec bins | Bins with >0 counts | Bins with >2000 counts | High rate bins dominated by noise | Noise dominated (total time) | Noise dominated (detector-on time) | Marked lightcurve |
|---|---|---|---|---|---|---|---|
| A | 7395 | 7090 | 88 | 88 | 1.19% | 1.24% | 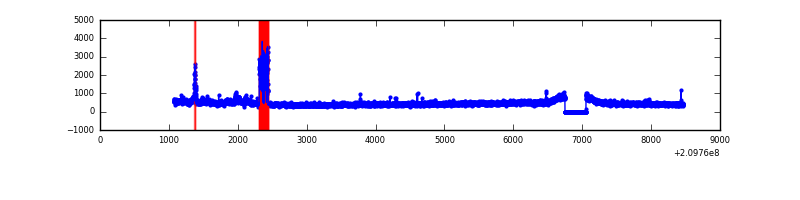 |
| B | 7395 | 7091 | 27 | 27 | 0.37% | 0.38% | 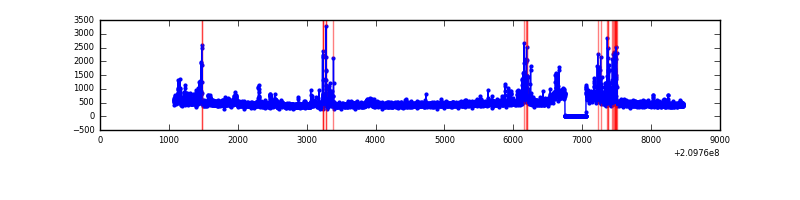 |
| C | 7395 | 7091 | 0 | 0 | 0.00% | 0.00% | 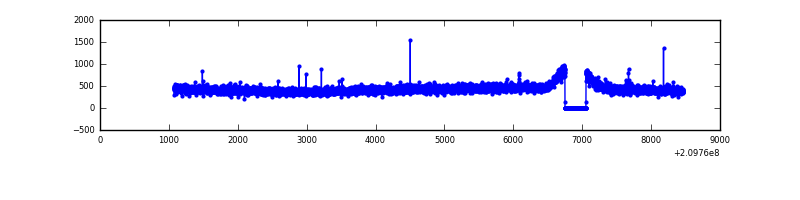 |
| D | 7395 | 7090 | 434 | 434 | 5.87% | 6.12% | 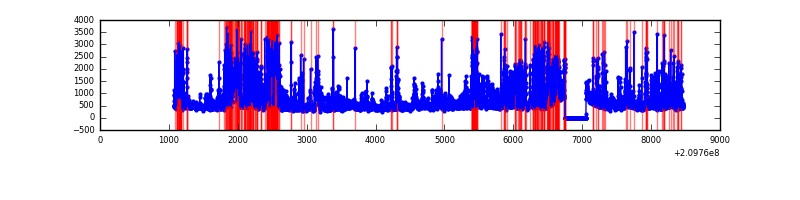 |
Top three noisy pixels from each quadrant. If the there are fewer than three noisy pixels in the level2.evt file, extra rows are filled as -1
| Pixel properties | Quadrant properties | ||||||
|---|---|---|---|---|---|---|---|
| Quadrant | DetID | PixID | Counts | Sigma | Mean | Median | Sigma |
| A | 0 | 31 | 412724 | 2522.99 | 800 | 783 | 163.3 |
| A | 0 | 50 | 24873 | 147.54 | 800 | 783 | 163.3 |
| A | 13 | 251 | 11420 | 65.15 | 800 | 783 | 163.3 |
| B | 10 | 246 | 140179 | 900.03 | 812 | 792 | 154.9 |
| B | 8 | 3 | 116120 | 744.68 | 812 | 792 | 154.9 |
| B | 0 | 219 | 73712 | 470.85 | 812 | 792 | 154.9 |
| C | 1 | 16 | 7755 | 38.62 | 782 | 782 | 180.6 |
| C | 13 | 61 | 6522 | 31.79 | 782 | 782 | 180.6 |
| C | 8 | 222 | 6039 | 29.12 | 782 | 782 | 180.6 |
| D | 2 | 63 | 1738520 | 9351.99 | 761 | 735 | 185.8 |
| D | 2 | 136 | 304686 | 1635.73 | 761 | 735 | 185.8 |
| D | 13 | 235 | 204324 | 1095.63 | 761 | 735 | 185.8 |
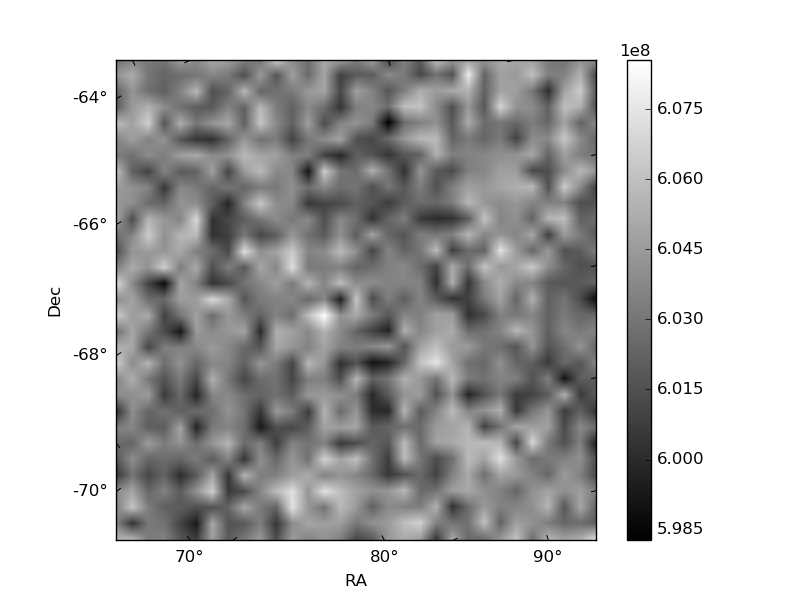
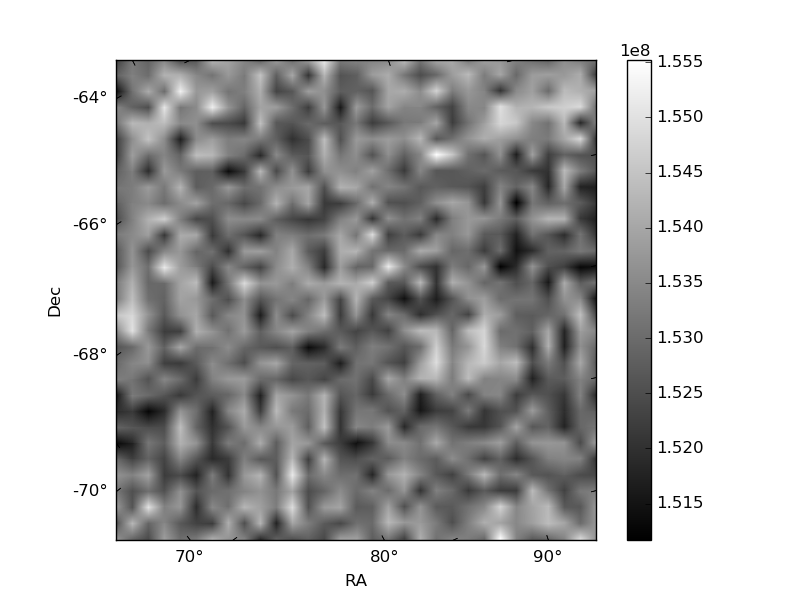
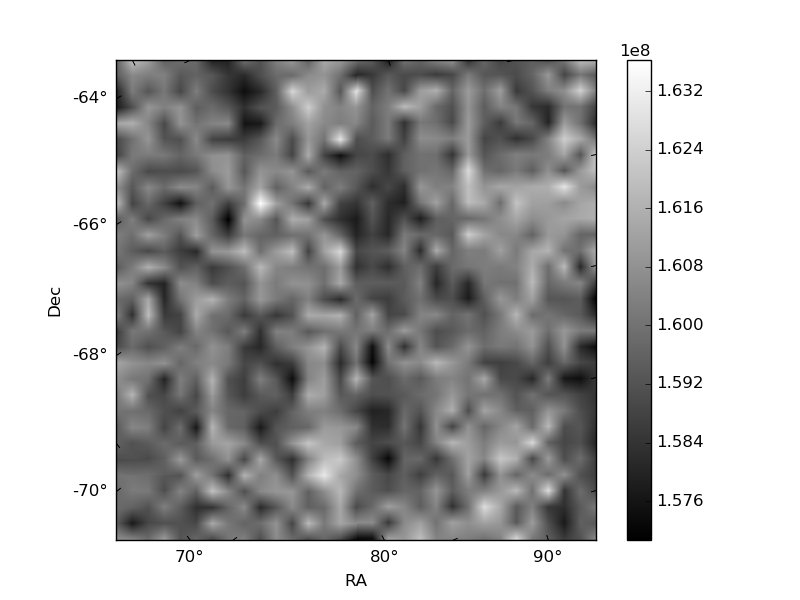
Histogram calculated using DETX and DETY for each event in the final _common_clean file
| Quadrant A | 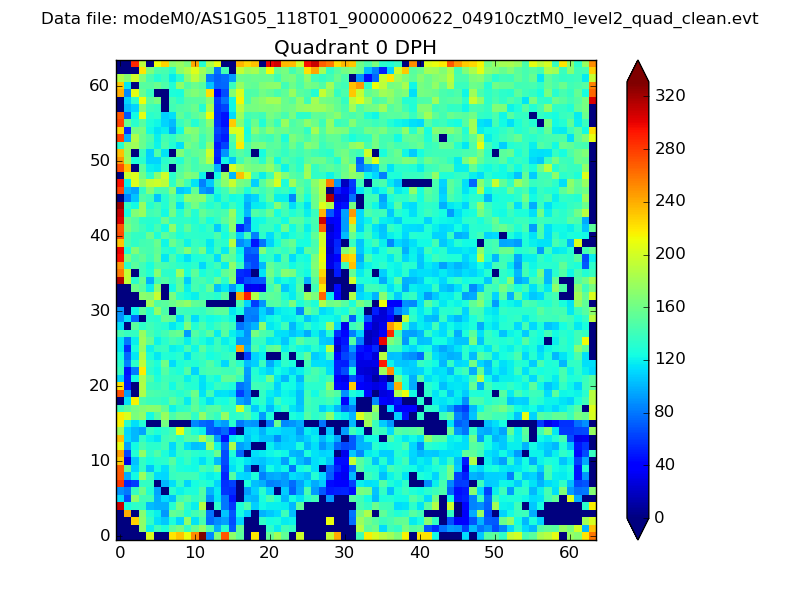 |
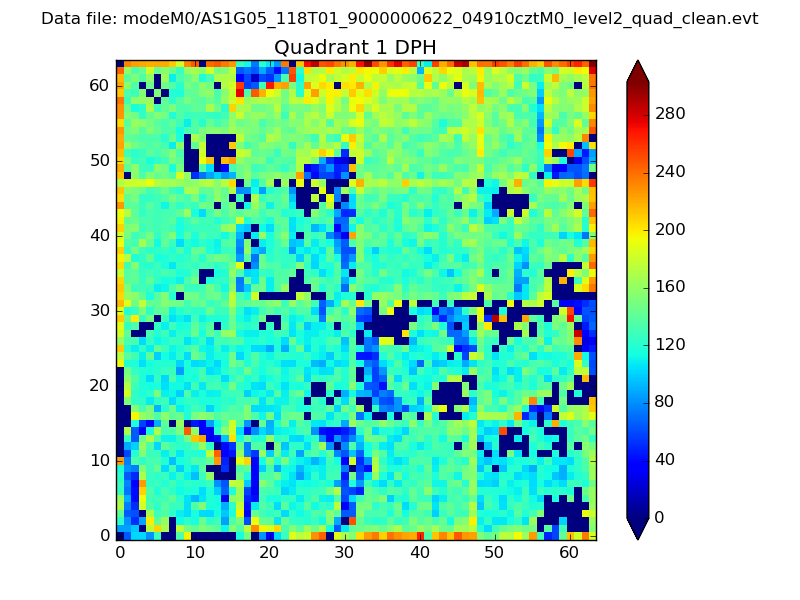 |
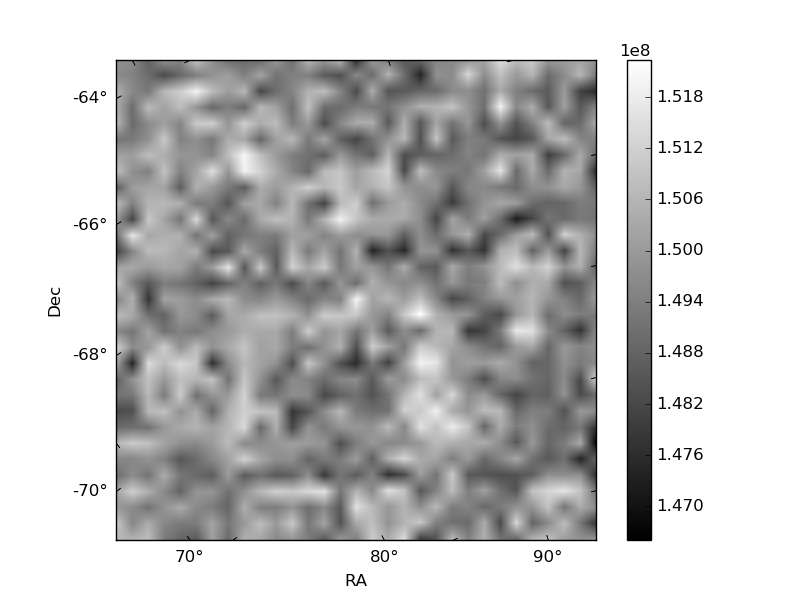
Quadrant B |
|---|---|---|---|
| Quadrant D | 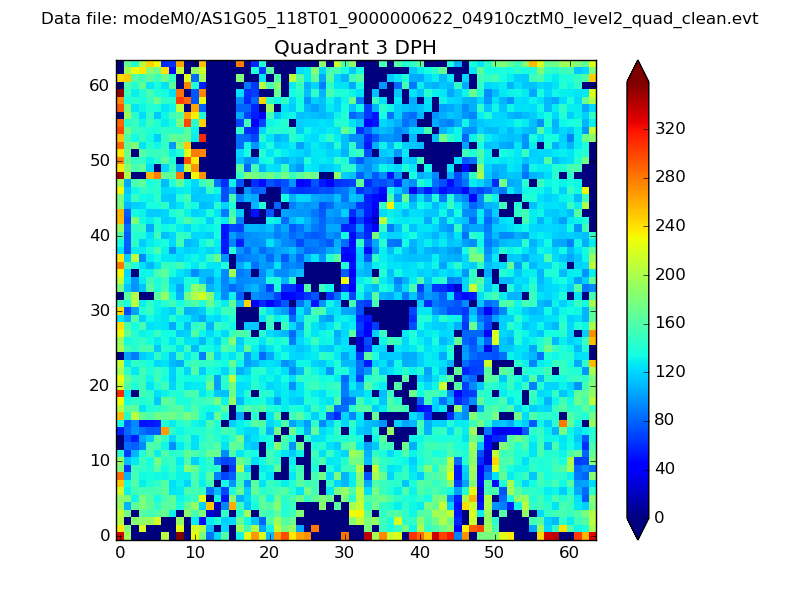 |
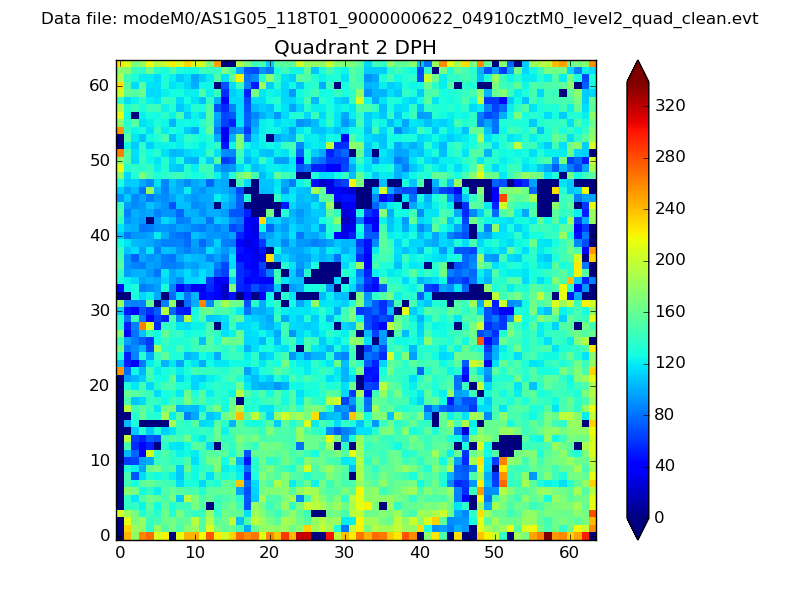 |
Quadrant C |
| Plot type | Count rate plots | Images |
|---|---|---|
| Comparison with Poisson distribution Blue bars denote a histogram of data divided into 1 sec bins. Red curve is a Poisson curve with rate = median count rate of data. |
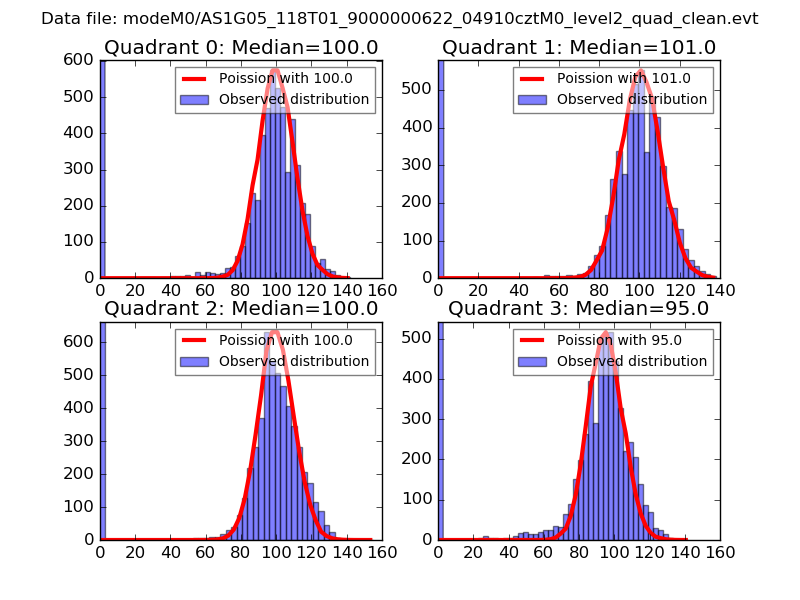 |
 |
| Quadrant-wise count rates Data is divided into 100 sec bins |
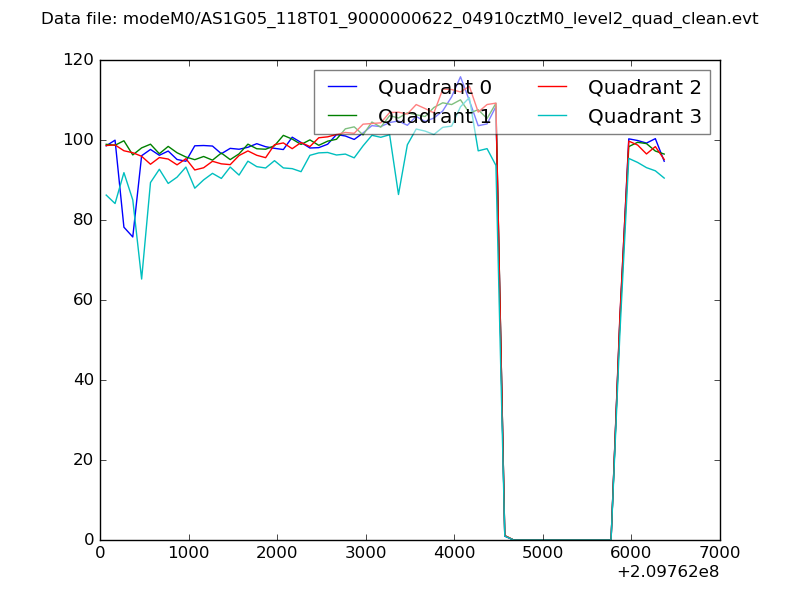 |
|
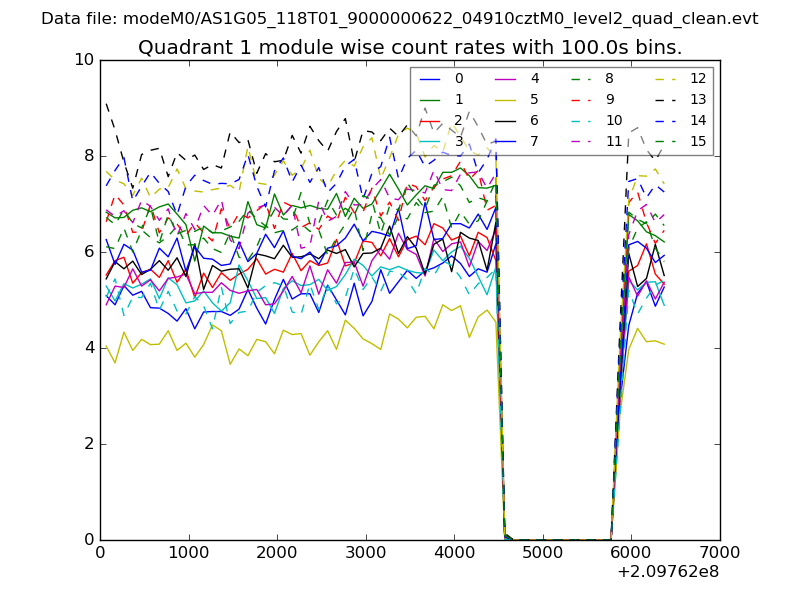
| Module-wise count rates for Quadrant A Data is divided into 100 sec bins |
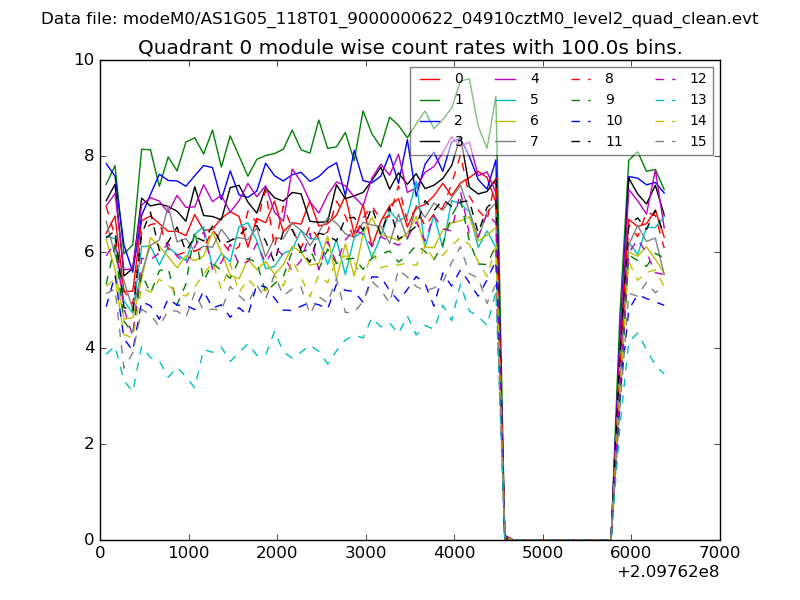 |
 |
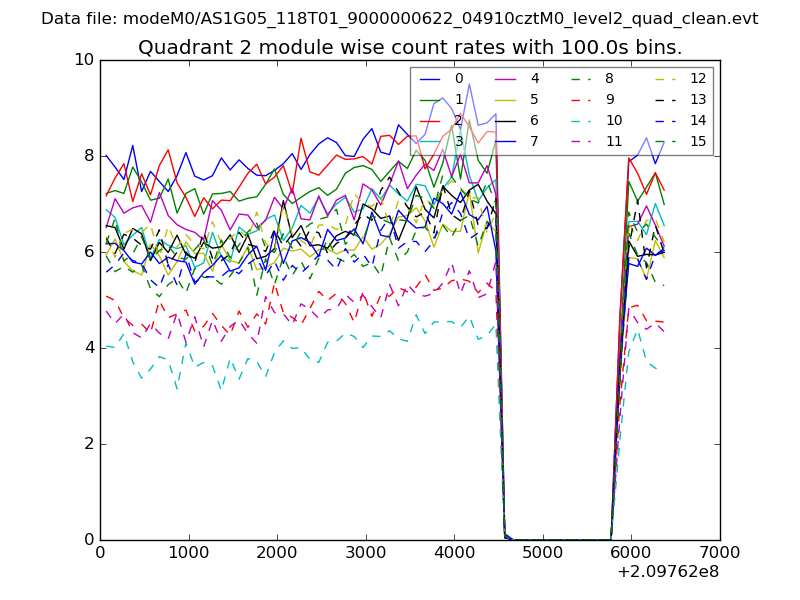
| Module-wise count rates for Quadrant B Data is divided into 100 sec bins |
 |
 |
| Module-wise count rates for Quadrant C Data is divided into 100 sec bins |
 |
 |
| Module-wise count rates for Quadrant D Data is divided into 100 sec bins |
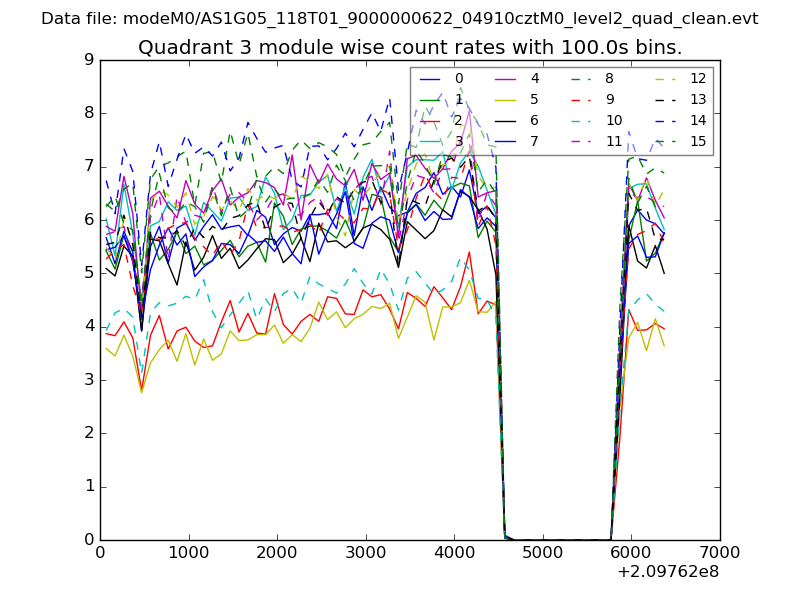 |
 |
| Parameter | Plot |
|---|---|
| CZT HV Monitor | 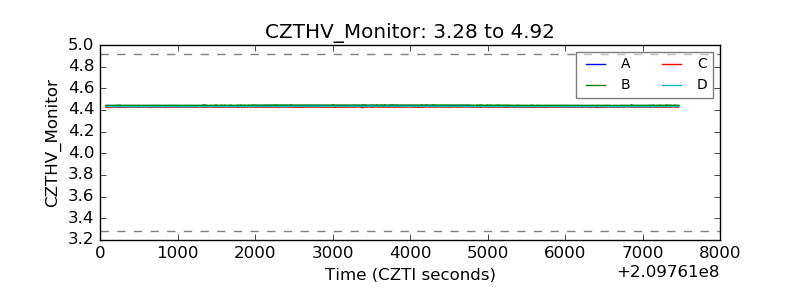 |
| D_VDD |  |
| Temperature 1 | 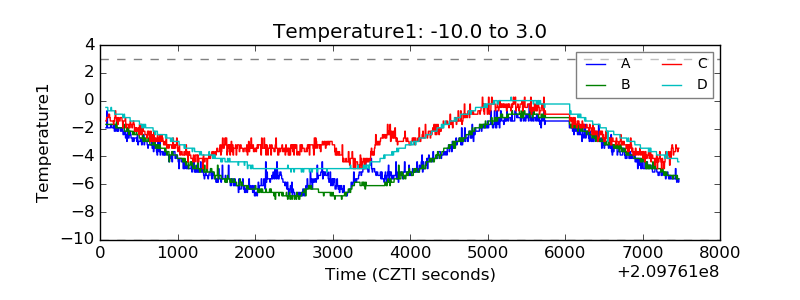 |
| Veto HV Monitor | 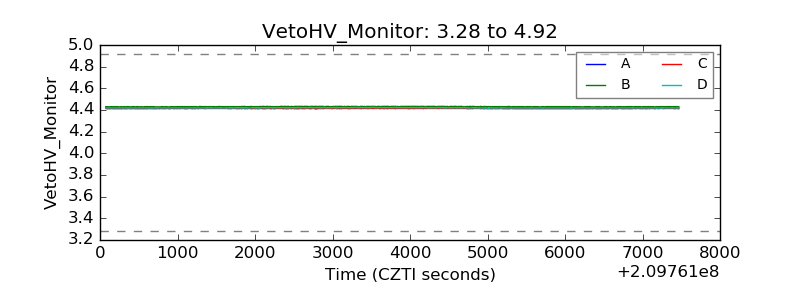 |
| Veto LLD | 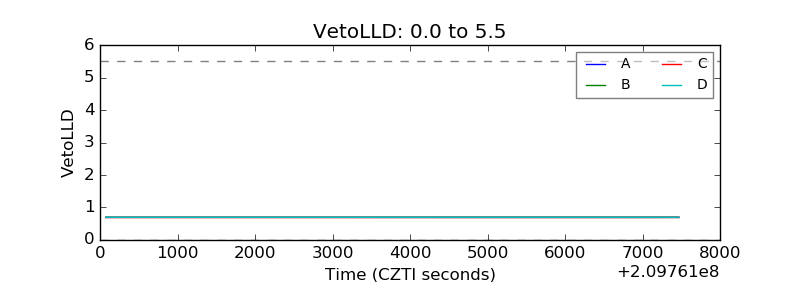 |
| Alpha Counter | 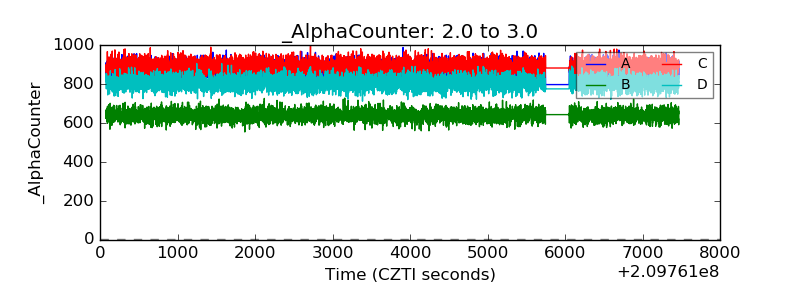 |
| _CPM_Rate | 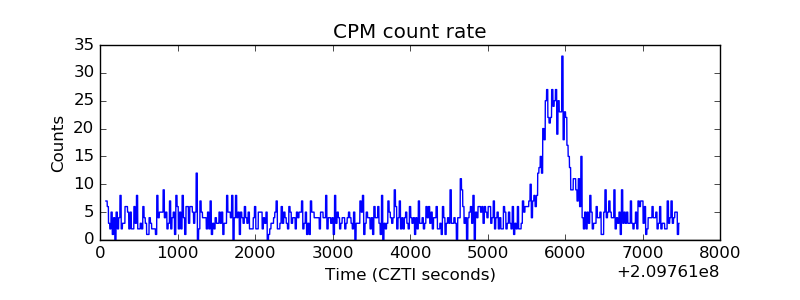 |
| CZT Counter | 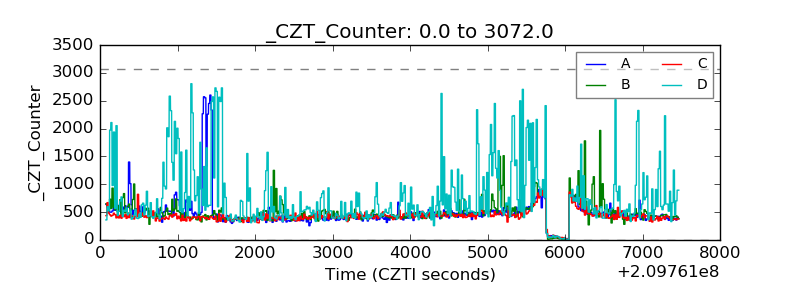 |
| +2.5 Volts monitor |  |
| +5 Volts monitor |  |
| _ROLL_ROT | 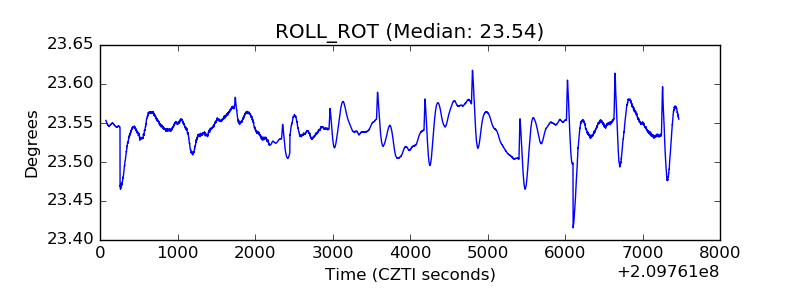 |
| _Roll_DEC | 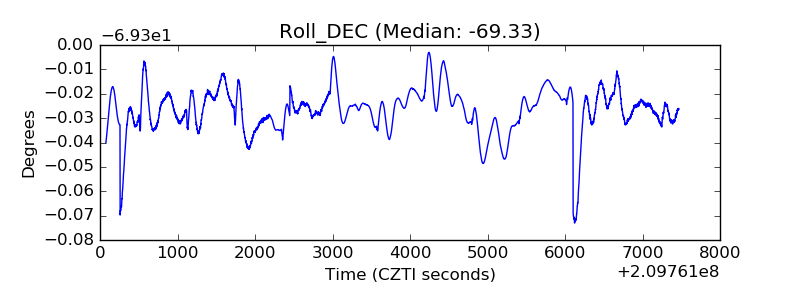 |
| _Roll_RA | 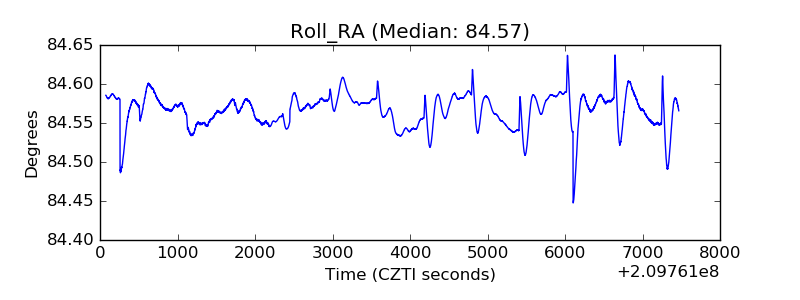 |
| Veto Counter | 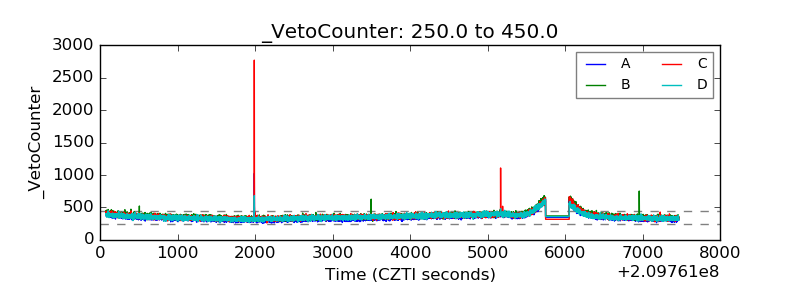 |