| Param | Original file | Final file |
|---|---|---|
| Filename | modeM0/AS1G05_118T01_9000000622_04911cztM0_level2.evt | modeM0/AS1G05_118T01_9000000622_04911cztM0_level2_quad_clean.evt |
| Size (bytes) | 611,916,480 | 89,380,800 |
| Size | 583.6 MB | 85.2 MB |
| Events in quadrant A | 3,499,846 | 554,147 |
| Events in quadrant B | 3,768,433 | 553,095 |
| Events in quadrant C | 4,969,912 | 540,028 |
| Events in quadrant D | 5,773,853 | 525,911 |
| Mode M0 | |||
|---|---|---|---|
| Quadrant | BADHDUFLAG | Total packets | Discarded packets |
| A | 0 | 15973 | 5 |
| B | 0 | 16670 | 4 |
| C | 0 | 20463 | 4 |
| D | 0 | 22603 | 4 |
| Mode M9 | |||
|---|---|---|---|
| Quadrant | BADHDUFLAG | Total packets | Discarded packets |
| A | 1 | 251318637792 | 0 |
| B | 1 | -1 | -1 |
| C | 1 | -1 | -1 |
| D | 1 | -1 | -1 |
| Mode SS | |||
|---|---|---|---|
| Quadrant | BADHDUFLAG | Total packets | Discarded packets |
| A | 0 | 156 | 0 |
| B | 0 | 156 | 0 |
| C | 0 | 156 | 0 |
| D | 0 | 156 | 0 |
| Quadrant | Total seconds | Saturated seconds | Saturation percentage |
|---|---|---|---|
| A | 7657 | 110 | 1.436594% |
| B | 7657 | 188 | 2.455270% |
| C | 7657 | 798 | 10.421836% |
| D | 7657 | 448 | 5.850855% |
Noise dominated data is calculated using 1-second bins in cleaned event files. If a bin has >2000 counts, and if more than 50% of those come from <1% of pixels, then it is considered to be noise-dominated and hence unusable.
| Quadrant | # 1 sec bins | Bins with >0 counts | Bins with >2000 counts | High rate bins dominated by noise | Noise dominated (total time) | Noise dominated (detector-on time) | Marked lightcurve |
|---|---|---|---|---|---|---|---|
| A | 7787 | 7662 | 0 | 0 | 0.00% | 0.00% | 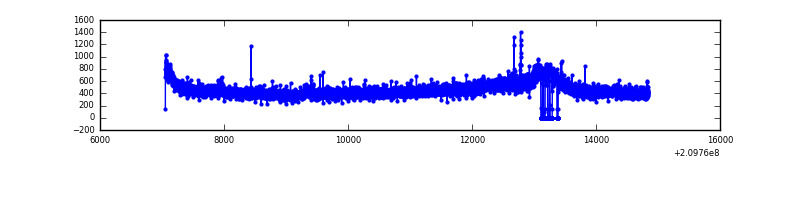 |
| B | 7787 | 7661 | 18 | 18 | 0.23% | 0.23% | 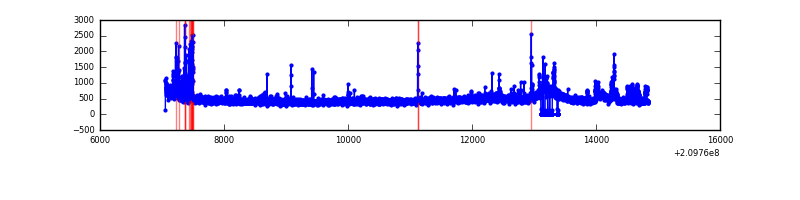 |
| C | 7787 | 7659 | 612 | 612 | 7.86% | 7.99% | 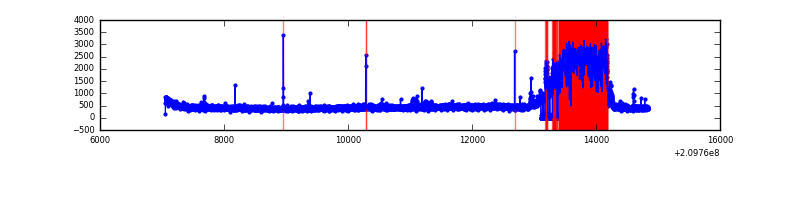 |
| D | 7787 | 7660 | 242 | 242 | 3.11% | 3.16% | 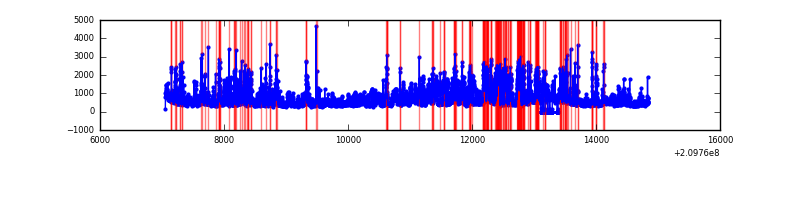 |
Top three noisy pixels from each quadrant. If the there are fewer than three noisy pixels in the level2.evt file, extra rows are filled as -1
| Pixel properties | Quadrant properties | ||||||
|---|---|---|---|---|---|---|---|
| Quadrant | DetID | PixID | Counts | Sigma | Mean | Median | Sigma |
| A | 0 | 31 | 110304 | 611.65 | 868 | 847 | 179.0 |
| A | 13 | 251 | 23108 | 124.39 | 868 | 847 | 179.0 |
| A | 15 | 234 | 9916 | 50.68 | 868 | 847 | 179.0 |
| B | 8 | 3 | 142503 | 850.91 | 876 | 856 | 166.5 |
| B | 12 | 0 | 100546 | 598.86 | 876 | 856 | 166.5 |
| B | 0 | 219 | 39976 | 235.0 | 876 | 856 | 166.5 |
| C | 9 | 247 | 1741628 | 9329.99 | 812 | 814 | 186.6 |
| C | 1 | 16 | 25221 | 130.81 | 812 | 814 | 186.6 |
| C | 9 | 202 | 11507 | 57.31 | 812 | 814 | 186.6 |
| D | 2 | 63 | 1463915 | 7189.67 | 832 | 805 | 203.5 |
| D | 2 | 136 | 421982 | 2069.65 | 832 | 805 | 203.5 |
| D | 13 | 235 | 156717 | 766.15 | 832 | 805 | 203.5 |
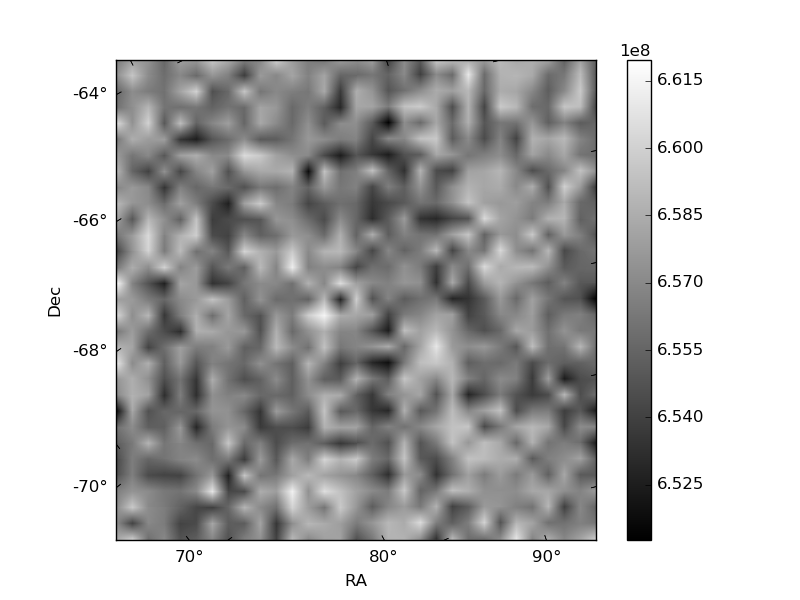
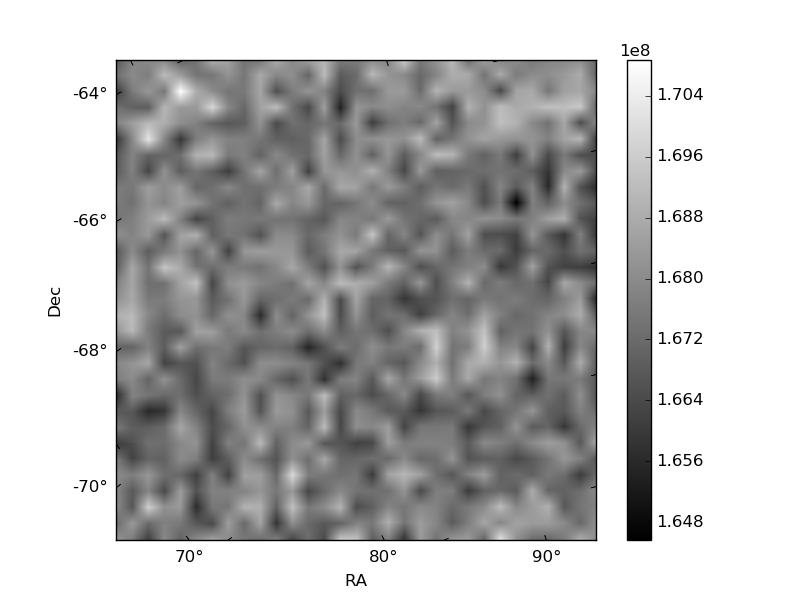
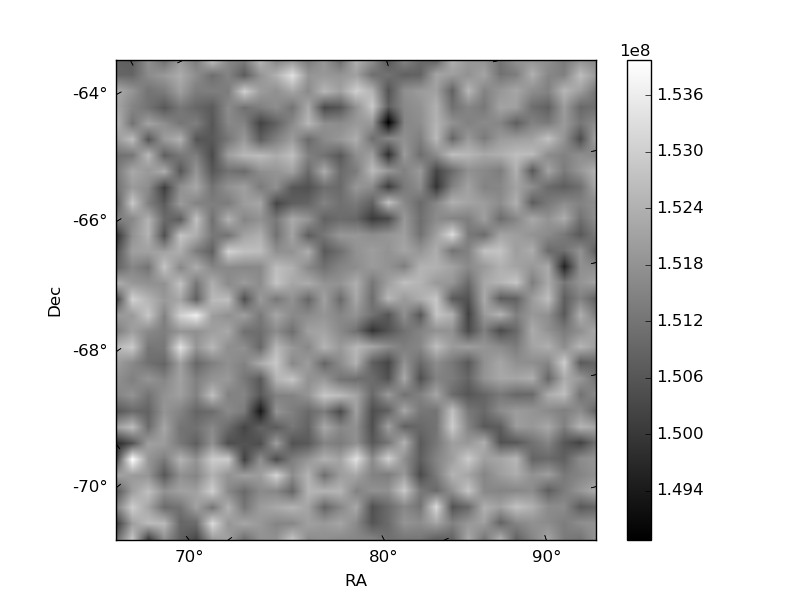
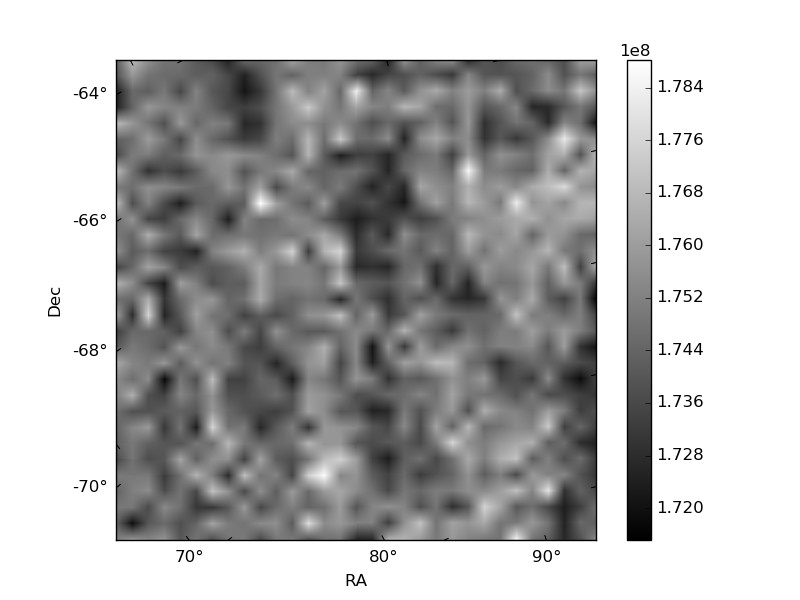
Histogram calculated using DETX and DETY for each event in the final _common_clean file
| Quadrant A | 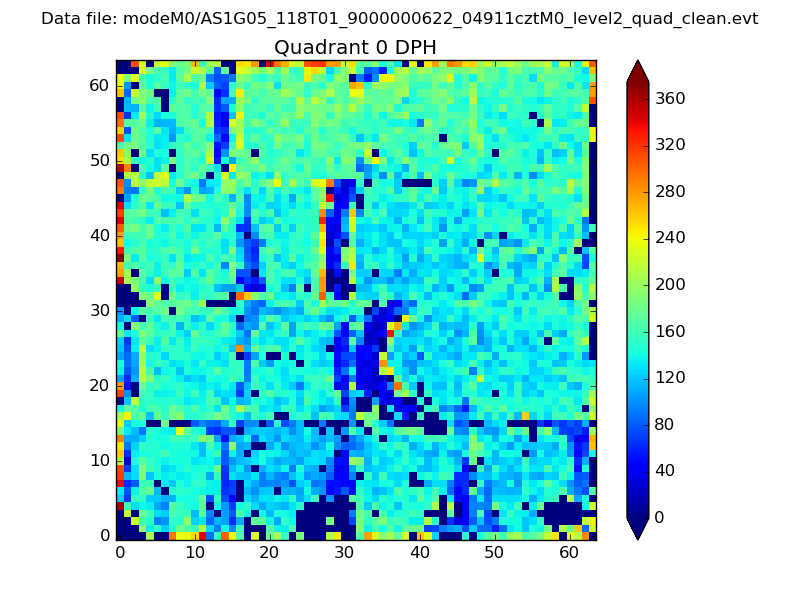 |
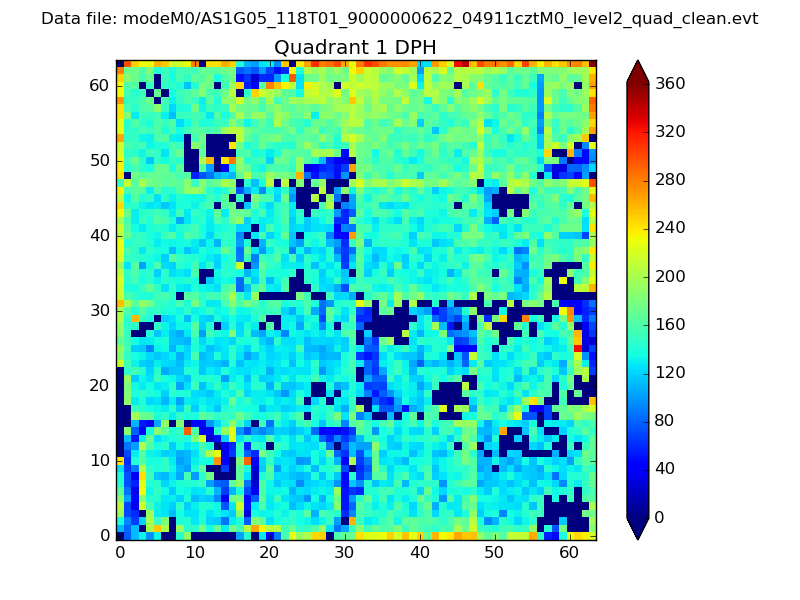 |
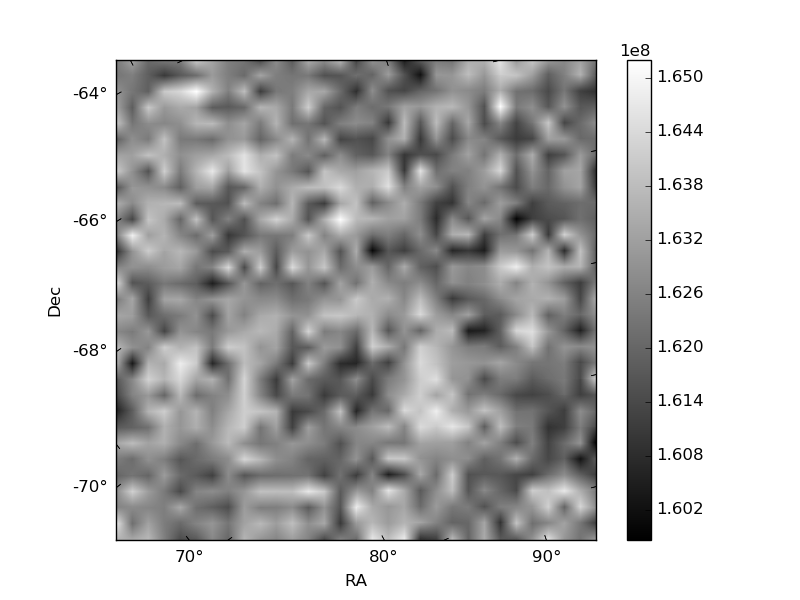
Quadrant B |
|---|---|---|---|
| Quadrant D | 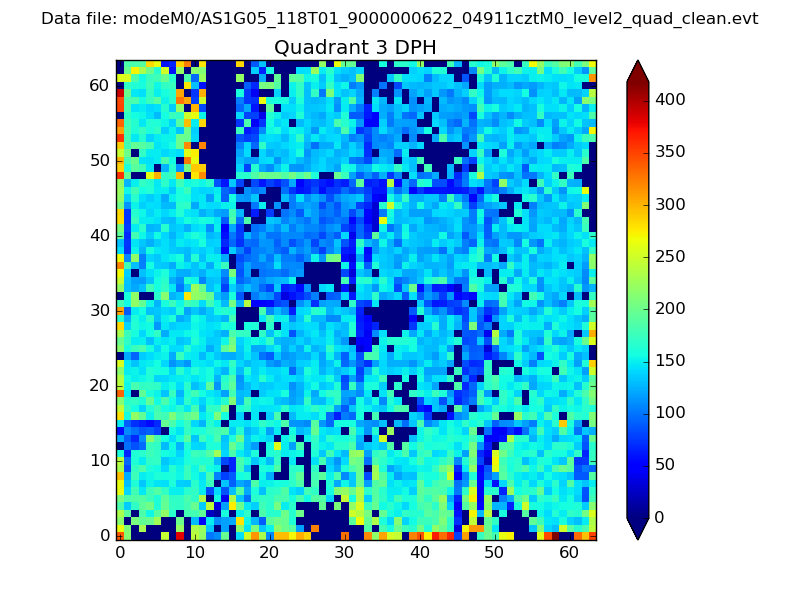 |
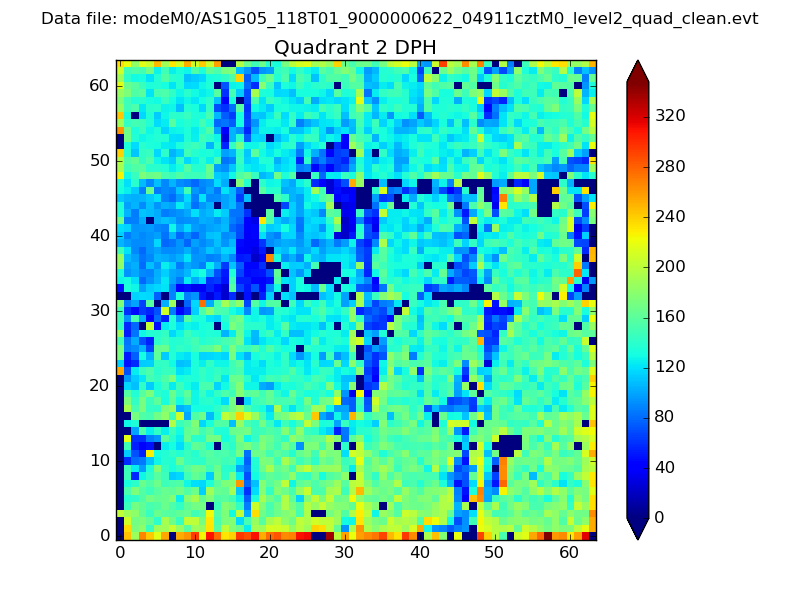 |
Quadrant C |
| Plot type | Count rate plots | Images |
|---|---|---|
| Comparison with Poisson distribution Blue bars denote a histogram of data divided into 1 sec bins. Red curve is a Poisson curve with rate = median count rate of data. |
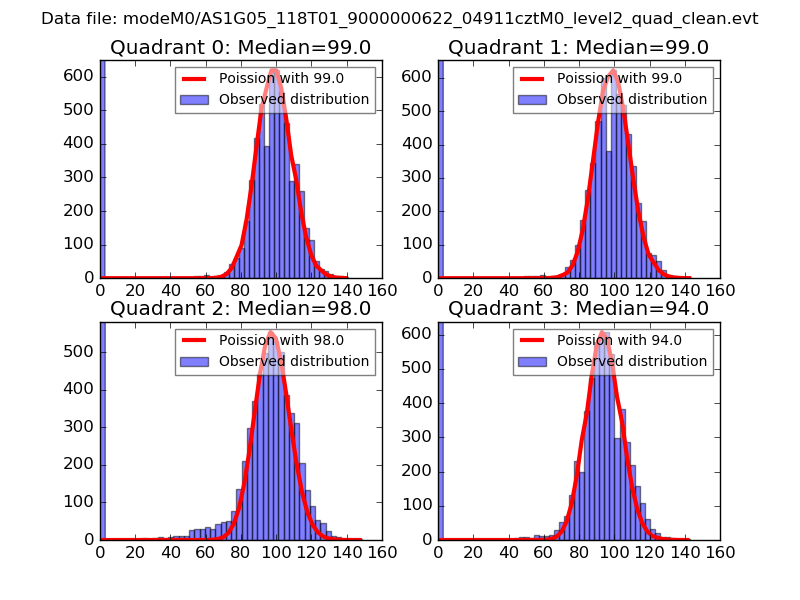 |
 |
| Quadrant-wise count rates Data is divided into 100 sec bins |
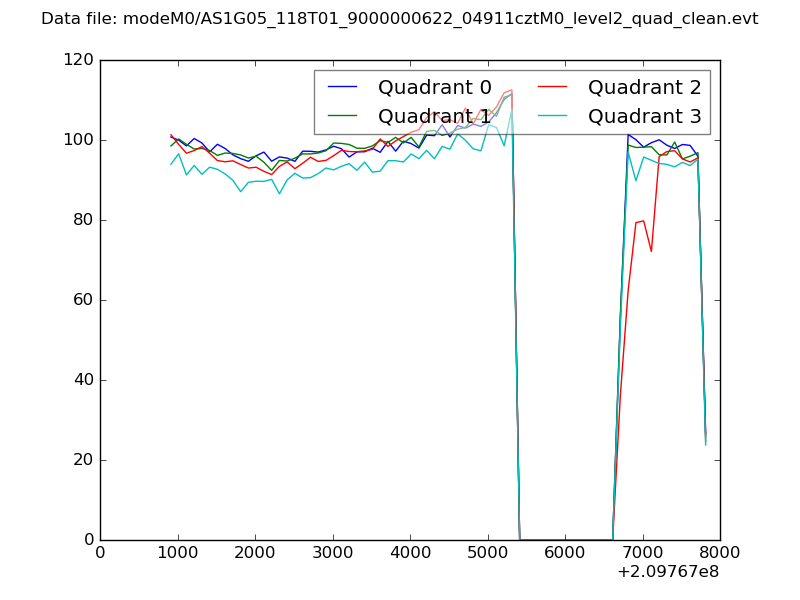 |
|
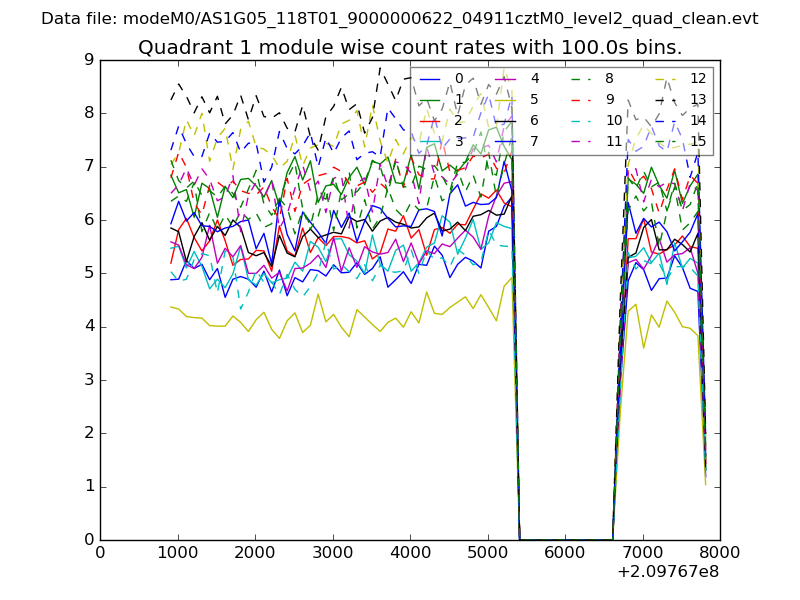
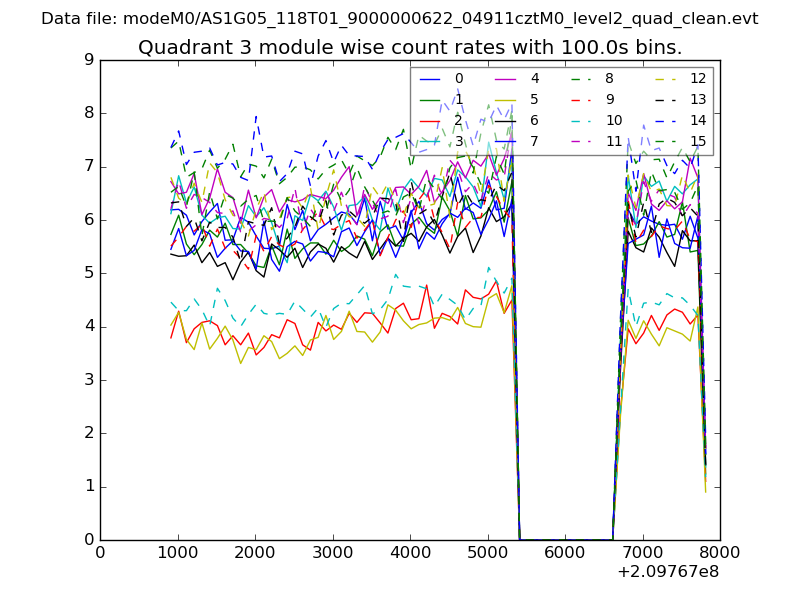
| Module-wise count rates for Quadrant A Data is divided into 100 sec bins |
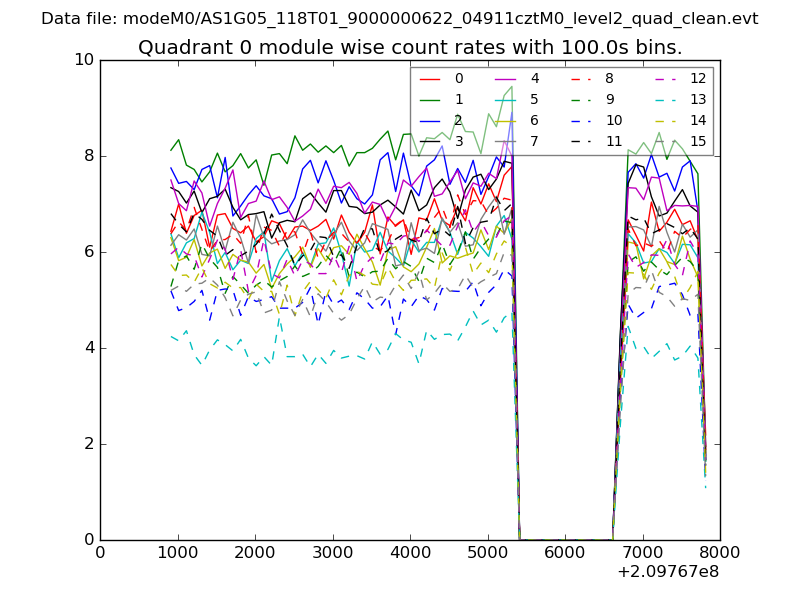 |
 |
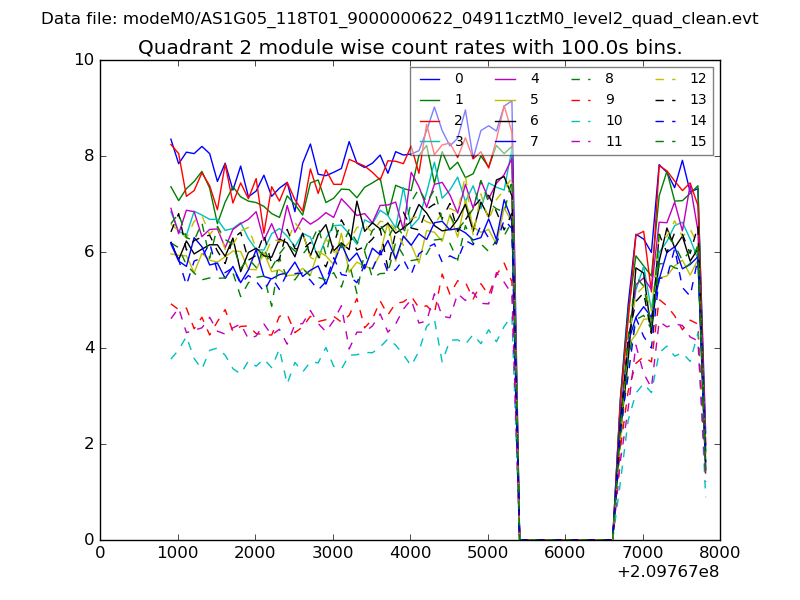
| Module-wise count rates for Quadrant B Data is divided into 100 sec bins |
 |
 |
| Module-wise count rates for Quadrant C Data is divided into 100 sec bins |
 |
 |
| Module-wise count rates for Quadrant D Data is divided into 100 sec bins |
 |
 |
| Parameter | Plot |
|---|---|
| CZT HV Monitor | 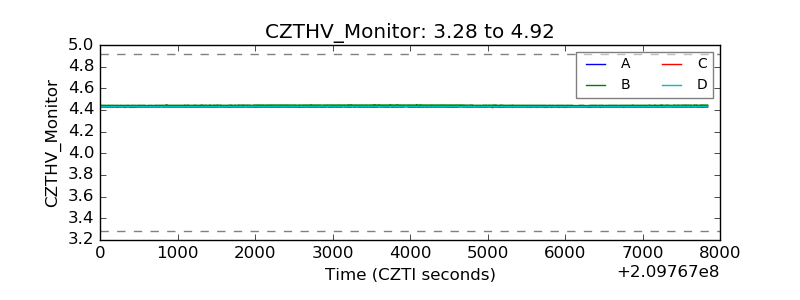 |
| D_VDD | 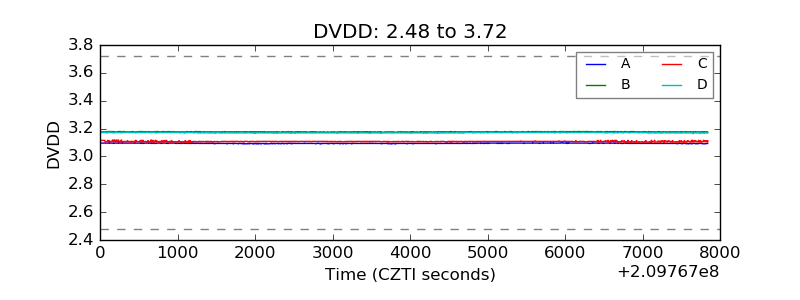 |
| Temperature 1 | 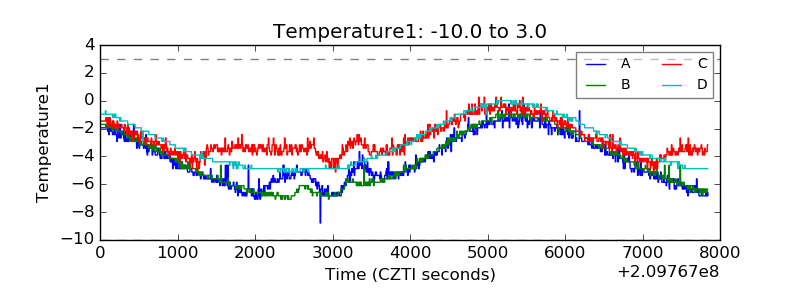 |
| Veto HV Monitor | 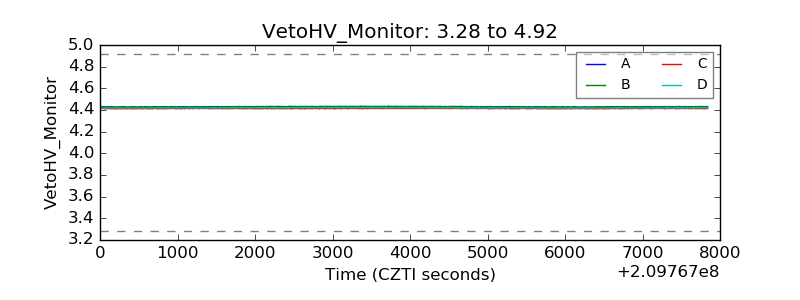 |
| Veto LLD | 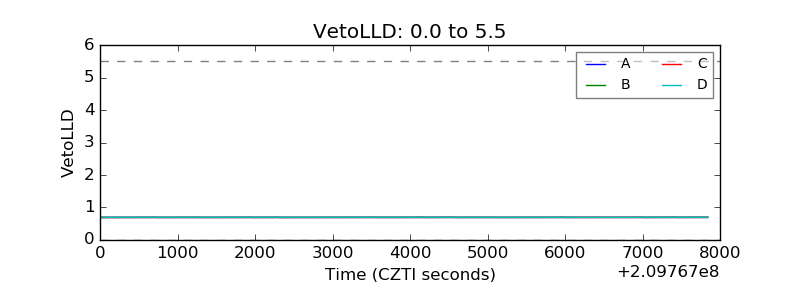 |
| Alpha Counter | 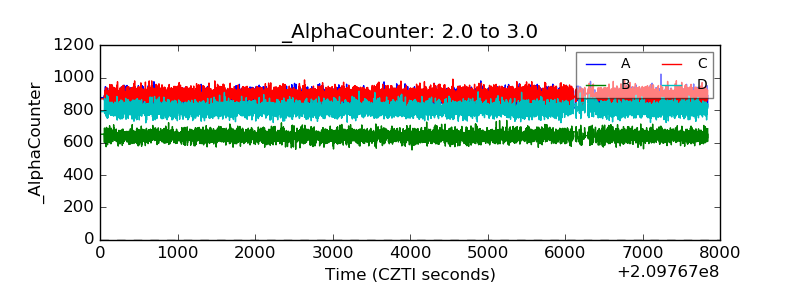 |
| _CPM_Rate | 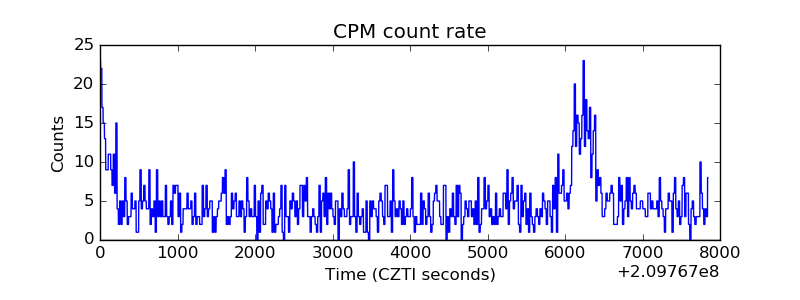 |
| CZT Counter | 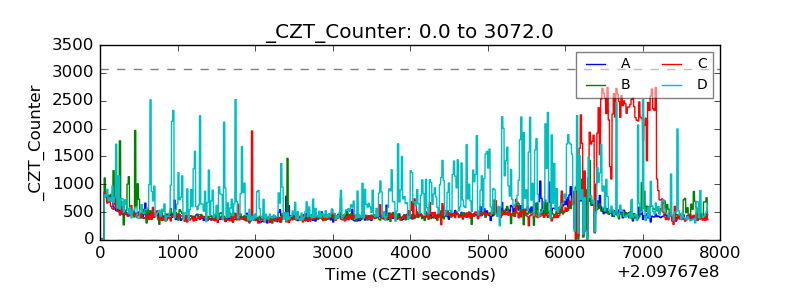 |
| +2.5 Volts monitor |  |
| +5 Volts monitor |  |
| _ROLL_ROT | 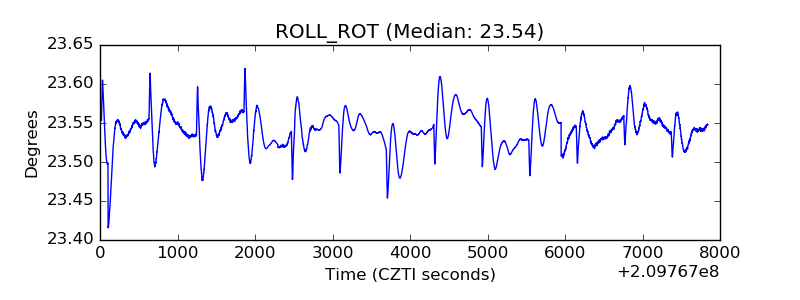 |
| _Roll_DEC | 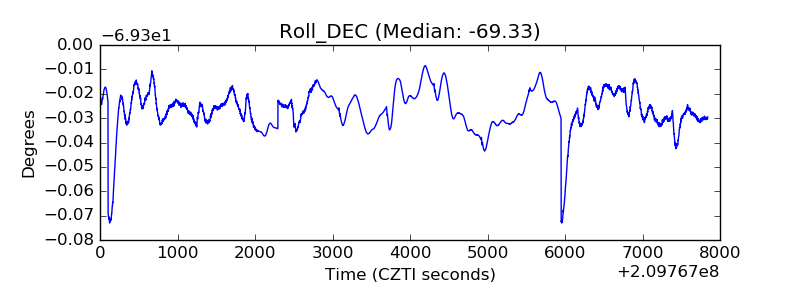 |
| _Roll_RA | 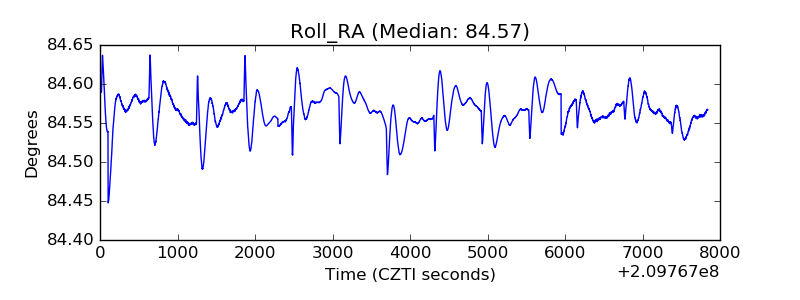 |
| Veto Counter | 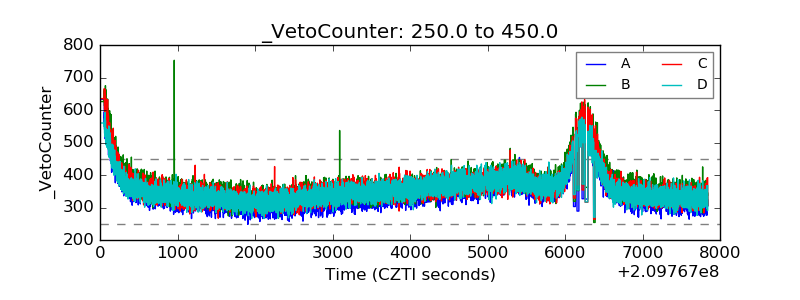 |