| Param | Original file | Final file |
|---|---|---|
| Filename | modeM0/AS1G05_118T01_9000000622_04912cztM0_level2.evt | modeM0/AS1G05_118T01_9000000622_04912cztM0_level2_quad_clean.evt |
| Size (bytes) | 16,836,480 | 3,859,200 |
| Size | 16.1 MB | 3.7 MB |
| Events in quadrant A | 145,408 | 26,431 |
| Events in quadrant B | 141,878 | 30,252 |
| Events in quadrant C | 148,545 | 24,689 |
| Events in quadrant D | 49,644 | 5,488 |
| Mode M0 | |||
|---|---|---|---|
| Quadrant | BADHDUFLAG | Total packets | Discarded packets |
| A | 0 | 12753 | 12157 |
| B | 0 | 13112 | 12524 |
| C | 0 | 17271 | 16621 |
| D | 0 | 21410 | 21207 |
| Mode M9 | |||
|---|---|---|---|
| Quadrant | BADHDUFLAG | Total packets | Discarded packets |
| A | 0 | 3 | 0 |
| B | 1 | 3 | 0 |
| C | 1 | -1 | -1 |
| D | 1 | -1 | -1 |
| Mode SS | |||
|---|---|---|---|
| Quadrant | BADHDUFLAG | Total packets | Discarded packets |
| A | 0 | 123 | 92 |
| B | 0 | 123 | 90 |
| C | 0 | 123 | 91 |
| D | 0 | 123 | 92 |
| Quadrant | Total seconds | Saturated seconds | Saturation percentage |
|---|---|---|---|
| A | 299 | 1 | 0.334448% |
| B | 294 | 0 | 0.000000% |
| C | 325 | 0 | 0.000000% |
| D | 102 | 0 | 0.000000% |
Noise dominated data is calculated using 1-second bins in cleaned event files. If a bin has >2000 counts, and if more than 50% of those come from <1% of pixels, then it is considered to be noise-dominated and hence unusable.
| Quadrant | # 1 sec bins | Bins with >0 counts | Bins with >2000 counts | High rate bins dominated by noise | Noise dominated (total time) | Noise dominated (detector-on time) | Marked lightcurve |
|---|---|---|---|---|---|---|---|
| A | 4426 | 595 | 0 | 0 | 0.00% | 0.00% | 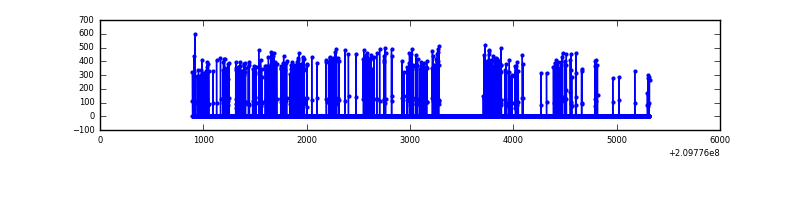 |
| B | 4426 | 585 | 0 | 0 | 0.00% | 0.00% | 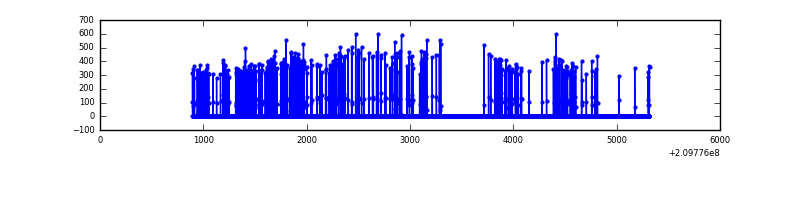 |
| C | 4426 | 649 | 0 | 0 | 0.00% | 0.00% | 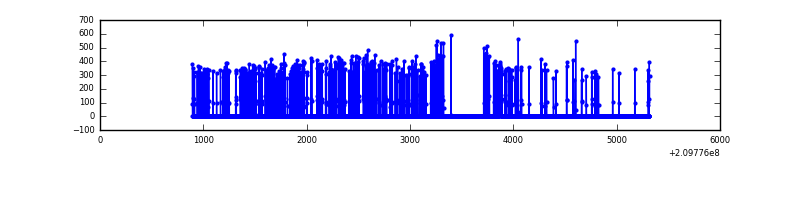 |
| D | 3184 | 197 | 0 | 0 | 0.00% | 0.00% | 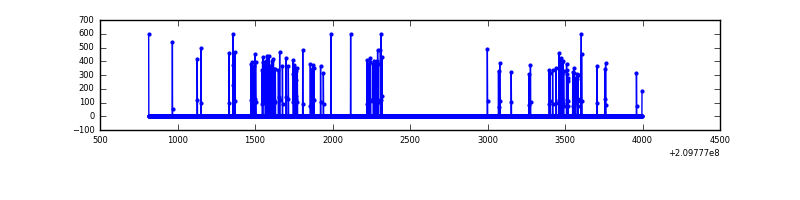 |
Top three noisy pixels from each quadrant. If the there are fewer than three noisy pixels in the level2.evt file, extra rows are filled as -1
| Pixel properties | Quadrant properties | ||||||
|---|---|---|---|---|---|---|---|
| Quadrant | DetID | PixID | Counts | Sigma | Mean | Median | Sigma |
| A | 0 | 31 | 7345 | 786.45 | 34 | 33 | 9.3 |
| A | 13 | 251 | 3502 | 373.11 | 34 | 33 | 9.3 |
| A | 15 | 174 | 648 | 66.15 | 34 | 33 | 9.3 |
| B | 8 | 3 | 4475 | 515.39 | 33 | 32 | 8.6 |
| B | 15 | 204 | 4193 | 482.68 | 33 | 32 | 8.6 |
| B | 0 | 219 | 772 | 85.84 | 33 | 32 | 8.6 |
| C | 9 | 247 | 845 | 76.14 | 37 | 37 | 10.6 |
| C | 8 | 128 | 668 | 59.46 | 37 | 37 | 10.6 |
| C | 1 | 16 | 377 | 32.04 | 37 | 37 | 10.6 |
| D | 2 | 63 | 1607 | 353.77 | 11 | 11 | 4.5 |
| D | 2 | 136 | 1247 | 273.97 | 11 | 11 | 4.5 |
| D | 2 | 234 | 1166 | 256.02 | 11 | 11 | 4.5 |
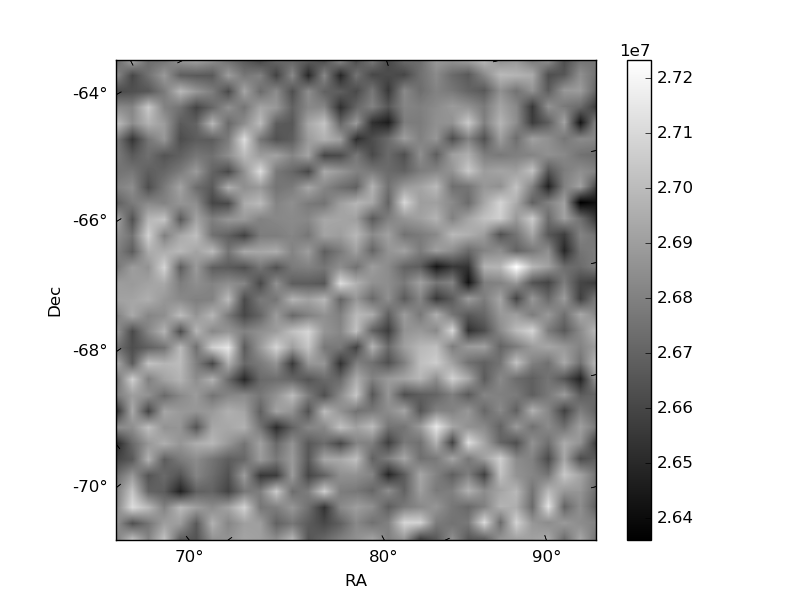
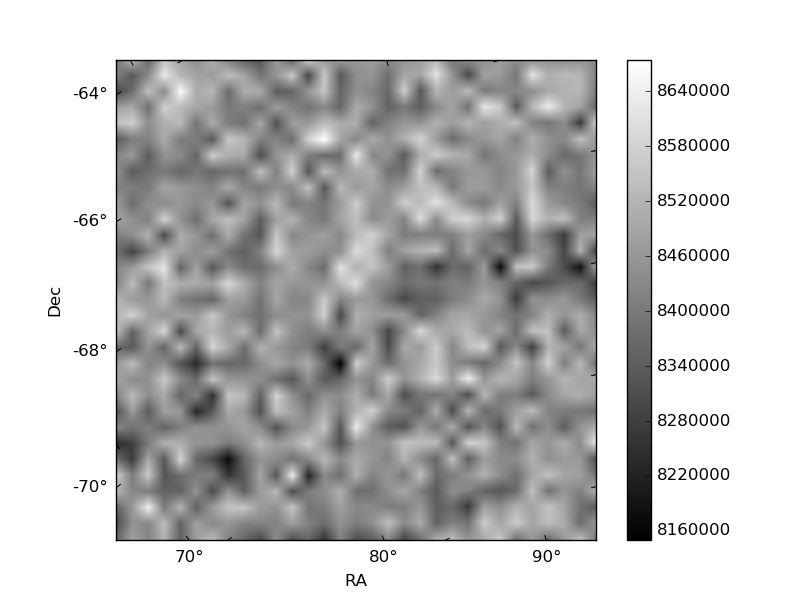
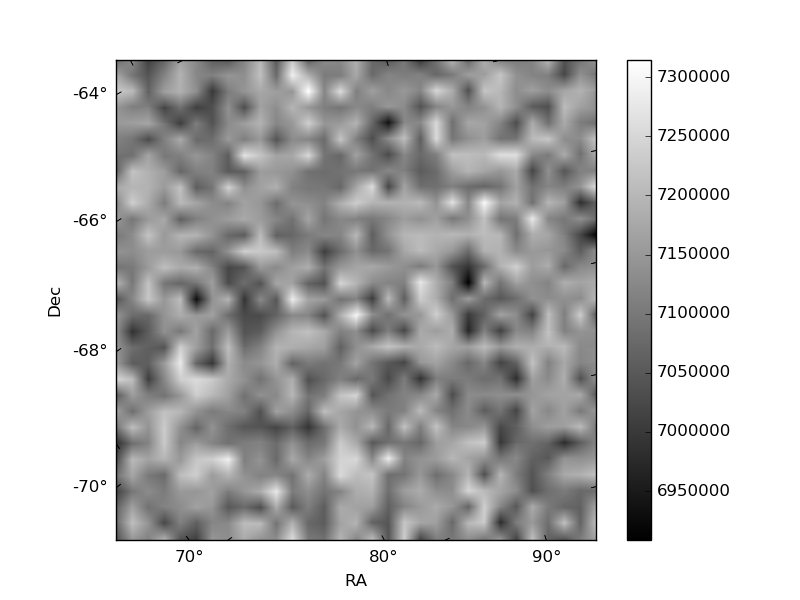
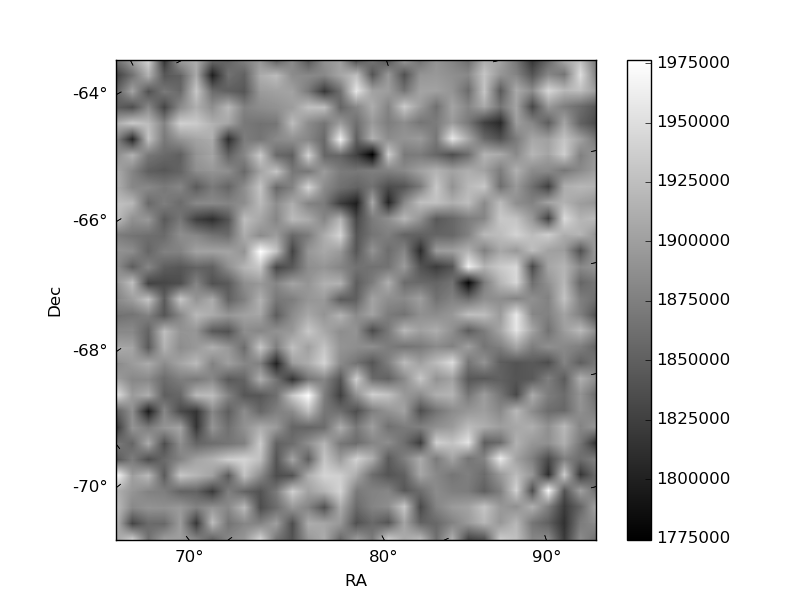
Histogram calculated using DETX and DETY for each event in the final _common_clean file
| Quadrant A | 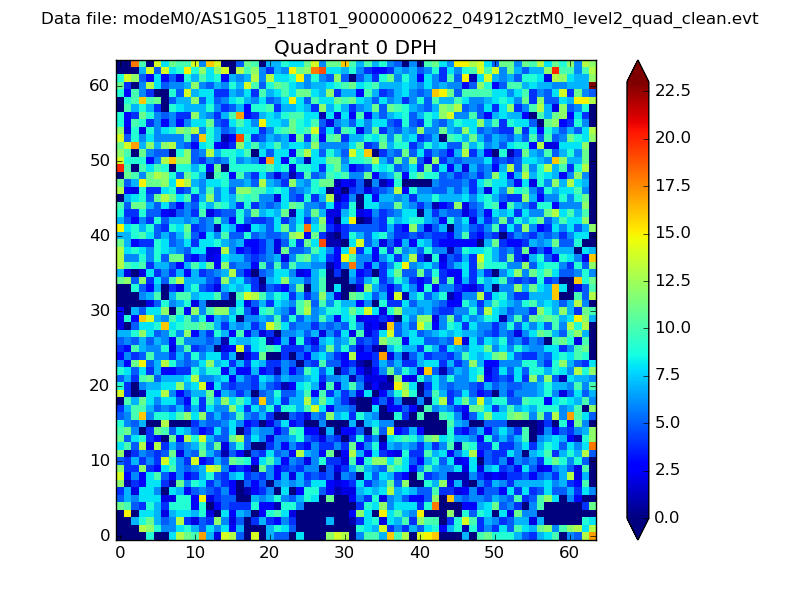 |
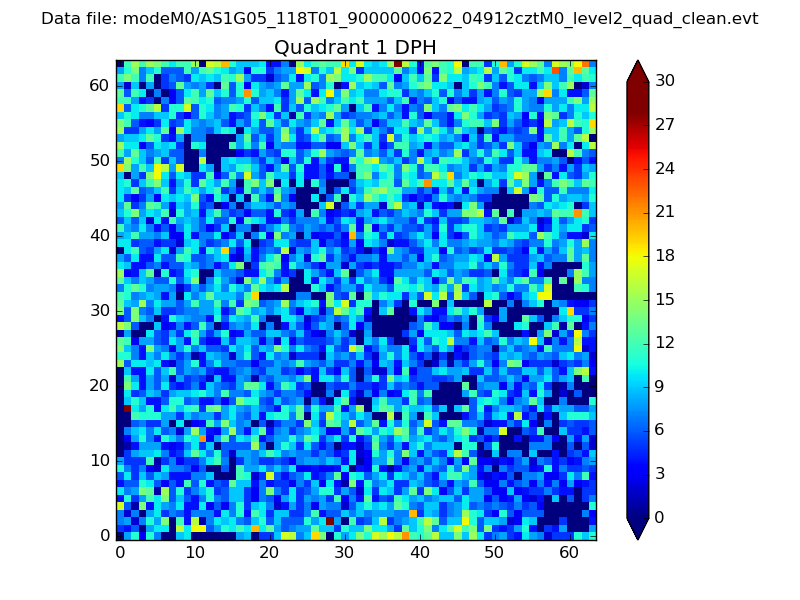 |
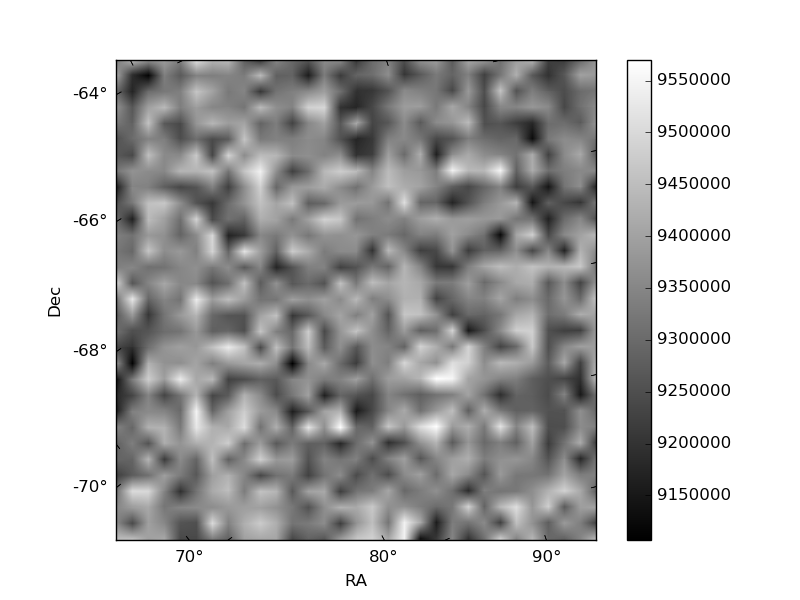
Quadrant B |
|---|---|---|---|
| Quadrant D | 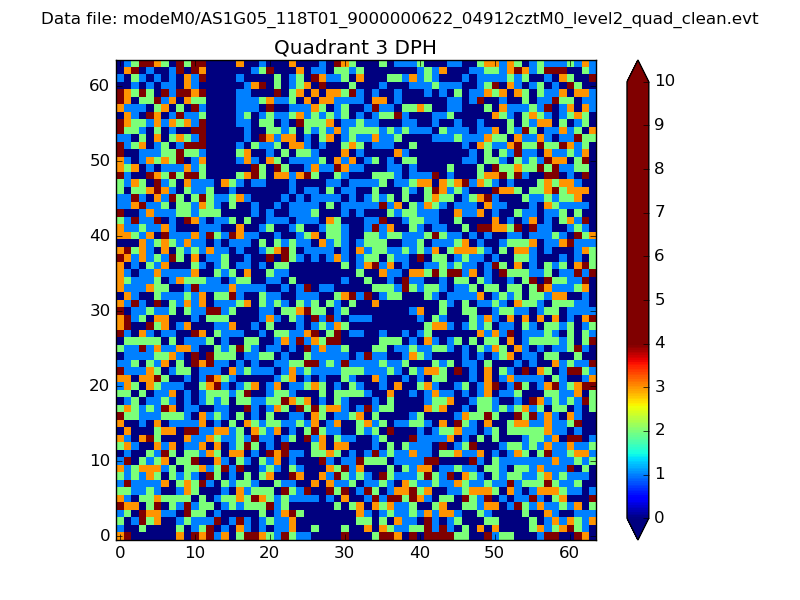 |
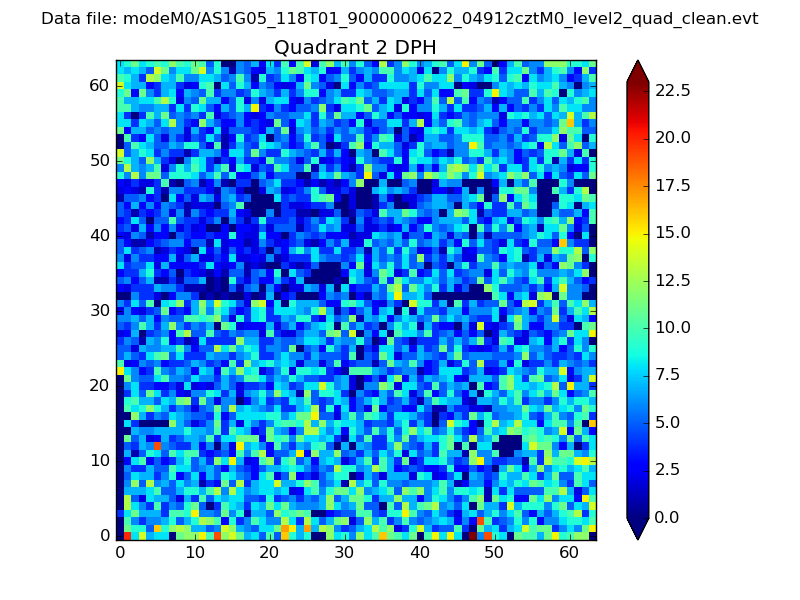 |
Quadrant C |
| Plot type | Count rate plots | Images |
|---|---|---|
| Comparison with Poisson distribution Blue bars denote a histogram of data divided into 1 sec bins. Red curve is a Poisson curve with rate = median count rate of data. |
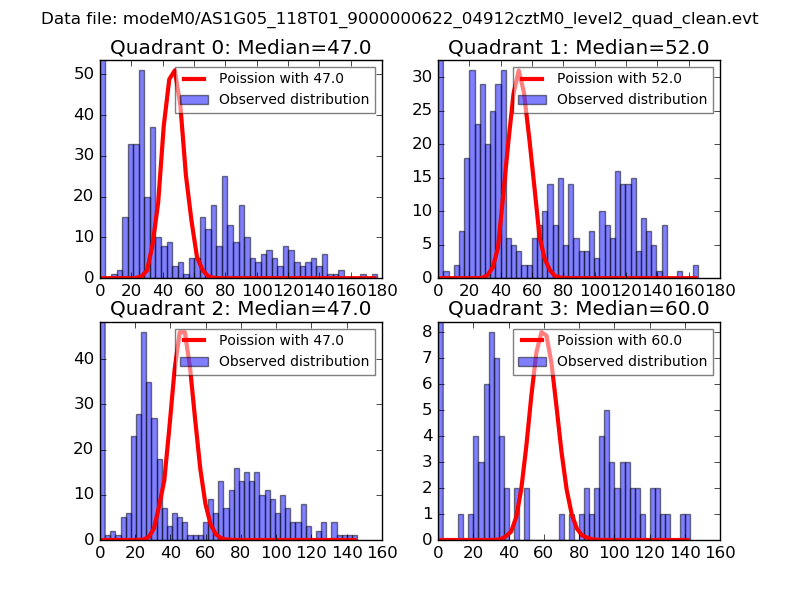 |
 |
| Quadrant-wise count rates Data is divided into 100 sec bins |
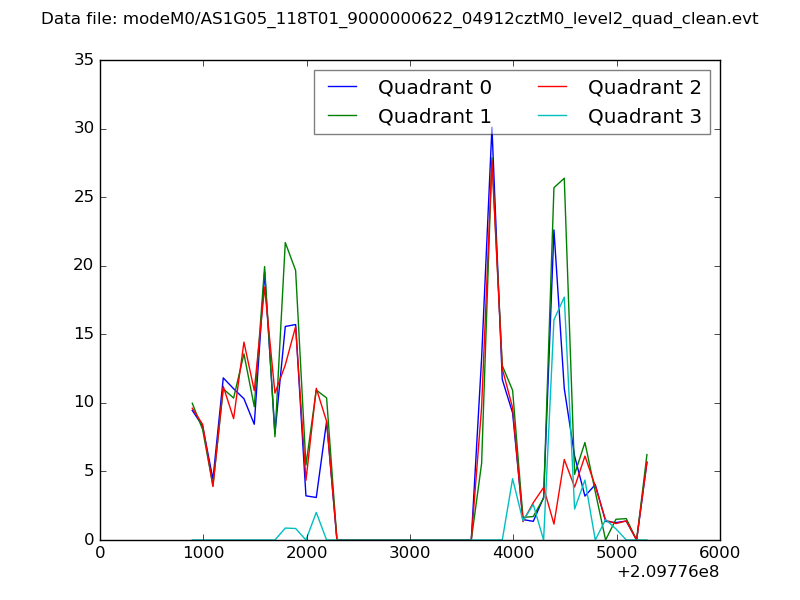 |
|
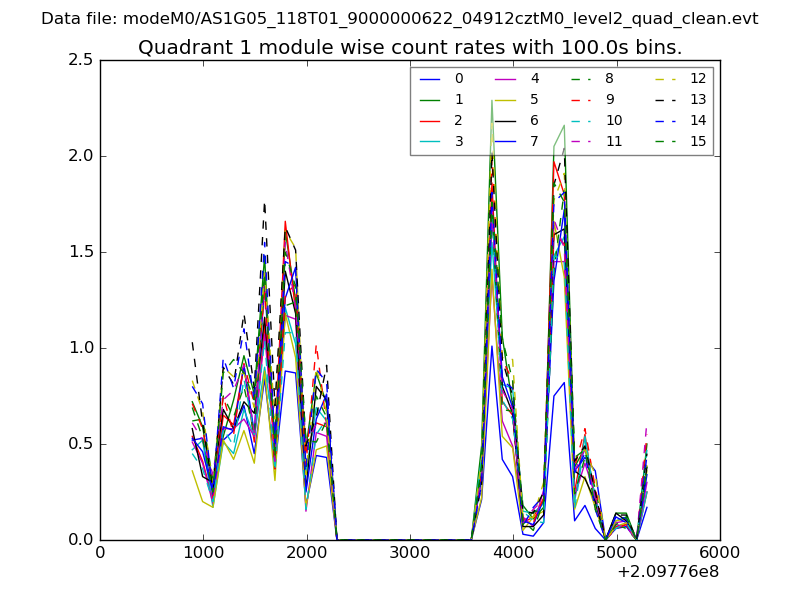
| Module-wise count rates for Quadrant A Data is divided into 100 sec bins |
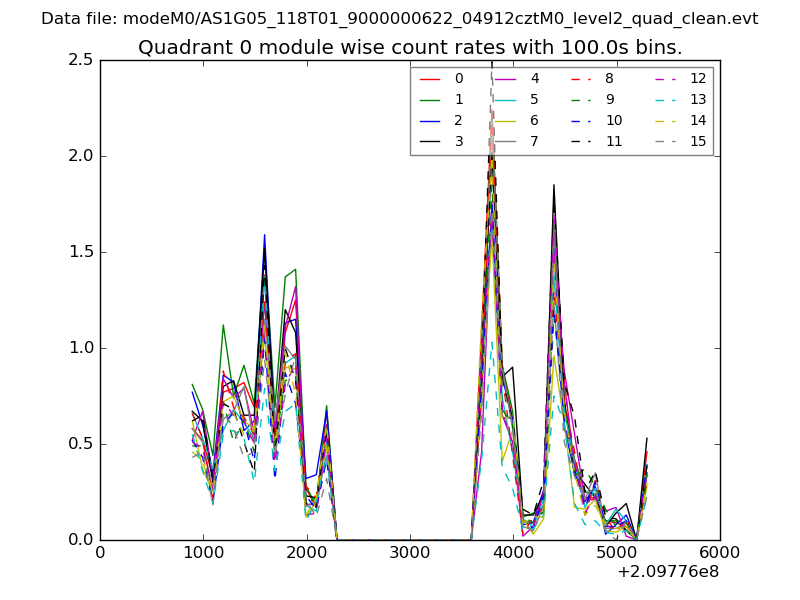 |
 |
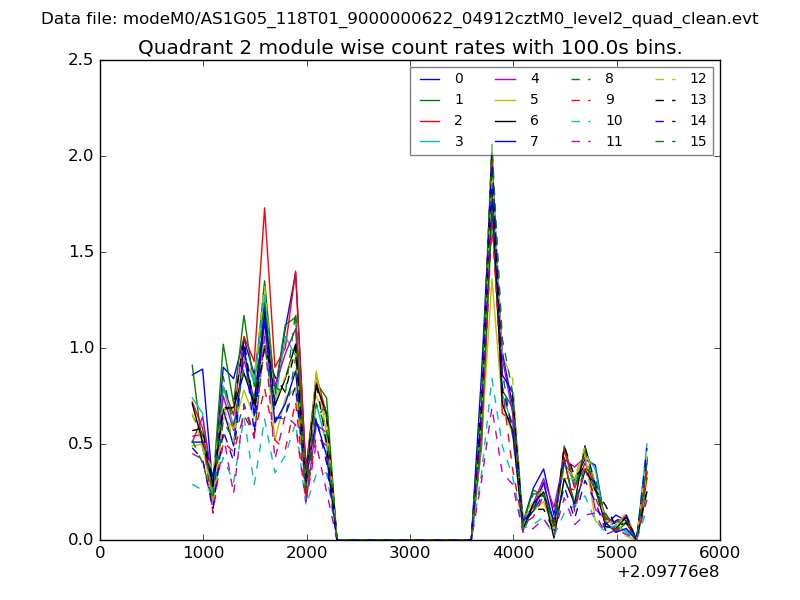
| Module-wise count rates for Quadrant B Data is divided into 100 sec bins |
 |
 |
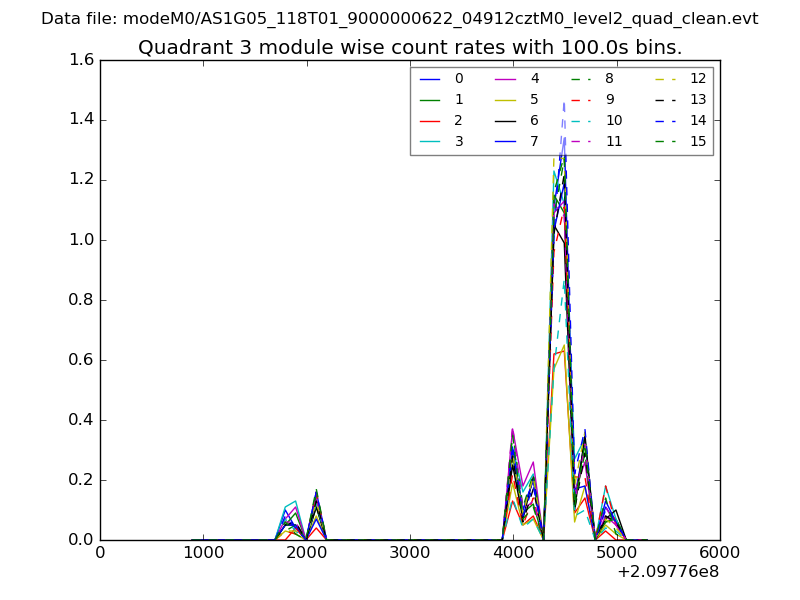
| Module-wise count rates for Quadrant C Data is divided into 100 sec bins |
 |
 |
| Module-wise count rates for Quadrant D Data is divided into 100 sec bins |
 |
 |
| Parameter | Plot |
|---|---|
| CZT HV Monitor | 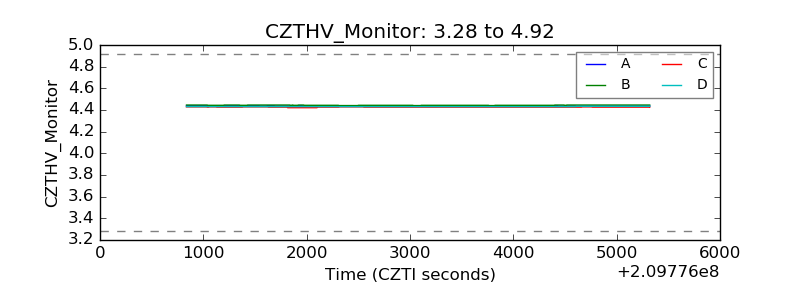 |
| D_VDD |  |
| Temperature 1 | 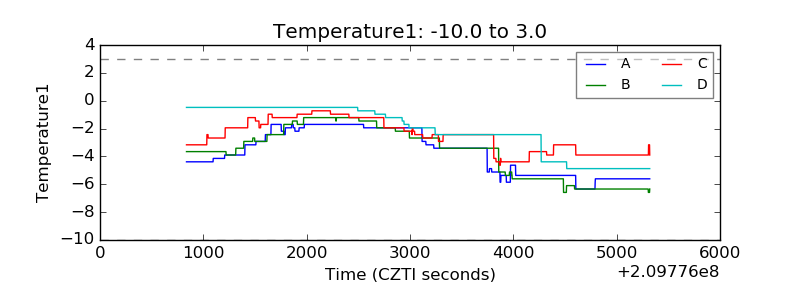 |
| Veto HV Monitor | 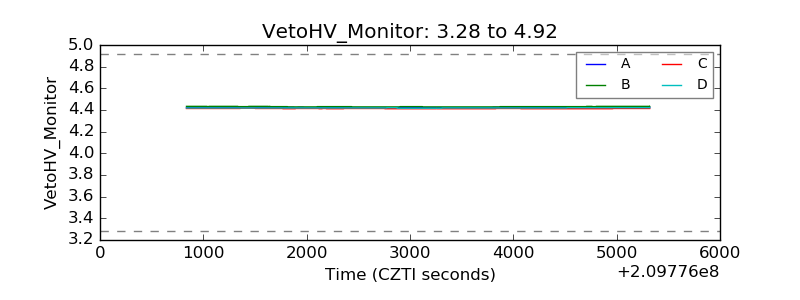 |
| Veto LLD | 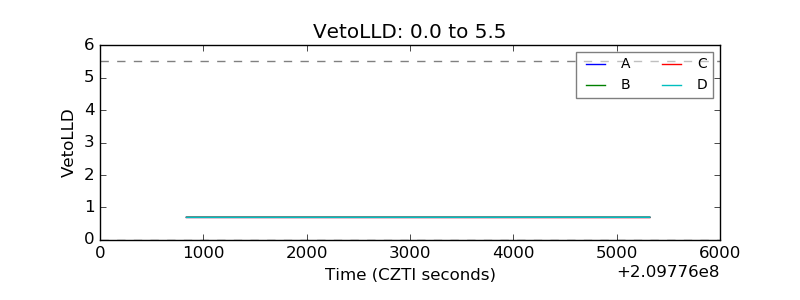 |
| Alpha Counter | 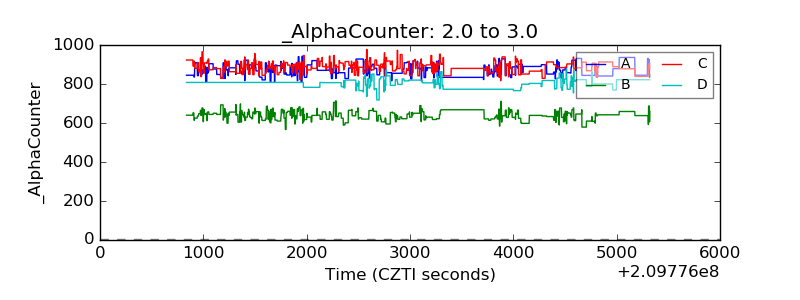 |
| _CPM_Rate | 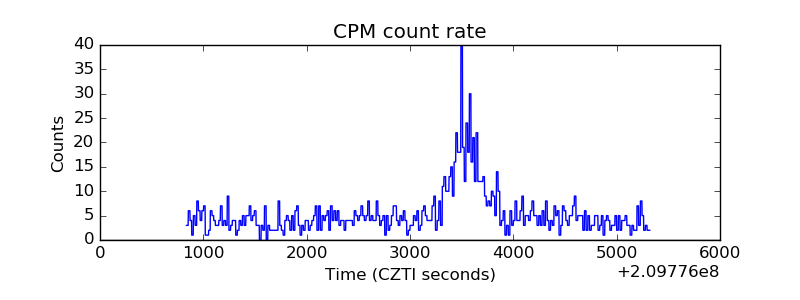 |
| CZT Counter | 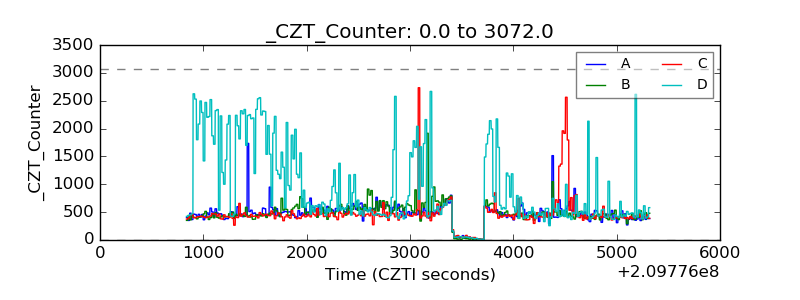 |
| +2.5 Volts monitor |  |
| +5 Volts monitor |  |
| _ROLL_ROT | 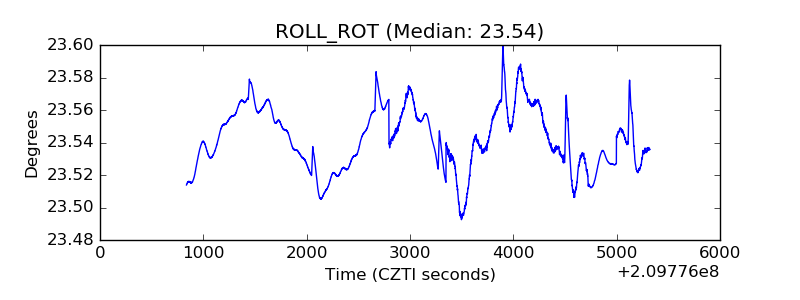 |
| _Roll_DEC | 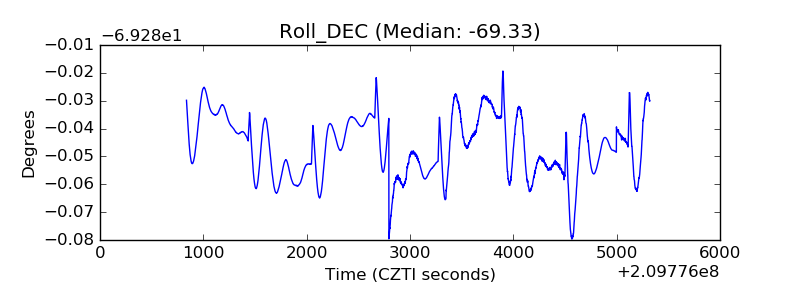 |
| _Roll_RA | 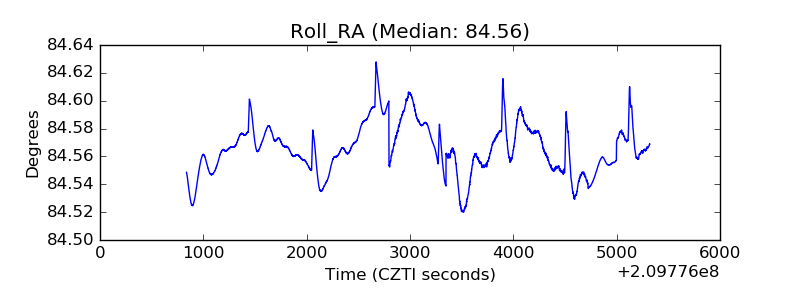 |
| Veto Counter | 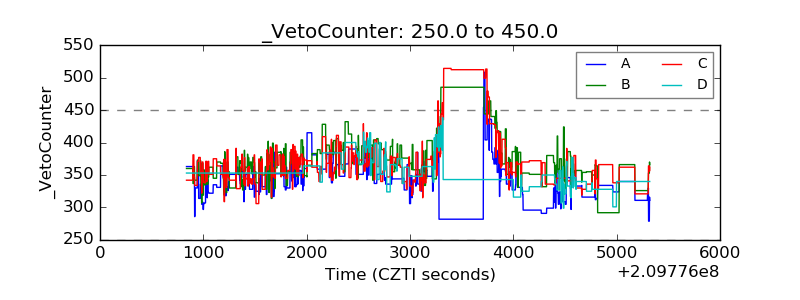 |