| Param | Original file | Final file |
|---|---|---|
| Filename | modeM0/AS1G05_118T01_9000000622_04918cztM0_level2.evt | modeM0/AS1G05_118T01_9000000622_04918cztM0_level2_quad_clean.evt |
| Size (bytes) | 1,829,275,200 | 265,714,560 |
| Size | 1.7 GB | 253.4 MB |
| Events in quadrant A | 9,960,439 | 1,659,923 |
| Events in quadrant B | 10,816,768 | 1,667,610 |
| Events in quadrant C | 14,587,899 | 1,632,358 |
| Events in quadrant D | 18,534,481 | 1,556,536 |
| Mode M0 | |||
|---|---|---|---|
| Quadrant | BADHDUFLAG | Total packets | Discarded packets |
| A | 0 | 45437 | 6 |
| B | 0 | 47288 | 6 |
| C | 0 | 59161 | 4 |
| D | 0 | 70359 | 22 |
| Mode M9 | |||
|---|---|---|---|
| Quadrant | BADHDUFLAG | Total packets | Discarded packets |
| A | 0 | 27 | 0 |
| B | 0 | 26 | 0 |
| C | 0 | 26 | 0 |
| D | 0 | 27 | 0 |
| Mode SS | |||
|---|---|---|---|
| Quadrant | BADHDUFLAG | Total packets | Discarded packets |
| A | 0 | 452 | 0 |
| B | 0 | 452 | 0 |
| C | 0 | 452 | 0 |
| D | 0 | 452 | 0 |
| Quadrant | Total seconds | Saturated seconds | Saturation percentage |
|---|---|---|---|
| A | 22235 | 128 | 0.575669% |
| B | 22235 | 137 | 0.616146% |
| C | 22236 | 1521 | 6.840259% |
| D | 22233 | 2620 | 11.784285% |
Noise dominated data is calculated using 1-second bins in cleaned event files. If a bin has >2000 counts, and if more than 50% of those come from <1% of pixels, then it is considered to be noise-dominated and hence unusable.
| Quadrant | # 1 sec bins | Bins with >0 counts | Bins with >2000 counts | High rate bins dominated by noise | Noise dominated (total time) | Noise dominated (detector-on time) | Marked lightcurve |
|---|---|---|---|---|---|---|---|
| A | 24250 | 22237 | 23 | 23 | 0.09% | 0.10% | 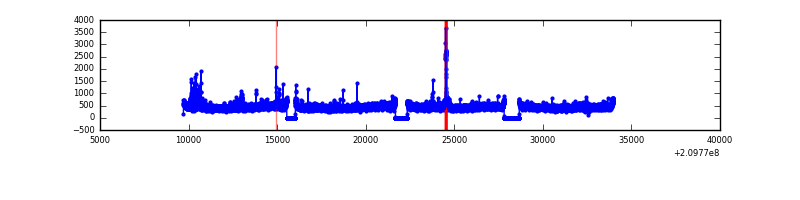 |
| B | 24250 | 22236 | 23 | 23 | 0.09% | 0.10% | 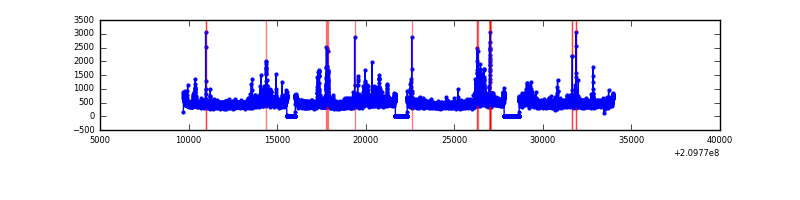 |
| C | 24250 | 22236 | 1297 | 1297 | 5.35% | 5.83% | 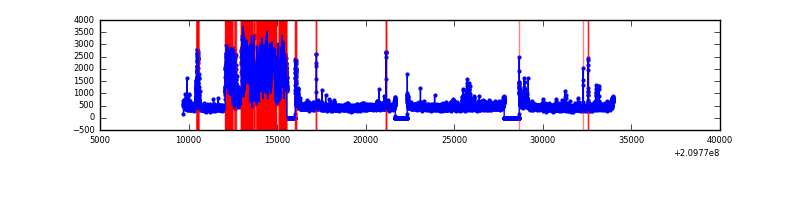 |
| D | 24250 | 22235 | 1980 | 1980 | 8.16% | 8.90% | 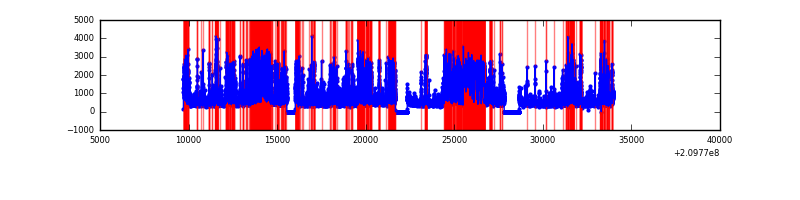 |
Top three noisy pixels from each quadrant. If the there are fewer than three noisy pixels in the level2.evt file, extra rows are filled as -1
| Pixel properties | Quadrant properties | ||||||
|---|---|---|---|---|---|---|---|
| Quadrant | DetID | PixID | Counts | Sigma | Mean | Median | Sigma |
| A | 15 | 174 | 173519 | 342.31 | 2472 | 2413 | 499.9 |
| A | 13 | 251 | 113250 | 221.74 | 2472 | 2413 | 499.9 |
| A | 0 | 31 | 68287 | 131.79 | 2472 | 2413 | 499.9 |
| B | 7 | 221 | 381445 | 799.76 | 2499 | 2439 | 473.9 |
| B | 15 | 204 | 217778 | 454.4 | 2499 | 2439 | 473.9 |
| B | 4 | 48 | 181503 | 377.85 | 2499 | 2439 | 473.9 |
| C | 9 | 247 | 5236083 | 9622.67 | 2362 | 2375 | 543.9 |
| C | 1 | 16 | 52365 | 91.91 | 2362 | 2375 | 543.9 |
| C | 12 | 4 | 34934 | 59.86 | 2362 | 2375 | 543.9 |
| D | 2 | 63 | 6015246 | 10626.78 | 2332 | 2260 | 565.8 |
| D | 2 | 33 | 1304159 | 2300.85 | 2332 | 2260 | 565.8 |
| D | 2 | 136 | 684818 | 1206.29 | 2332 | 2260 | 565.8 |
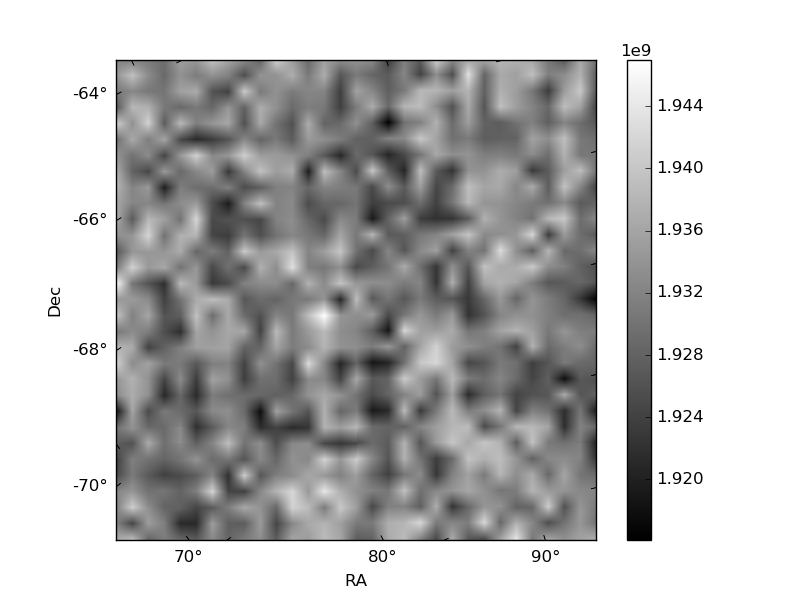
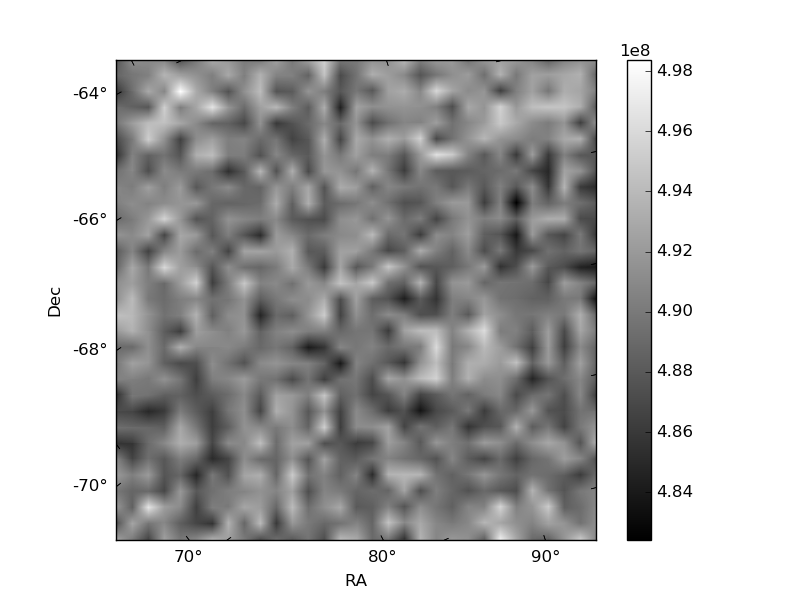
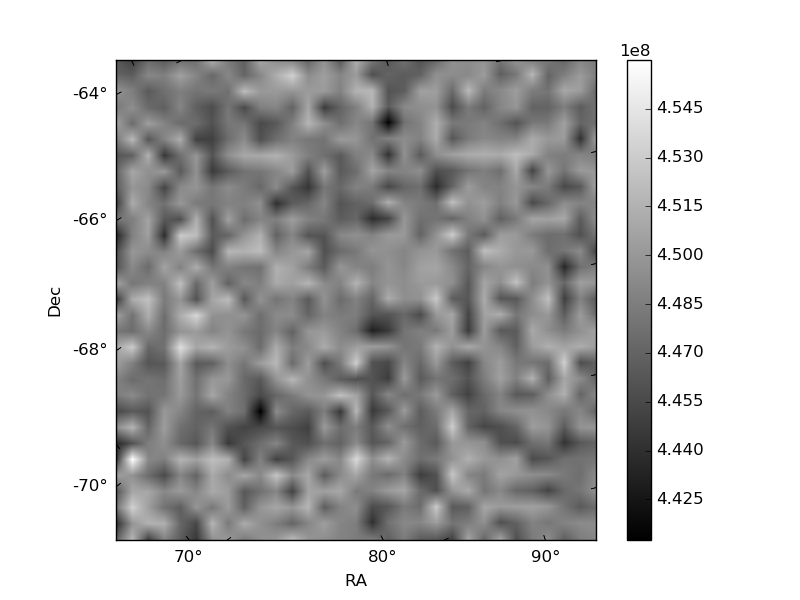
Histogram calculated using DETX and DETY for each event in the final _common_clean file
| Quadrant A | 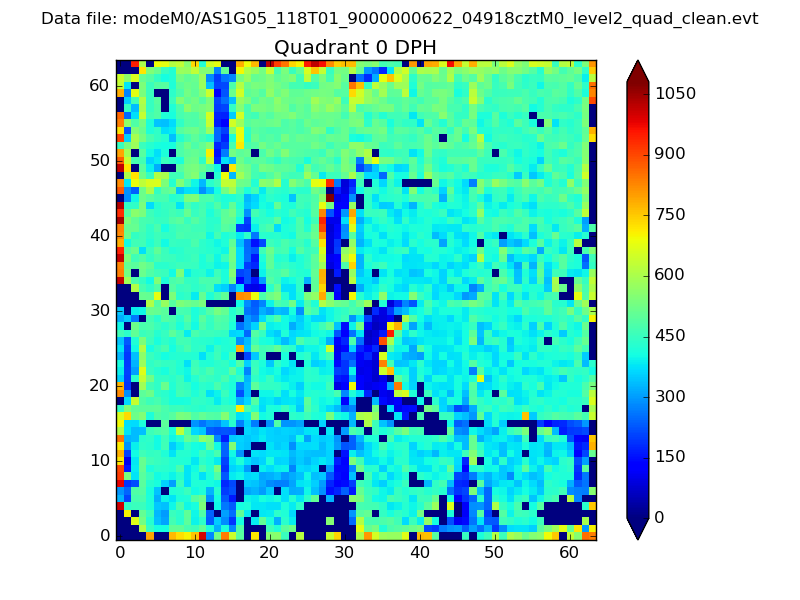 |
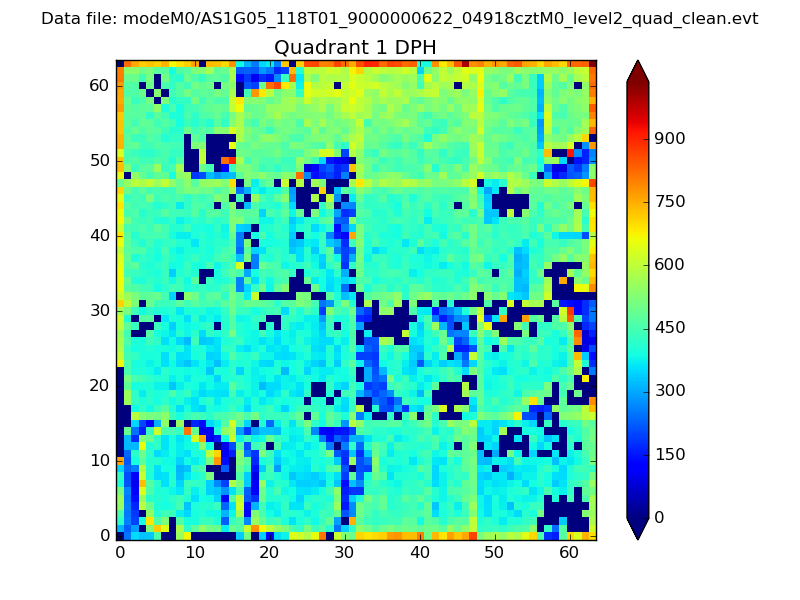 |
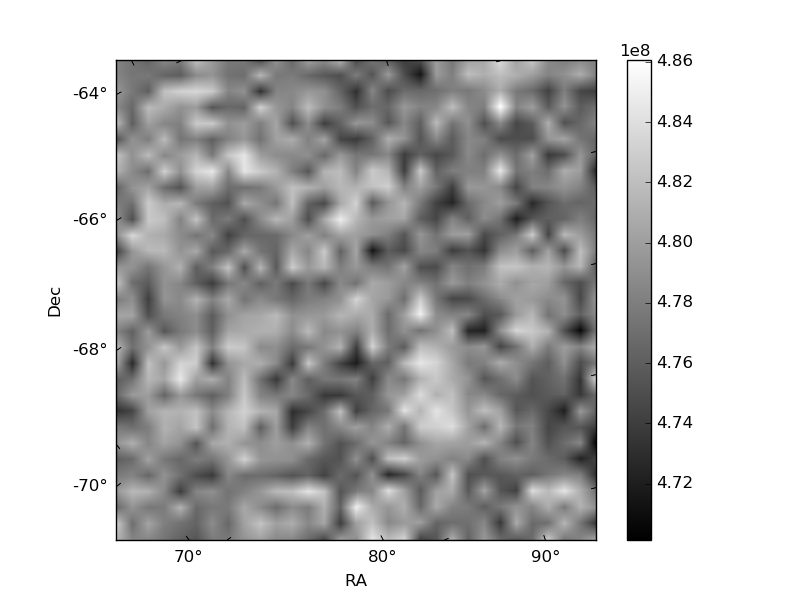
Quadrant B |
|---|---|---|---|
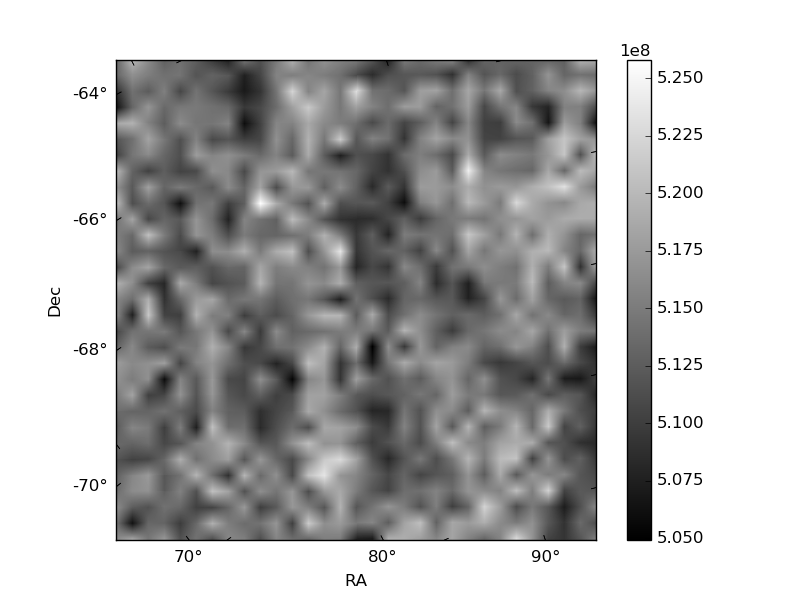
| Quadrant D | 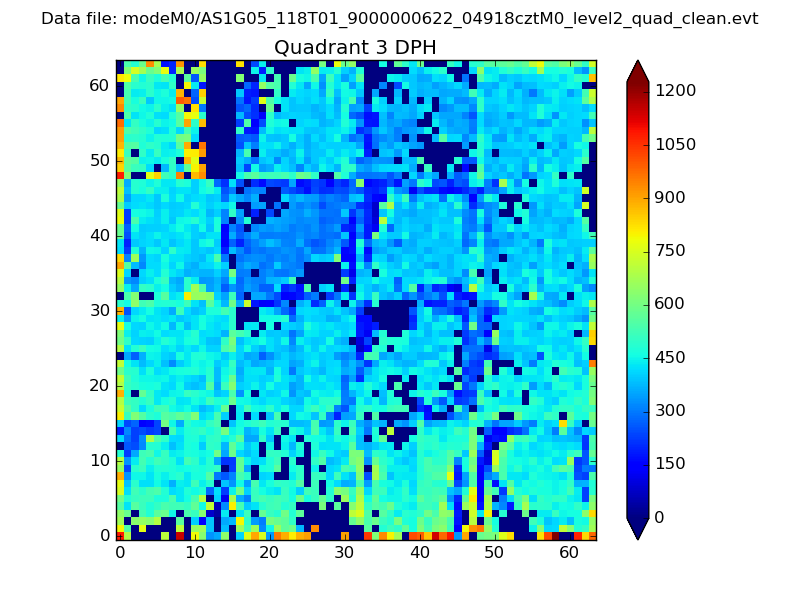 |
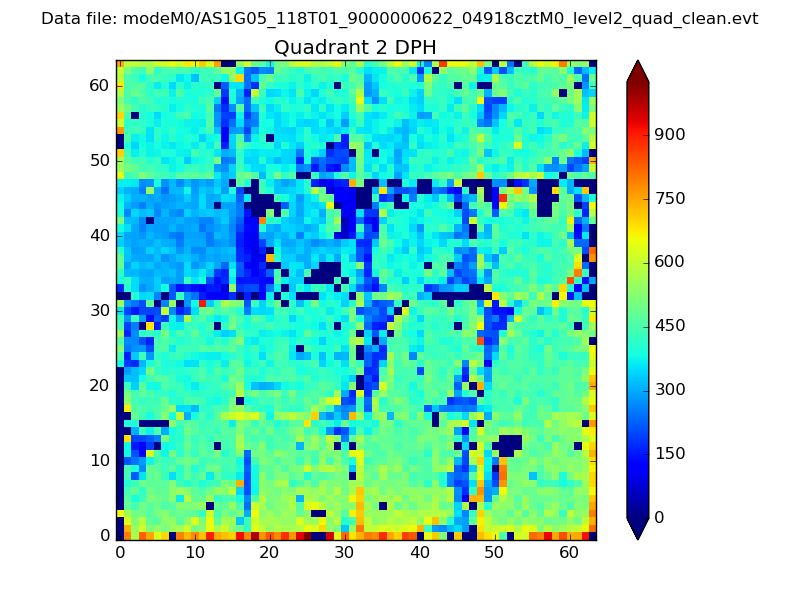 |
Quadrant C |
| Plot type | Count rate plots | Images |
|---|---|---|
| Comparison with Poisson distribution Blue bars denote a histogram of data divided into 1 sec bins. Red curve is a Poisson curve with rate = median count rate of data. |
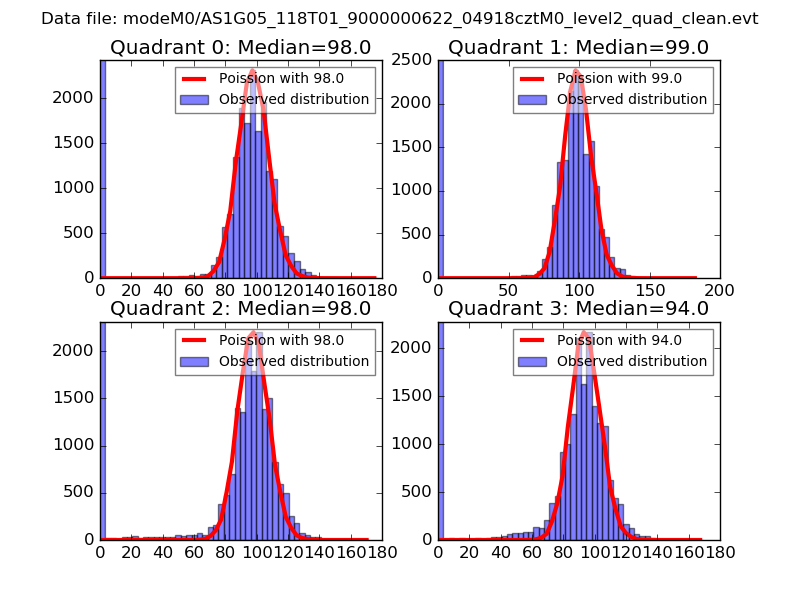 |
 |
| Quadrant-wise count rates Data is divided into 100 sec bins |
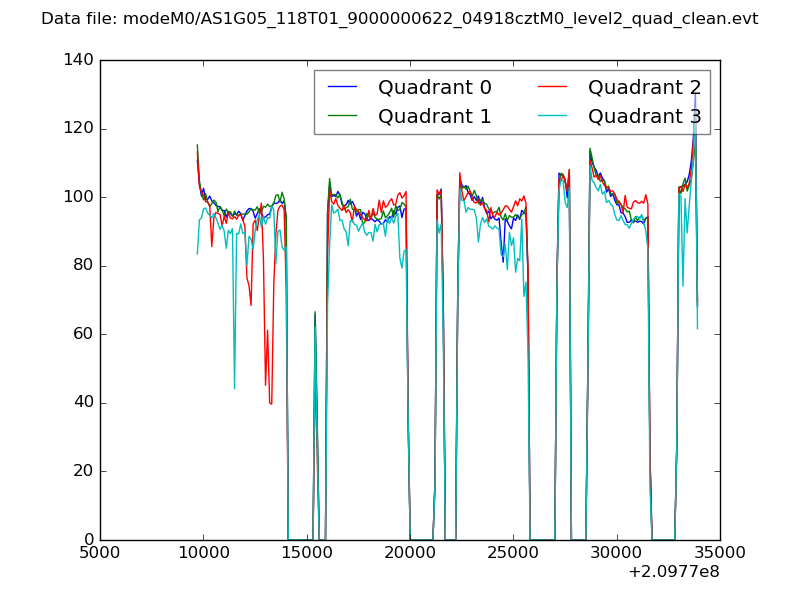 |
|
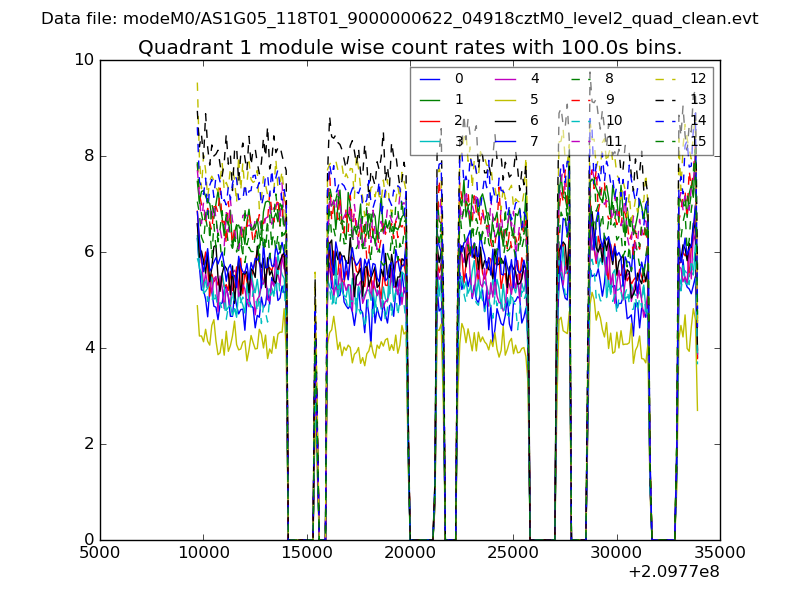
| Module-wise count rates for Quadrant A Data is divided into 100 sec bins |
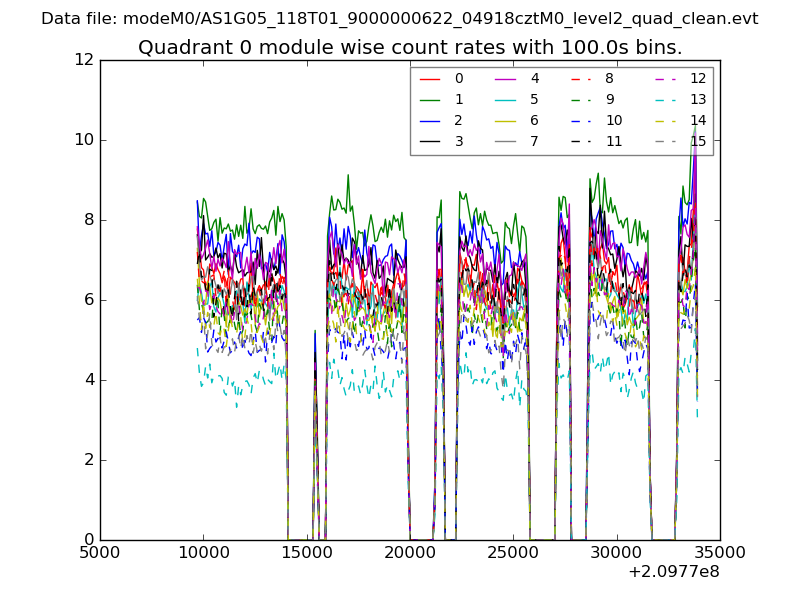 |
 |
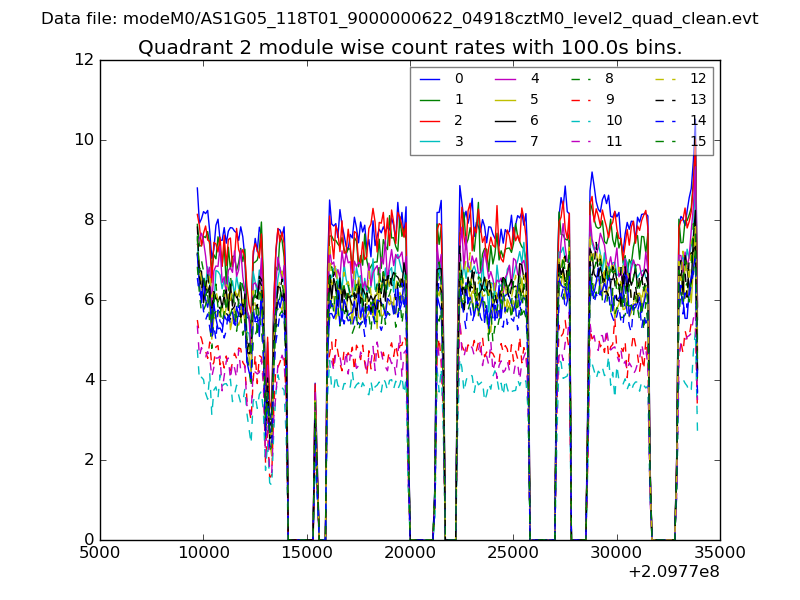
| Module-wise count rates for Quadrant B Data is divided into 100 sec bins |
 |
 |
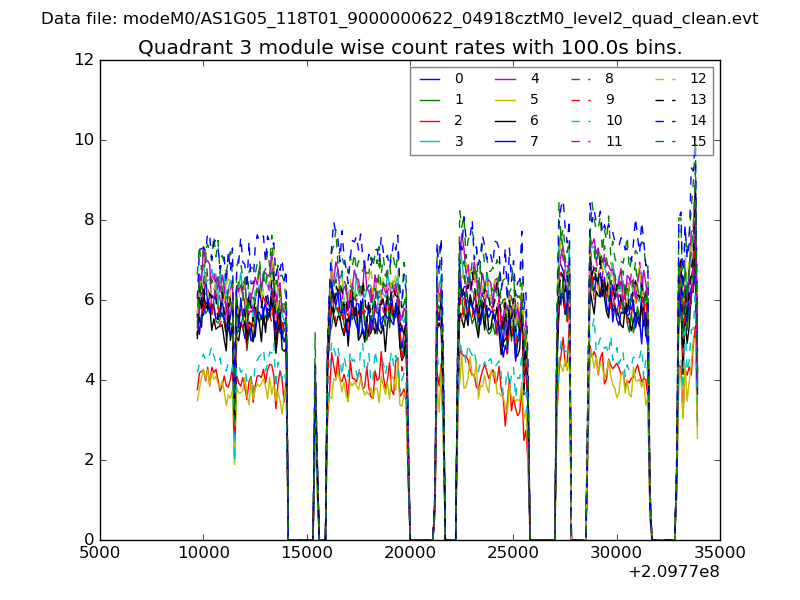
| Module-wise count rates for Quadrant C Data is divided into 100 sec bins |
 |
 |
| Module-wise count rates for Quadrant D Data is divided into 100 sec bins |
 |
 |
| Parameter | Plot |
|---|---|
| CZT HV Monitor | 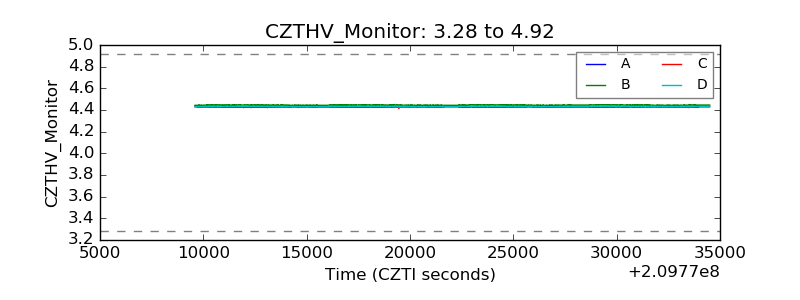 |
| D_VDD | 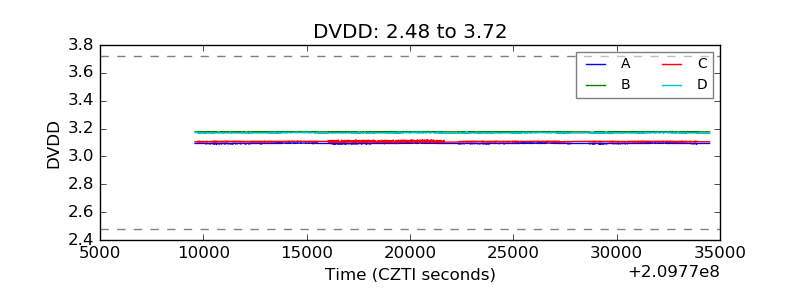 |
| Temperature 1 | 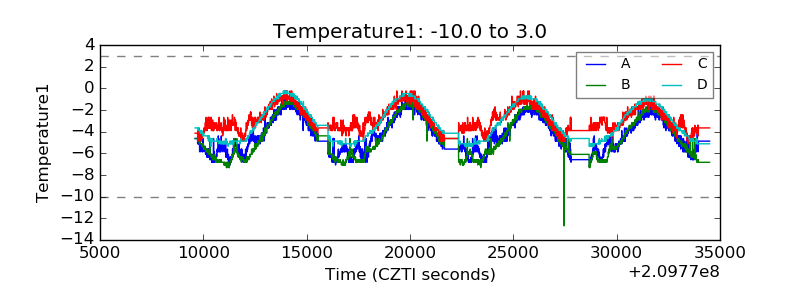 |
| Veto HV Monitor | 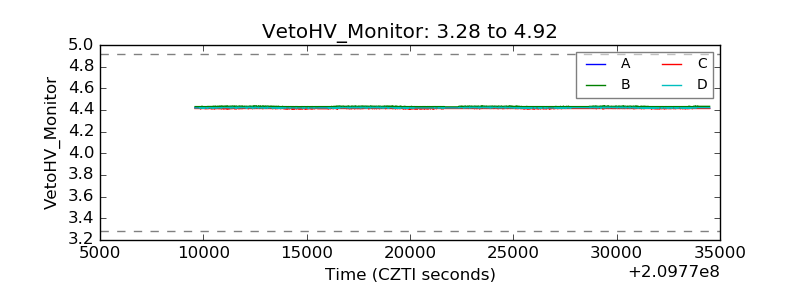 |
| Veto LLD | 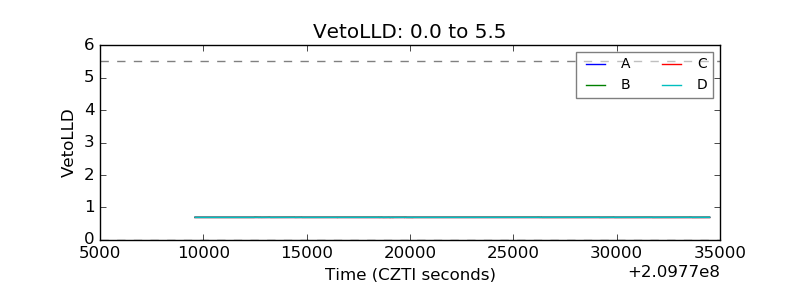 |
| Alpha Counter |  |
| _CPM_Rate | 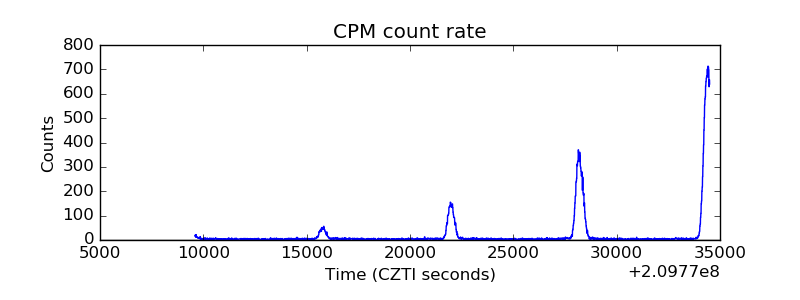 |
| CZT Counter |  |
| +2.5 Volts monitor |  |
| +5 Volts monitor |  |
| _ROLL_ROT | 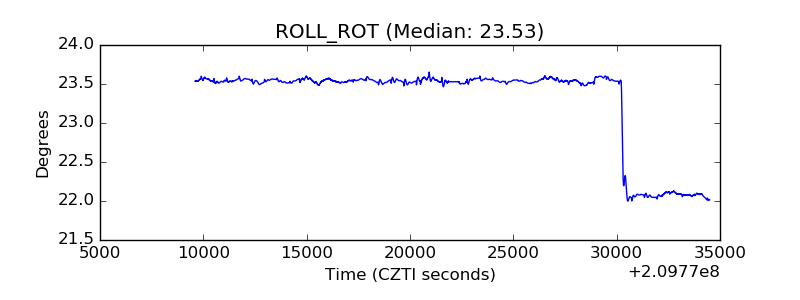 |
| _Roll_DEC | 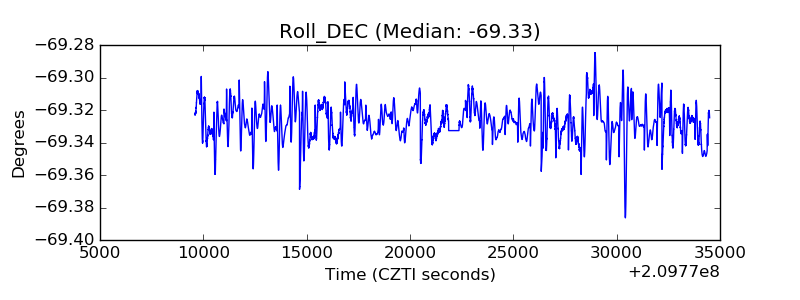 |
| _Roll_RA | 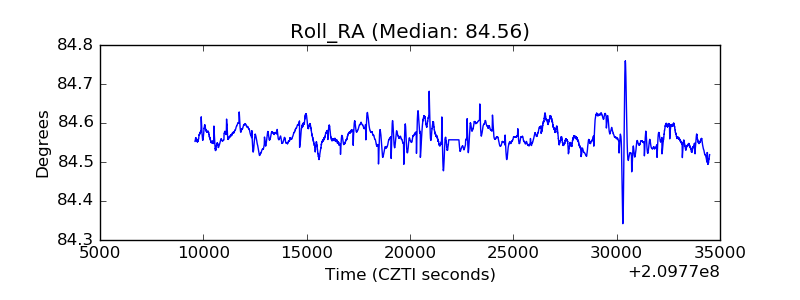 |
| Veto Counter | 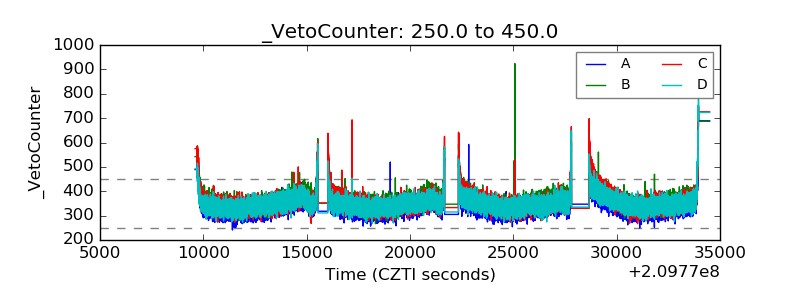 |