| Param | Original file | Final file |
|---|---|---|
| Filename | modeM0/AS1G05_118T01_9000000622_04919cztM0_level2.evt | modeM0/AS1G05_118T01_9000000622_04919cztM0_level2_quad_clean.evt |
| Size (bytes) | 931,296,960 | 171,774,720 |
| Size | 888.2 MB | 163.8 MB |
| Events in quadrant A | 5,857,834 | 1,099,995 |
| Events in quadrant B | 6,660,537 | 1,100,813 |
| Events in quadrant C | 5,840,374 | 1,103,673 |
| Events in quadrant D | 9,004,206 | 1,037,932 |
| Mode M0 | |||
|---|---|---|---|
| Quadrant | BADHDUFLAG | Total packets | Discarded packets |
| A | 0 | 25738 | 4 |
| B | 0 | 27997 | 3 |
| C | 0 | 26023 | 3 |
| D | 0 | 35158 | 3 |
| Mode M9 | |||
|---|---|---|---|
| Quadrant | BADHDUFLAG | Total packets | Discarded packets |
| A | 0 | 34 | 0 |
| B | 0 | 34 | 0 |
| C | 0 | 34 | 0 |
| D | 0 | 34 | 0 |
| Mode SS | |||
|---|---|---|---|
| Quadrant | BADHDUFLAG | Total packets | Discarded packets |
| A | 0 | 252 | 0 |
| B | 0 | 252 | 0 |
| C | 0 | 252 | 0 |
| D | 0 | 252 | 0 |
| Quadrant | Total seconds | Saturated seconds | Saturation percentage |
|---|---|---|---|
| A | 12447 | 123 | 0.988190% |
| B | 12447 | 189 | 1.518438% |
| C | 12447 | 84 | 0.674861% |
| D | 12447 | 792 | 6.362979% |
Noise dominated data is calculated using 1-second bins in cleaned event files. If a bin has >2000 counts, and if more than 50% of those come from <1% of pixels, then it is considered to be noise-dominated and hence unusable.
| Quadrant | # 1 sec bins | Bins with >0 counts | Bins with >2000 counts | High rate bins dominated by noise | Noise dominated (total time) | Noise dominated (detector-on time) | Marked lightcurve |
|---|---|---|---|---|---|---|---|
| A | 15737 | 12447 | 1 | 1 | 0.01% | 0.01% | 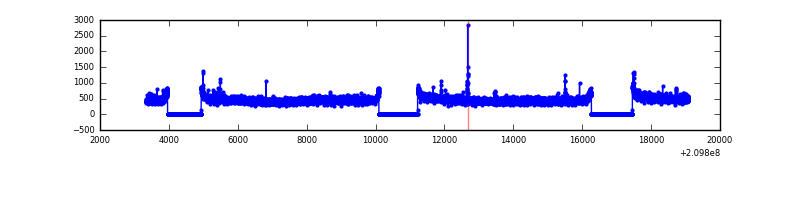 |
| B | 15737 | 12449 | 71 | 71 | 0.45% | 0.57% | 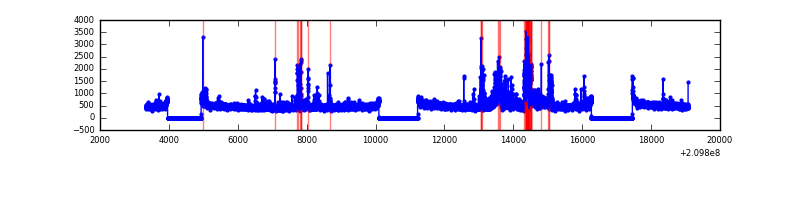 |
| C | 15737 | 12449 | 1 | 1 | 0.01% | 0.01% | 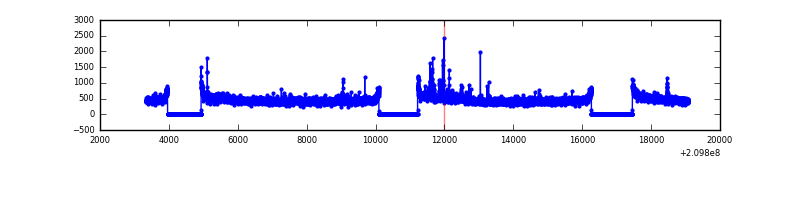 |
| D | 15737 | 12447 | 680 | 680 | 4.32% | 5.46% |  |
Top three noisy pixels from each quadrant. If the there are fewer than three noisy pixels in the level2.evt file, extra rows are filled as -1
| Pixel properties | Quadrant properties | ||||||
|---|---|---|---|---|---|---|---|
| Quadrant | DetID | PixID | Counts | Sigma | Mean | Median | Sigma |
| A | 0 | 31 | 69733 | 228.35 | 1479 | 1445 | 299.0 |
| A | 15 | 174 | 23785 | 74.7 | 1479 | 1445 | 299.0 |
| A | 15 | 31 | 22781 | 71.34 | 1479 | 1445 | 299.0 |
| B | 10 | 16 | 824047 | 2989.36 | 1475 | 1442 | 275.2 |
| B | 15 | 54 | 43641 | 153.35 | 1475 | 1442 | 275.2 |
| B | 0 | 183 | 25365 | 86.93 | 1475 | 1442 | 275.2 |
| C | 9 | 247 | 126597 | 380.75 | 1438 | 1447 | 328.7 |
| C | 1 | 16 | 87066 | 260.48 | 1438 | 1447 | 328.7 |
| C | 13 | 61 | 11639 | 31.01 | 1438 | 1447 | 328.7 |
| D | 2 | 33 | 1894543 | 5497.54 | 1419 | 1374 | 344.4 |
| D | 2 | 136 | 511748 | 1482.07 | 1419 | 1374 | 344.4 |
| D | 1 | 7 | 335223 | 969.46 | 1419 | 1374 | 344.4 |
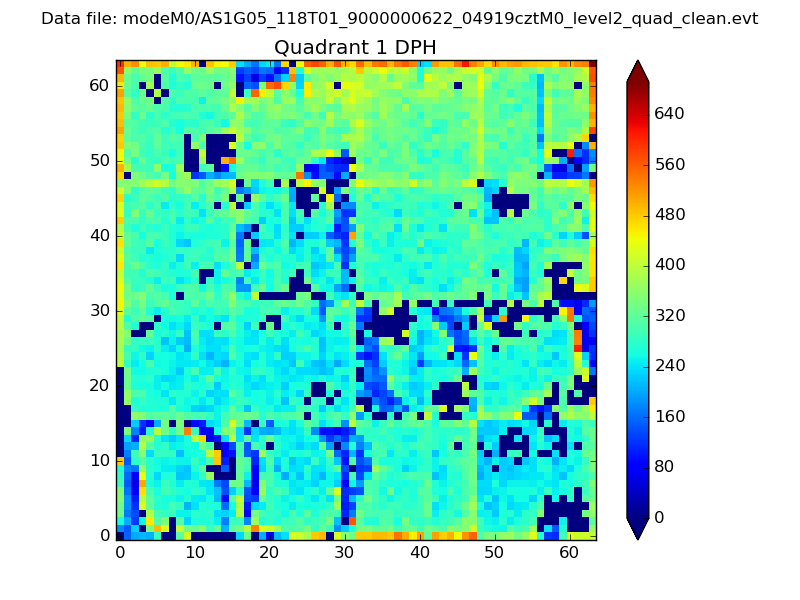
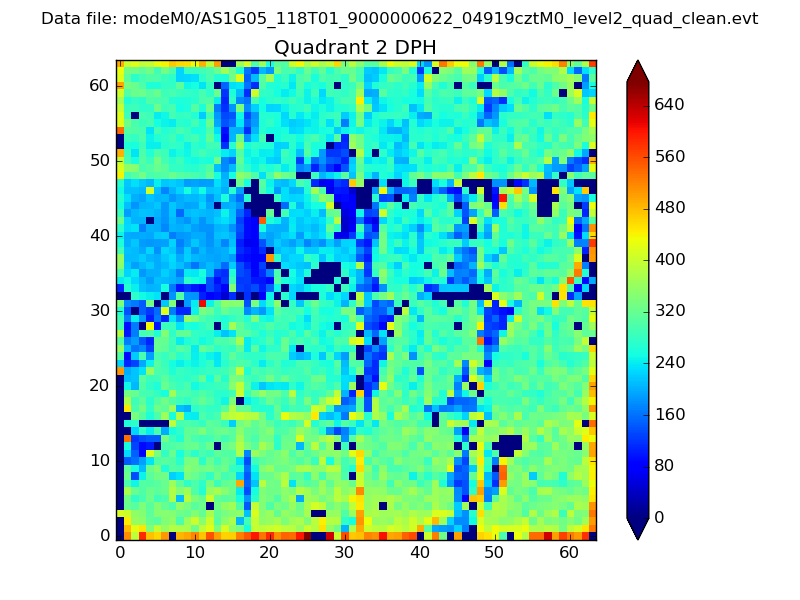
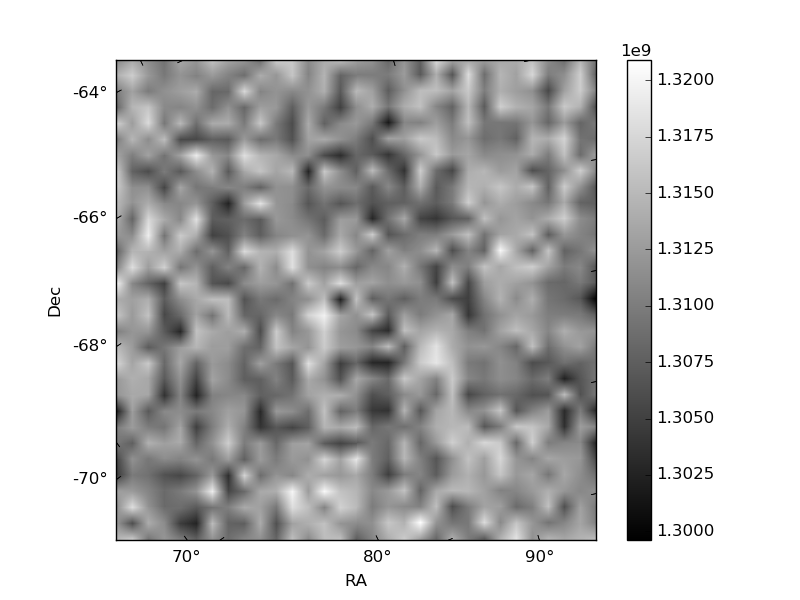
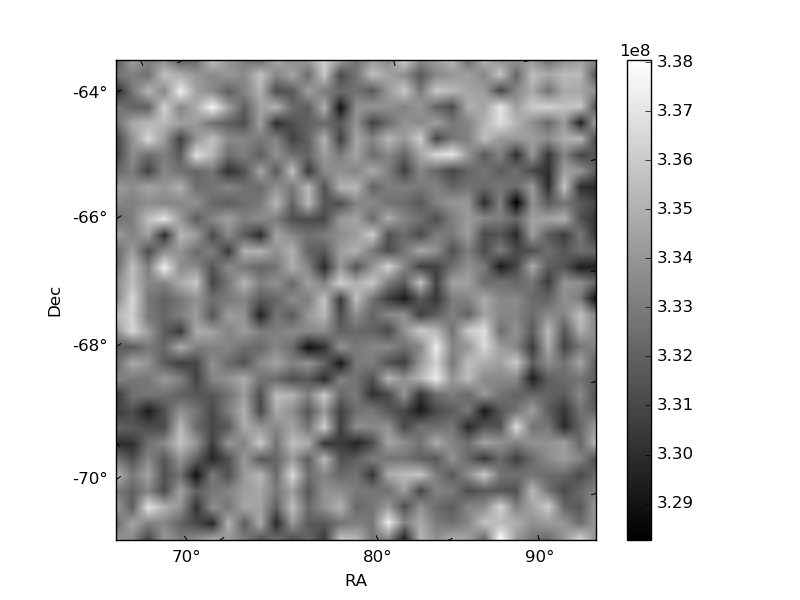
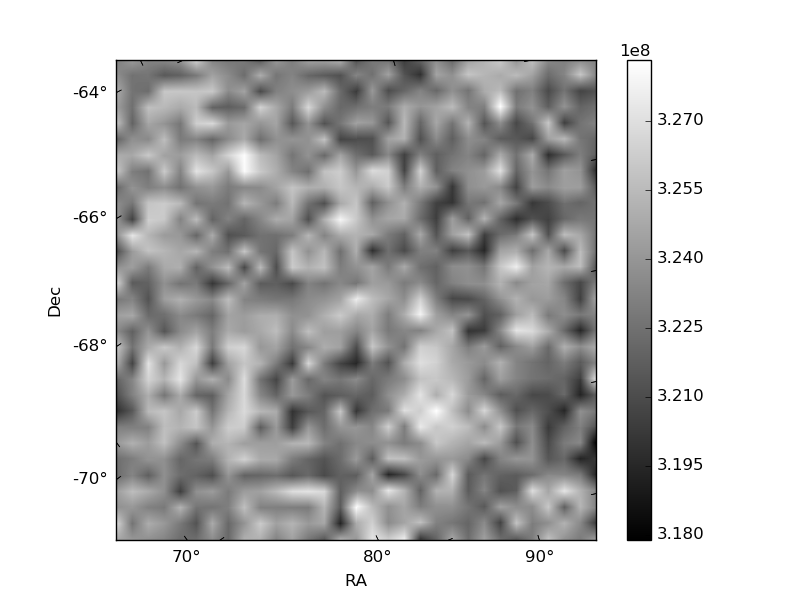
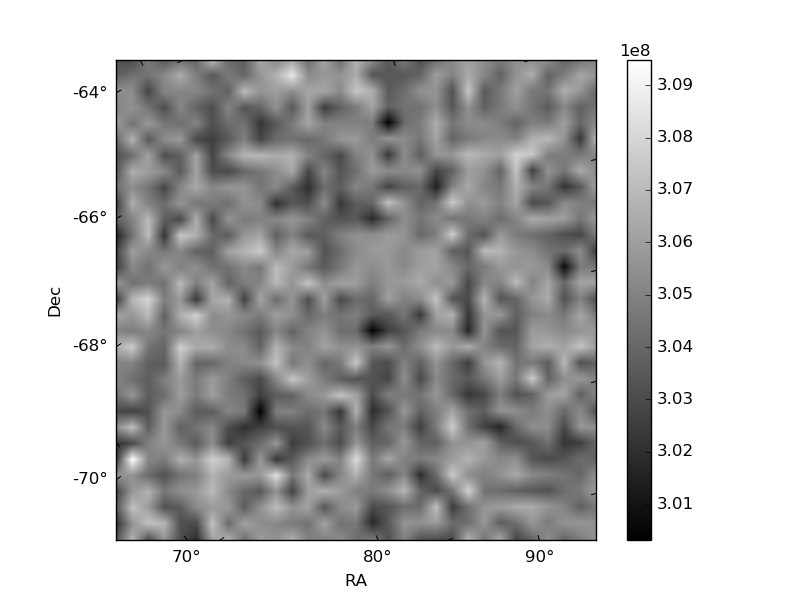
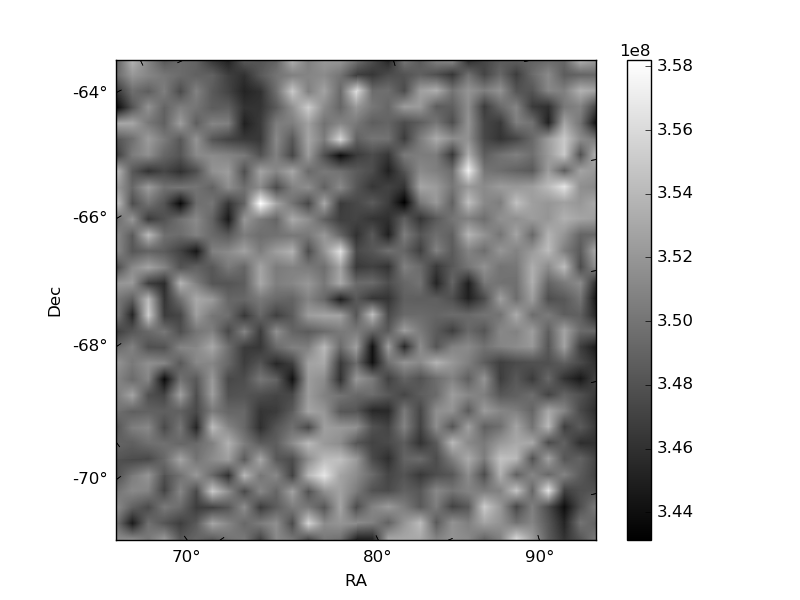
Histogram calculated using DETX and DETY for each event in the final _common_clean file
| Quadrant A | 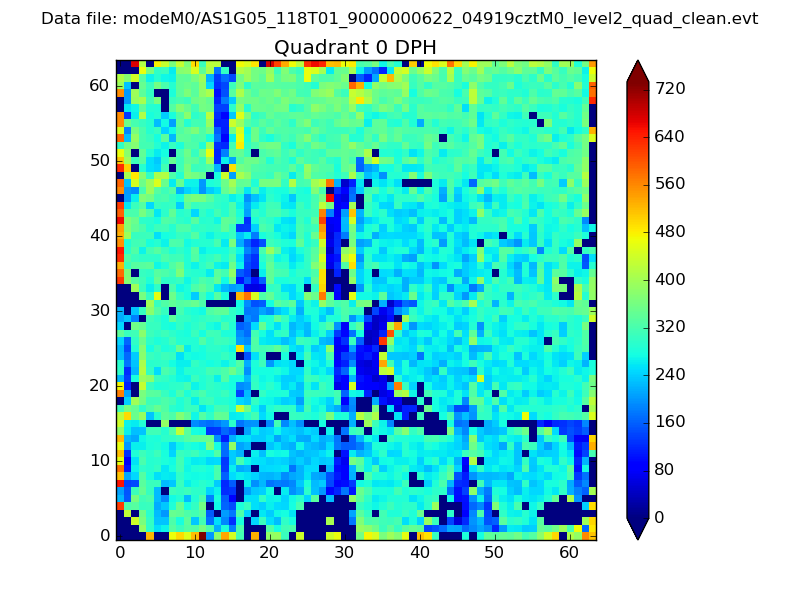 |
 |
Quadrant B |
|---|---|---|---|
| Quadrant D | 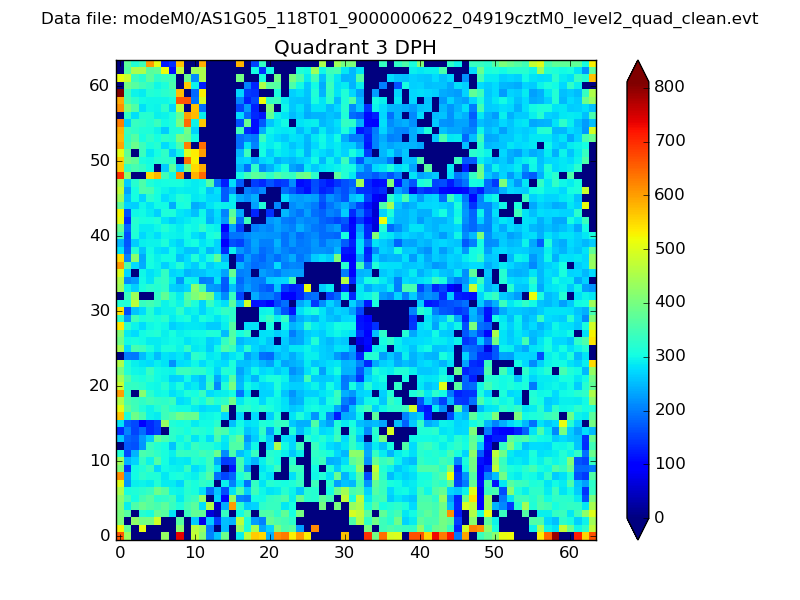 |
 |
Quadrant C |
| Plot type | Count rate plots | Images |
|---|---|---|
| Comparison with Poisson distribution Blue bars denote a histogram of data divided into 1 sec bins. Red curve is a Poisson curve with rate = median count rate of data. |
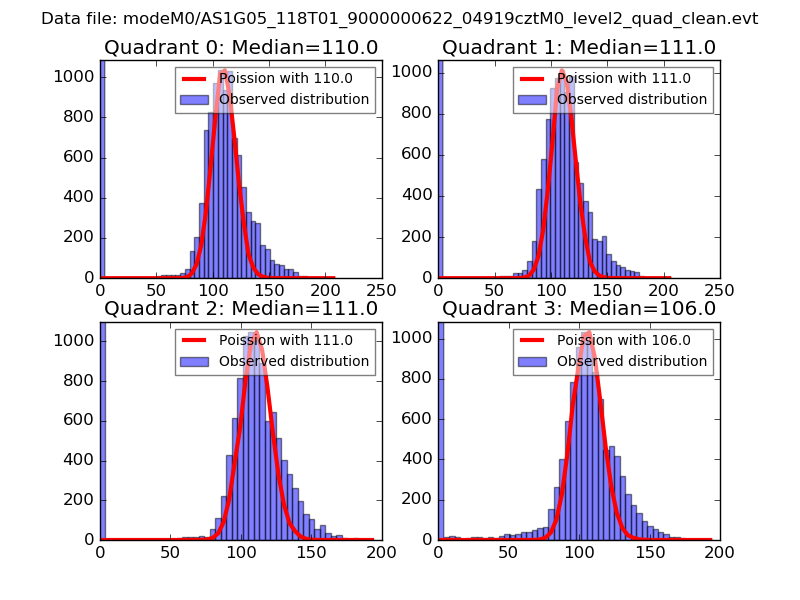 |
 |
| Quadrant-wise count rates Data is divided into 100 sec bins |
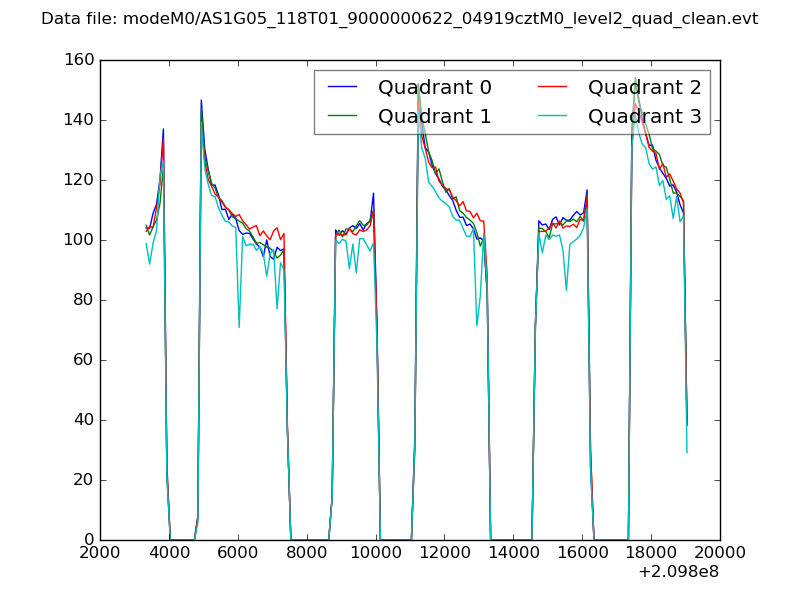 |
|
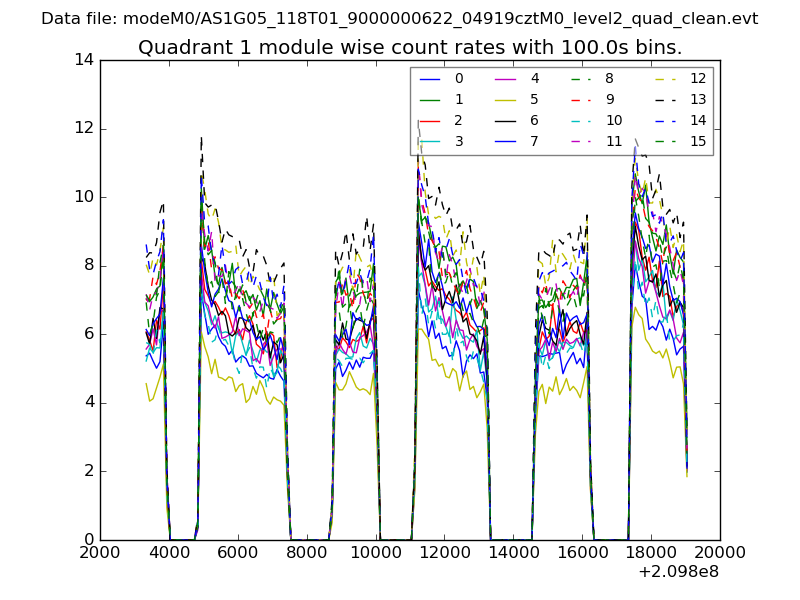
| Module-wise count rates for Quadrant A Data is divided into 100 sec bins |
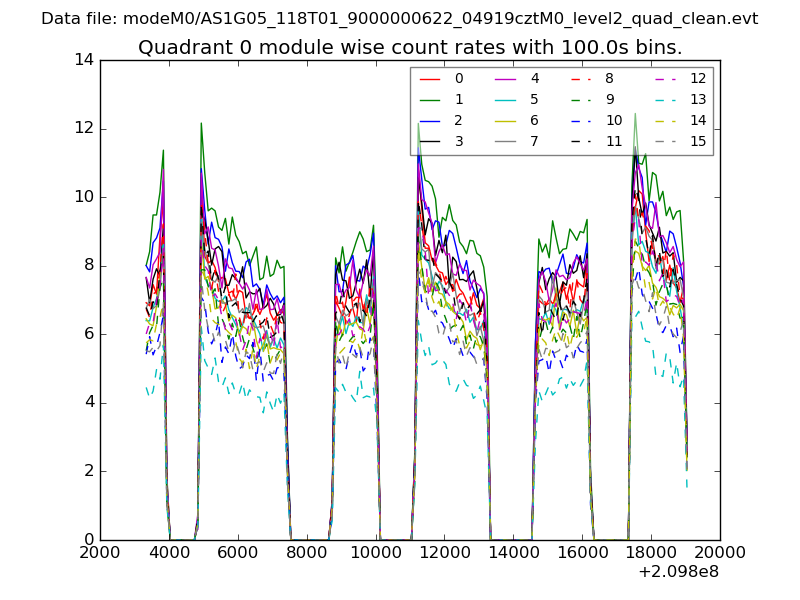 |
 |
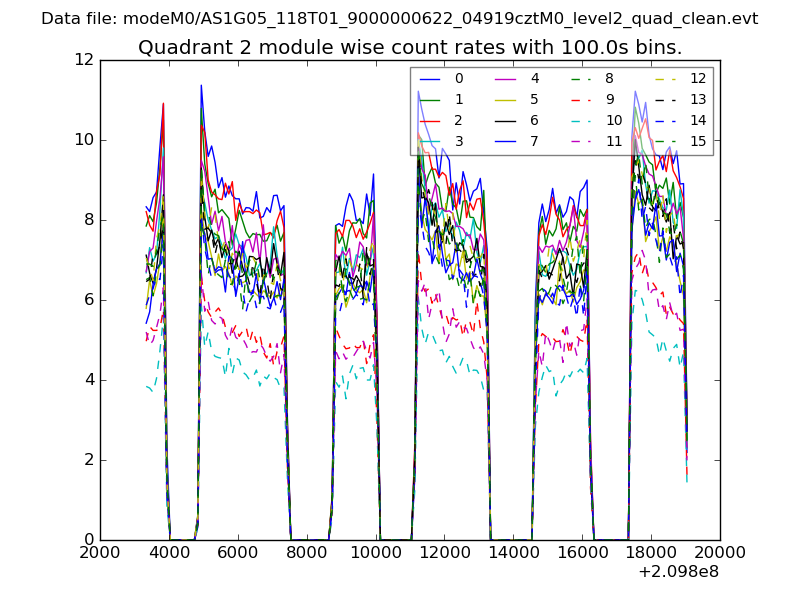
| Module-wise count rates for Quadrant B Data is divided into 100 sec bins |
 |
 |
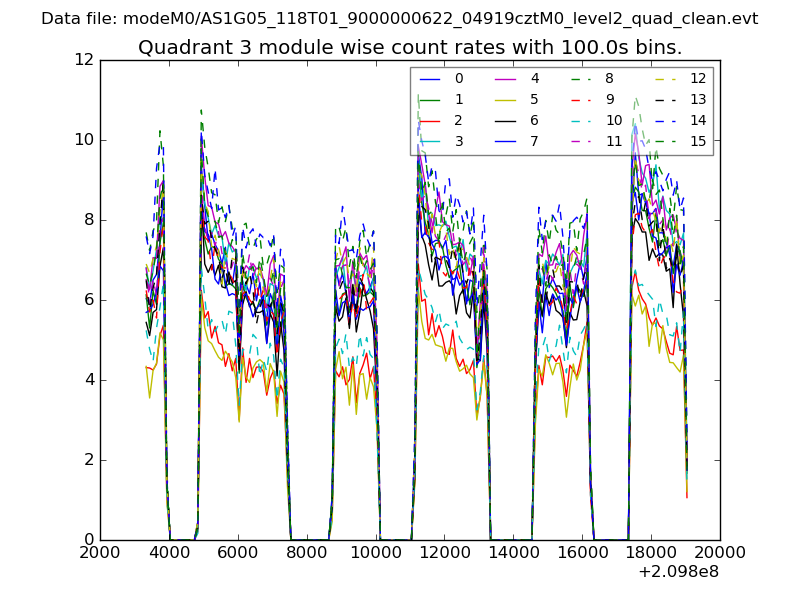
| Module-wise count rates for Quadrant C Data is divided into 100 sec bins |
 |
 |
| Module-wise count rates for Quadrant D Data is divided into 100 sec bins |
 |
 |
| Parameter | Plot |
|---|---|
| CZT HV Monitor | 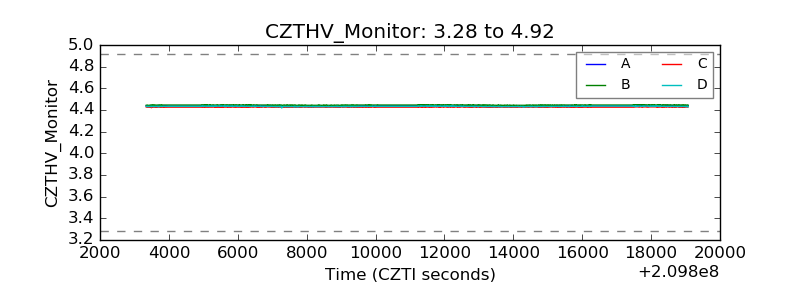 |
| D_VDD | 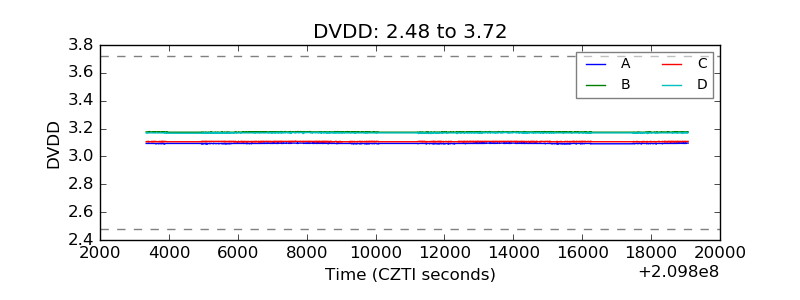 |
| Temperature 1 | 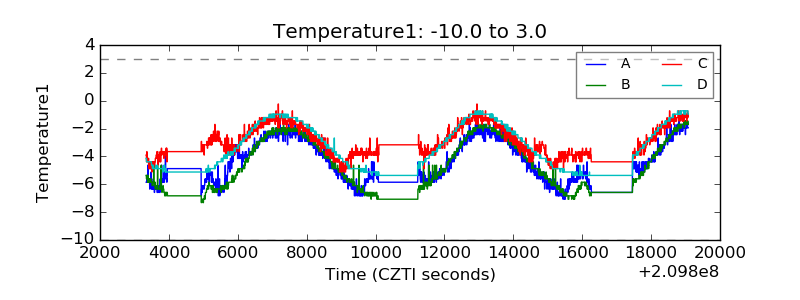 |
| Veto HV Monitor | 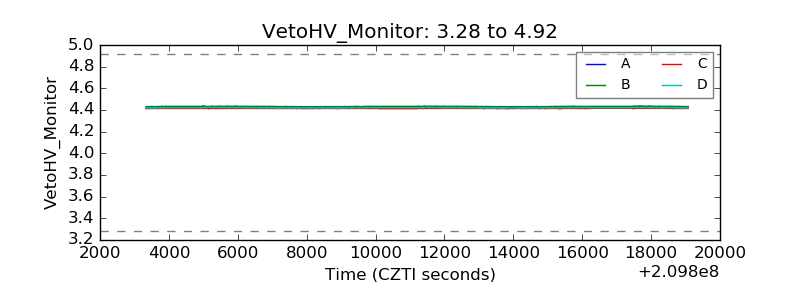 |
| Veto LLD | 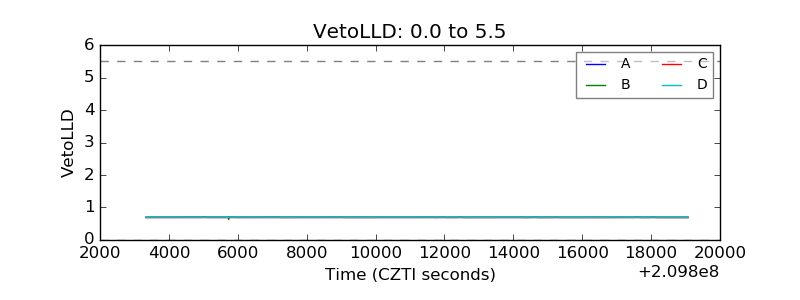 |
| Alpha Counter | 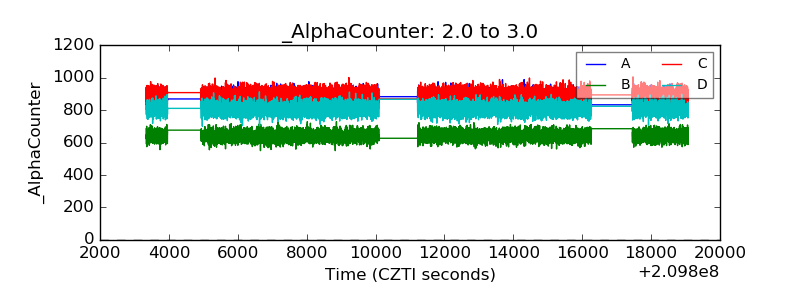 |
| _CPM_Rate | 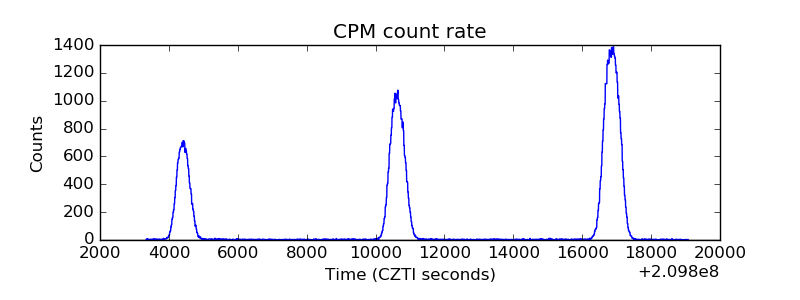 |
| CZT Counter | 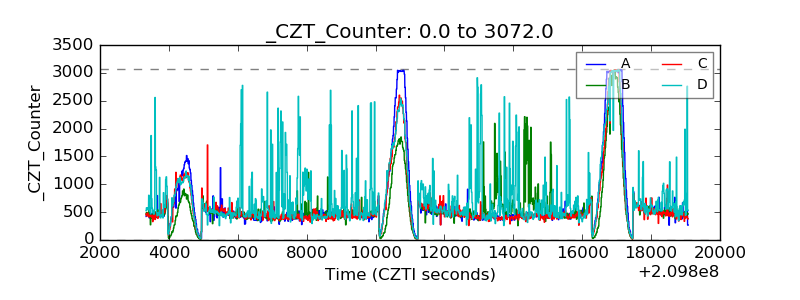 |
| +2.5 Volts monitor |  |
| +5 Volts monitor |  |
| _ROLL_ROT | 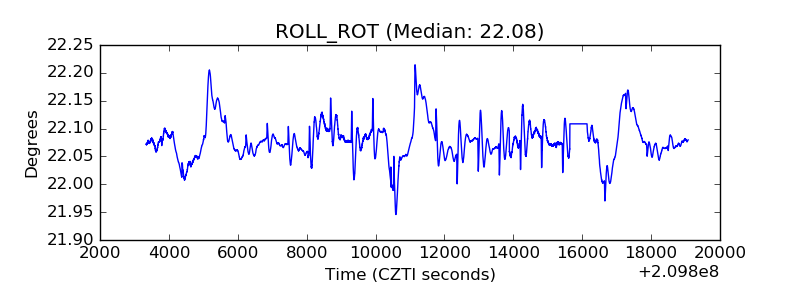 |
| _Roll_DEC | 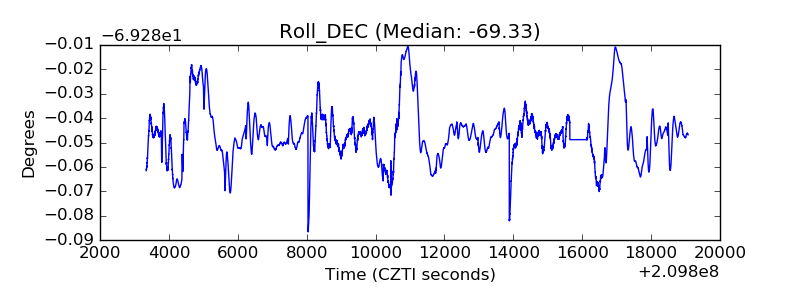 |
| _Roll_RA | 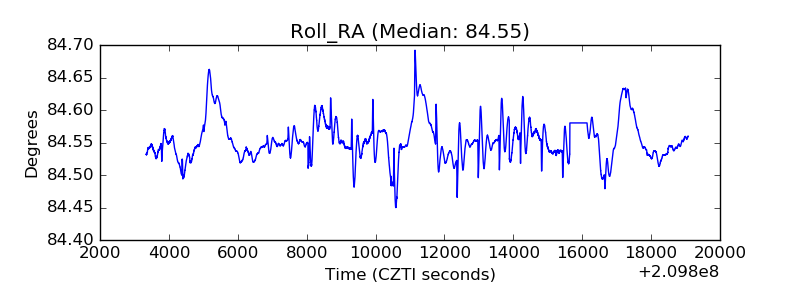 |
| Veto Counter | 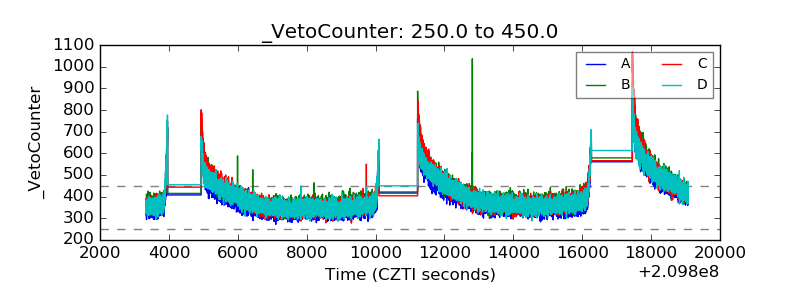 |