| Param | Original file | Final file |
|---|---|---|
| Filename | modeM0/AS1G05_118T01_9000000622_04920cztM0_level2.evt | modeM0/AS1G05_118T01_9000000622_04920cztM0_level2_quad_clean.evt |
| Size (bytes) | 468,950,400 | 82,753,920 |
| Size | 447.2 MB | 78.9 MB |
| Events in quadrant A | 3,008,375 | 526,890 |
| Events in quadrant B | 3,350,588 | 531,198 |
| Events in quadrant C | 2,820,881 | 525,328 |
| Events in quadrant D | 4,607,032 | 495,202 |
| Mode M0 | |||
|---|---|---|---|
| Quadrant | BADHDUFLAG | Total packets | Discarded packets |
| A | 0 | 12707 | 2 |
| B | 0 | 13783 | 1 |
| C | 0 | 12544 | 1 |
| D | 0 | 17802 | 1 |
| Mode M9 | |||
|---|---|---|---|
| Quadrant | BADHDUFLAG | Total packets | Discarded packets |
| A | 0 | 13 | 0 |
| B | 0 | 13 | 0 |
| C | 0 | 13 | 0 |
| D | 0 | 13 | 0 |
| Mode SS | |||
|---|---|---|---|
| Quadrant | BADHDUFLAG | Total packets | Discarded packets |
| A | 0 | 124 | 0 |
| B | 0 | 124 | 0 |
| C | 0 | 124 | 0 |
| D | 0 | 124 | 0 |
| Quadrant | Total seconds | Saturated seconds | Saturation percentage |
|---|---|---|---|
| A | 6120 | 51 | 0.833333% |
| B | 6120 | 118 | 1.928105% |
| C | 6120 | 23 | 0.375817% |
| D | 6120 | 267 | 4.362745% |
Noise dominated data is calculated using 1-second bins in cleaned event files. If a bin has >2000 counts, and if more than 50% of those come from <1% of pixels, then it is considered to be noise-dominated and hence unusable.
| Quadrant | # 1 sec bins | Bins with >0 counts | Bins with >2000 counts | High rate bins dominated by noise | Noise dominated (total time) | Noise dominated (detector-on time) | Marked lightcurve |
|---|---|---|---|---|---|---|---|
| A | 7410 | 6121 | 4 | 4 | 0.05% | 0.07% | 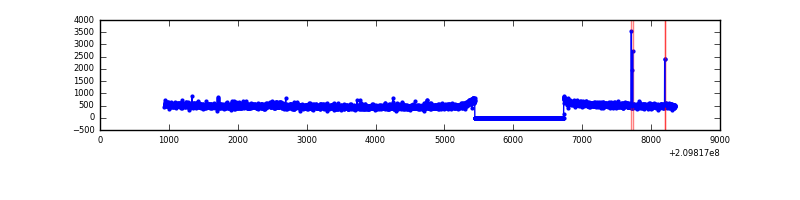 |
| B | 7410 | 6120 | 66 | 66 | 0.89% | 1.08% | 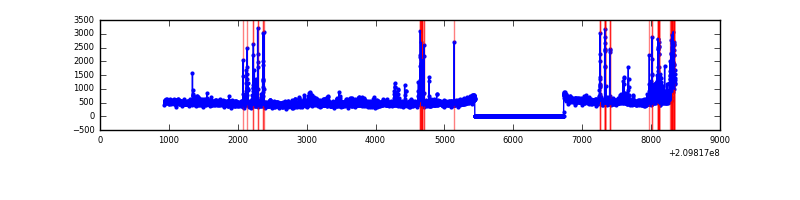 |
| C | 7410 | 6121 | 4 | 4 | 0.05% | 0.07% | 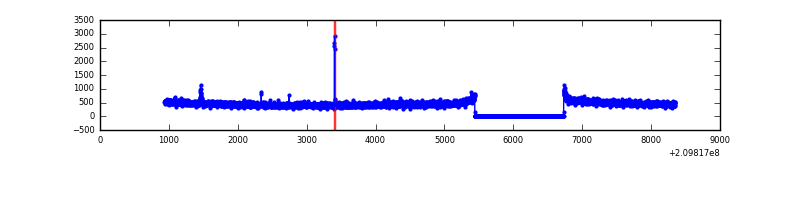 |
| D | 7410 | 6120 | 248 | 248 | 3.35% | 4.05% | 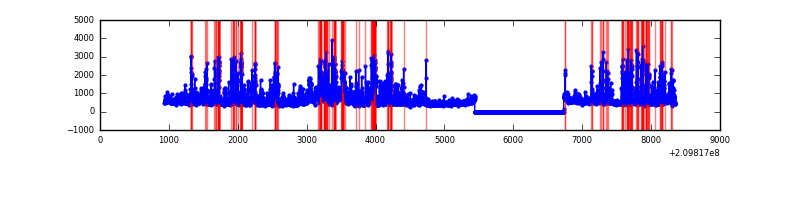 |
Top three noisy pixels from each quadrant. If the there are fewer than three noisy pixels in the level2.evt file, extra rows are filled as -1
| Pixel properties | Quadrant properties | ||||||
|---|---|---|---|---|---|---|---|
| Quadrant | DetID | PixID | Counts | Sigma | Mean | Median | Sigma |
| A | 0 | 31 | 92748 | 609.3 | 746 | 731 | 151.0 |
| A | 13 | 14 | 13991 | 87.8 | 746 | 731 | 151.0 |
| A | 15 | 222 | 10735 | 66.24 | 746 | 731 | 151.0 |
| B | 10 | 16 | 207018 | 1504.77 | 737 | 721 | 137.1 |
| B | 4 | 48 | 141186 | 1024.58 | 737 | 721 | 137.1 |
| B | 15 | 204 | 96321 | 697.32 | 737 | 721 | 137.1 |
| C | 1 | 16 | 14305 | 83.53 | 714 | 717 | 162.7 |
| C | 9 | 247 | 9411 | 53.45 | 714 | 717 | 162.7 |
| C | 12 | 4 | 7745 | 43.2 | 714 | 717 | 162.7 |
| D | 2 | 33 | 563771 | 3284.17 | 713 | 692 | 171.5 |
| D | 1 | 7 | 497667 | 2898.62 | 713 | 692 | 171.5 |
| D | 2 | 136 | 247907 | 1441.89 | 713 | 692 | 171.5 |
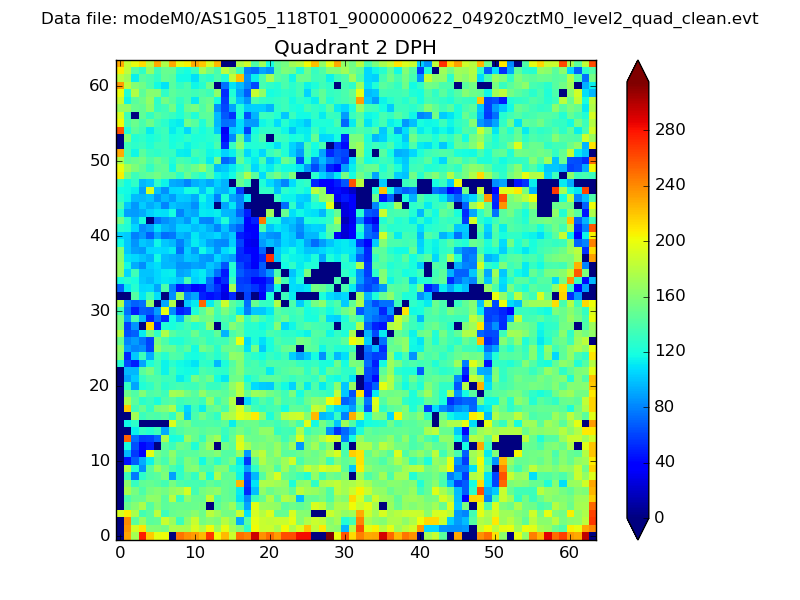
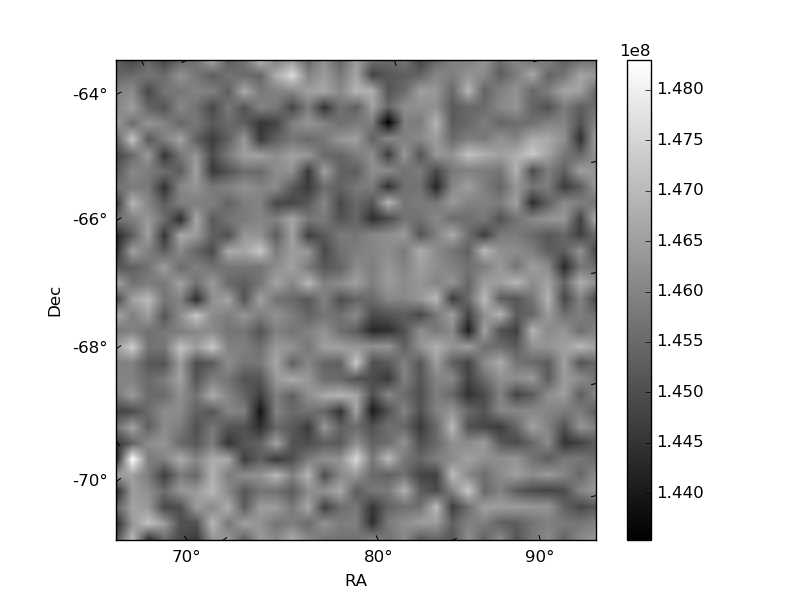
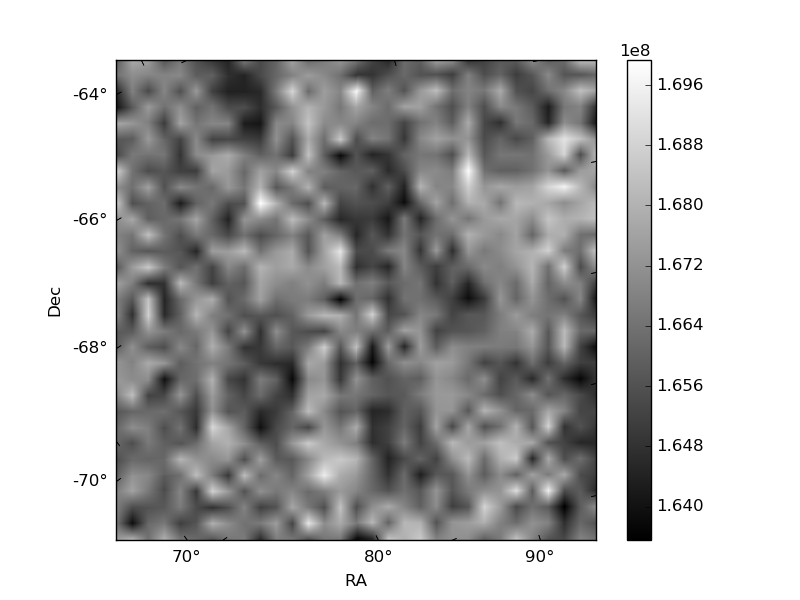
Histogram calculated using DETX and DETY for each event in the final _common_clean file
| Quadrant A | 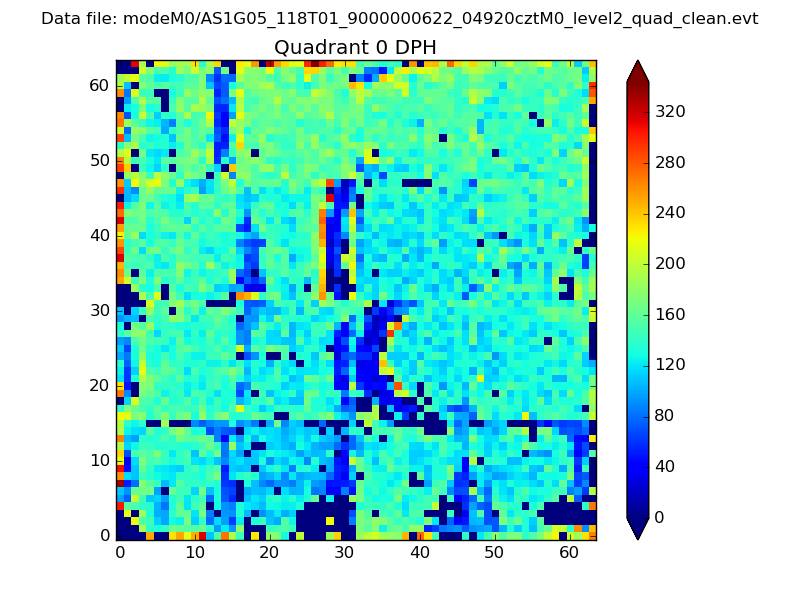 |
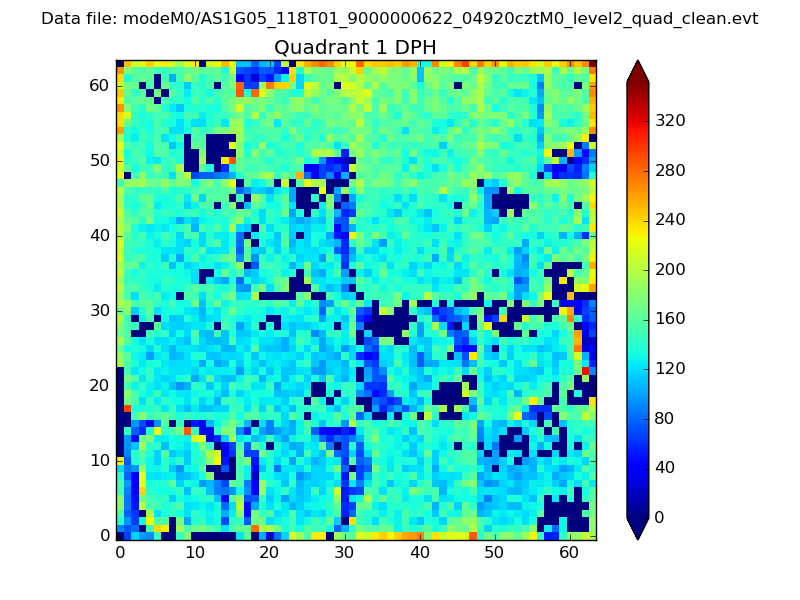 |
Quadrant B |
|---|---|---|---|
| Quadrant D | 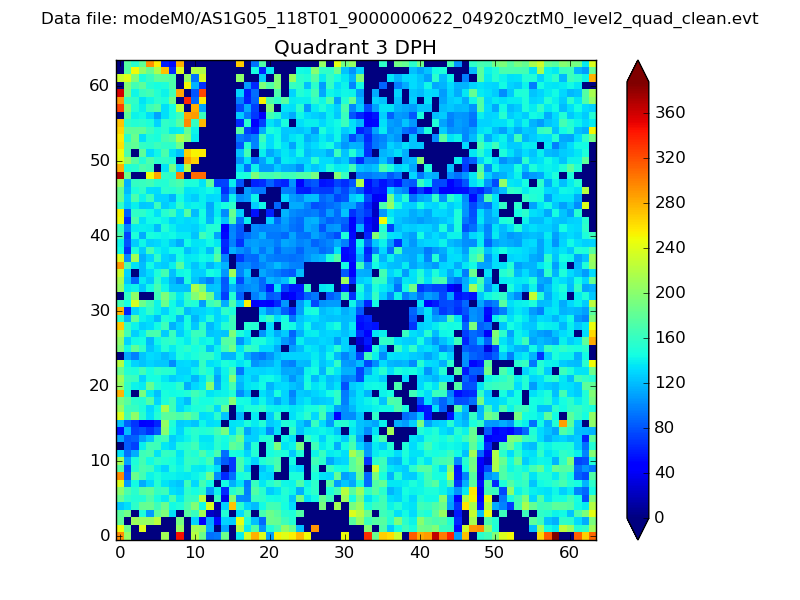 |
 |
Quadrant C |
| Plot type | Count rate plots | Images |
|---|---|---|
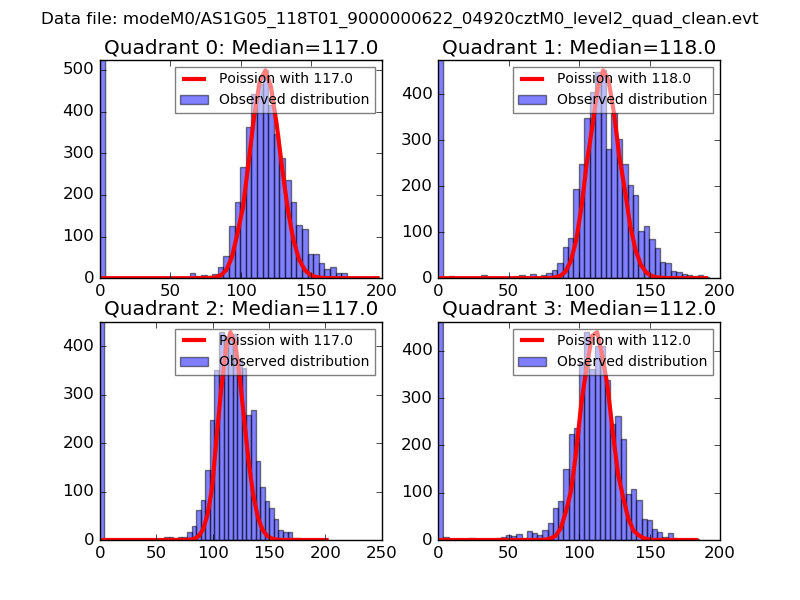
| Comparison with Poisson distribution Blue bars denote a histogram of data divided into 1 sec bins. Red curve is a Poisson curve with rate = median count rate of data. |
 |
 |
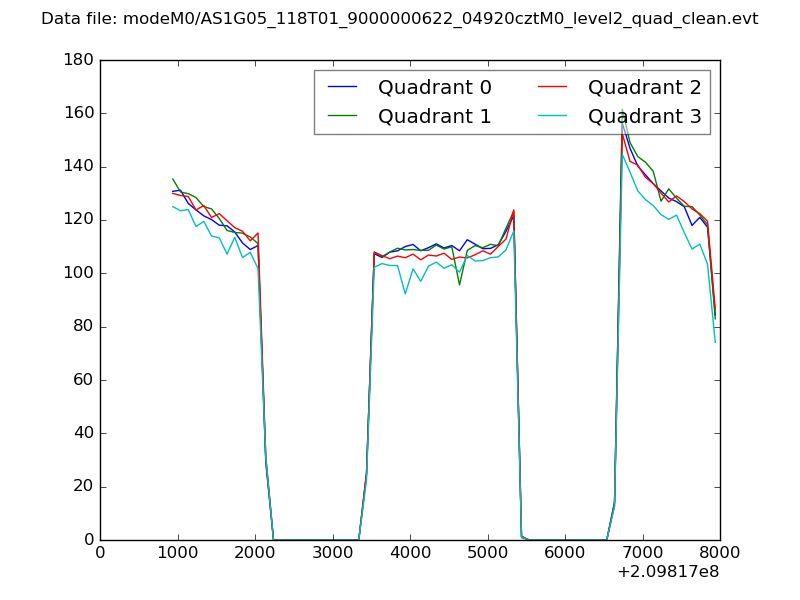
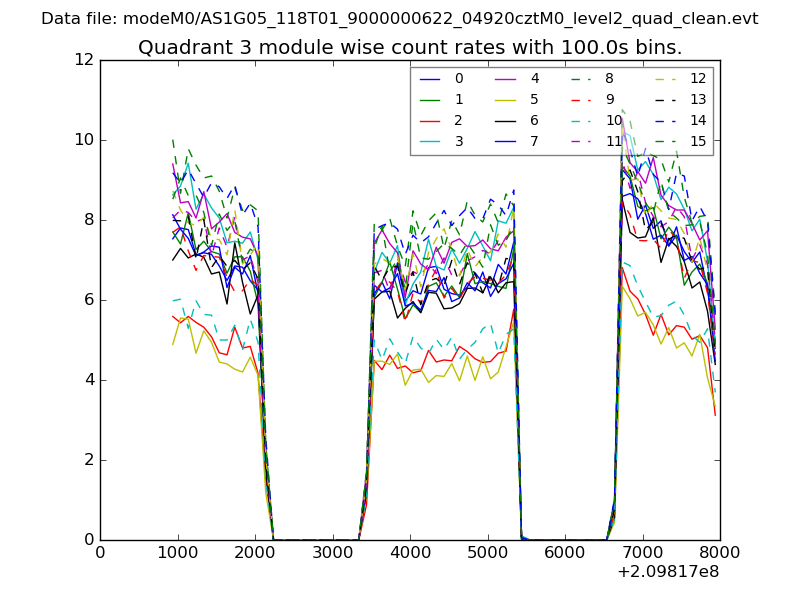
| Quadrant-wise count rates Data is divided into 100 sec bins |
 |
|
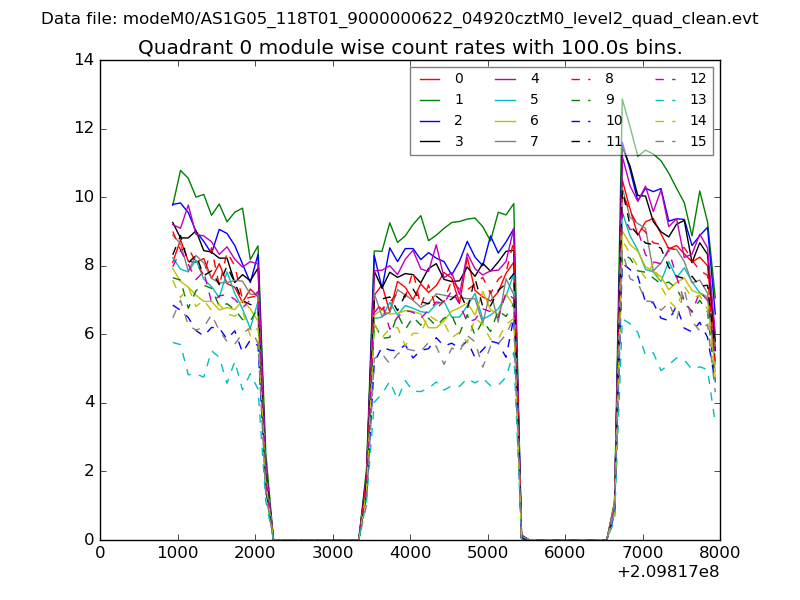
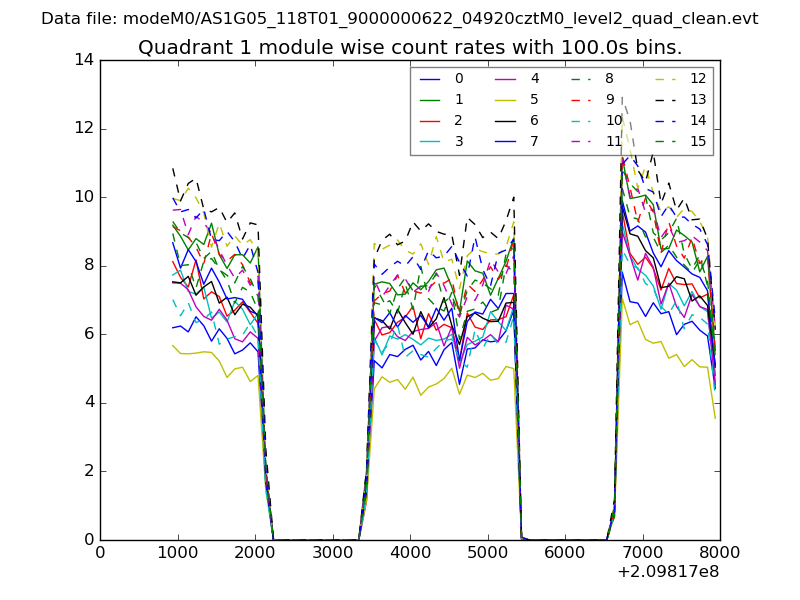
| Module-wise count rates for Quadrant A Data is divided into 100 sec bins |
 |
 |
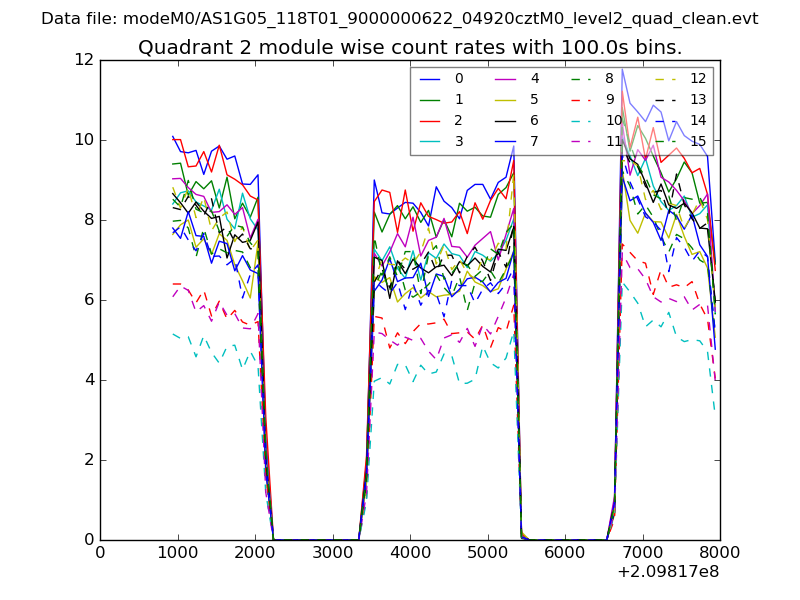
| Module-wise count rates for Quadrant B Data is divided into 100 sec bins |
 |
 |
| Module-wise count rates for Quadrant C Data is divided into 100 sec bins |
 |
 |
| Module-wise count rates for Quadrant D Data is divided into 100 sec bins |
 |
 |
| Parameter | Plot |
|---|---|
| CZT HV Monitor | 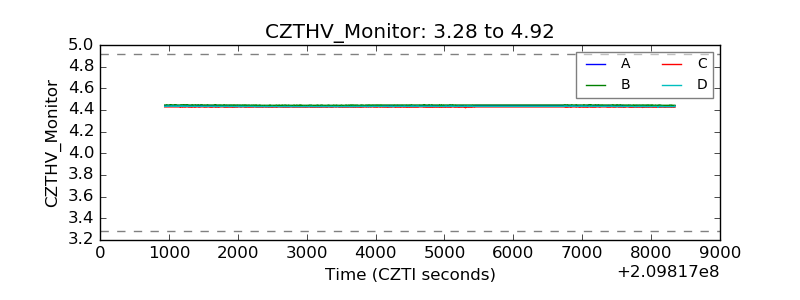 |
| D_VDD | 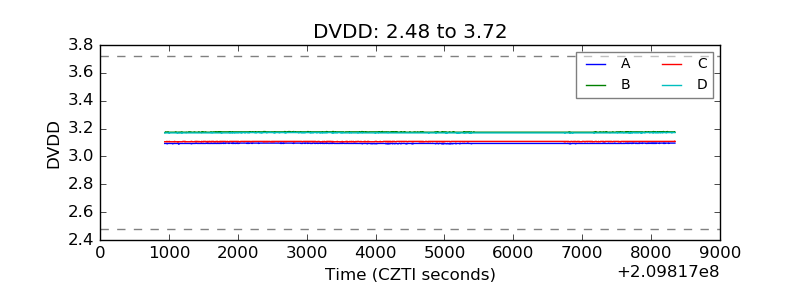 |
| Temperature 1 | 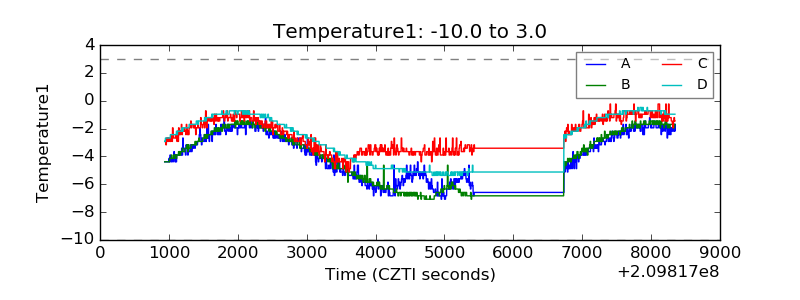 |
| Veto HV Monitor | 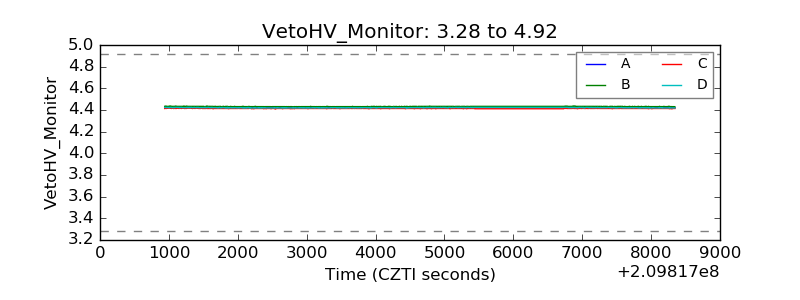 |
| Veto LLD | 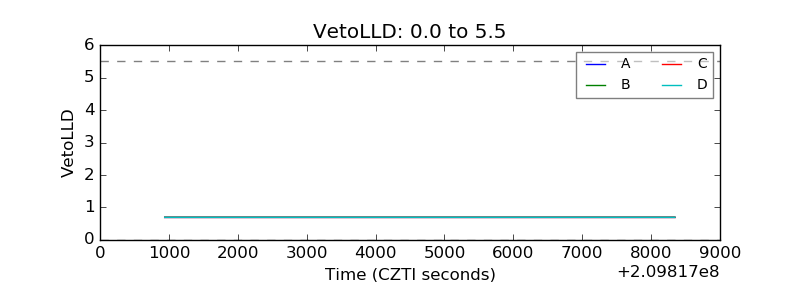 |
| Alpha Counter | 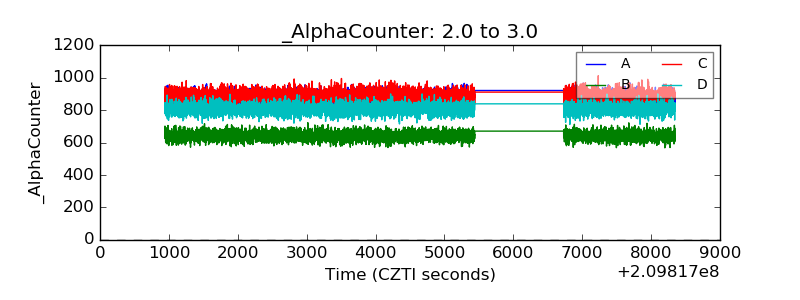 |
| _CPM_Rate | 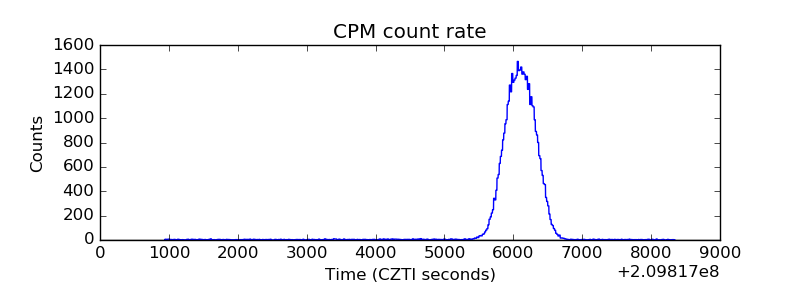 |
| CZT Counter | 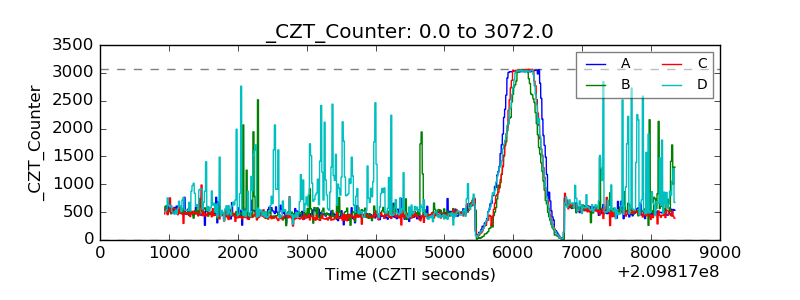 |
| +2.5 Volts monitor |  |
| +5 Volts monitor |  |
| _ROLL_ROT | 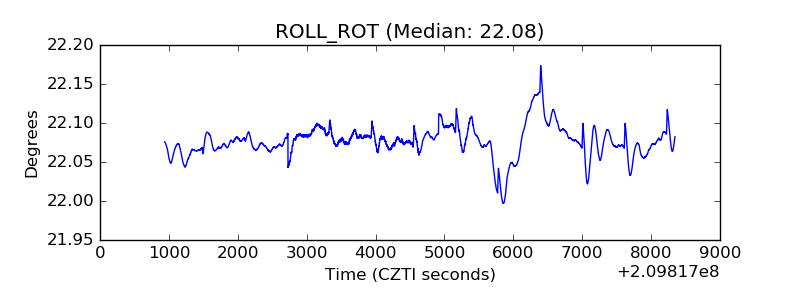 |
| _Roll_DEC | 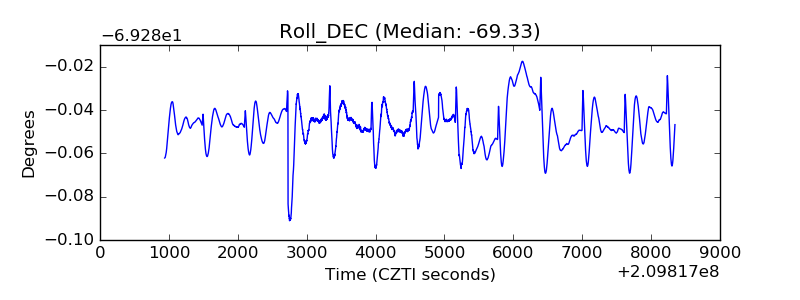 |
| _Roll_RA | 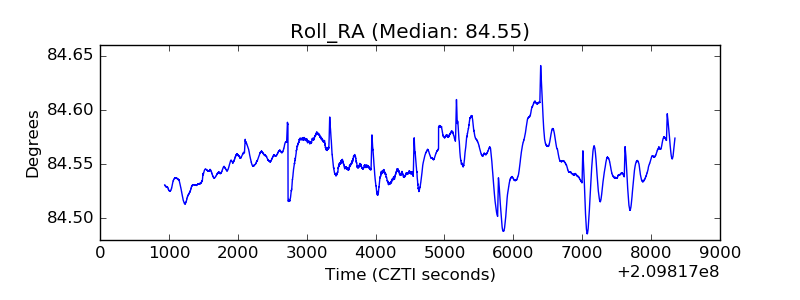 |
| Veto Counter | 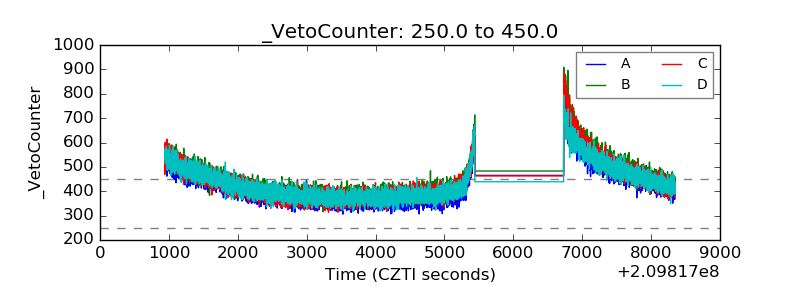 |