| Param | Original file | Final file |
|---|---|---|
| Filename | modeM0/AS1G05_118T01_9000000622_04921cztM0_level2.evt | modeM0/AS1G05_118T01_9000000622_04921cztM0_level2_quad_clean.evt |
| Size (bytes) | 454,245,120 | 75,395,520 |
| Size | 433.2 MB | 71.9 MB |
| Events in quadrant A | 3,000,103 | 472,994 |
| Events in quadrant B | 3,375,156 | 474,929 |
| Events in quadrant C | 2,815,711 | 469,470 |
| Events in quadrant D | 4,151,843 | 440,132 |
| Mode M0 | |||
|---|---|---|---|
| Quadrant | BADHDUFLAG | Total packets | Discarded packets |
| A | 0 | 12687 | 2 |
| B | 0 | 13990 | 1 |
| C | 0 | 12500 | 1 |
| D | 0 | 16450 | 1 |
| Mode M9 | |||
|---|---|---|---|
| Quadrant | BADHDUFLAG | Total packets | Discarded packets |
| A | 0 | 13 | 0 |
| B | 0 | 13 | 0 |
| C | 0 | 13 | 0 |
| D | 0 | 13 | 0 |
| Mode SS | |||
|---|---|---|---|
| Quadrant | BADHDUFLAG | Total packets | Discarded packets |
| A | 0 | 124 | 0 |
| B | 0 | 124 | 0 |
| C | 0 | 124 | 0 |
| D | 0 | 124 | 0 |
| Quadrant | Total seconds | Saturated seconds | Saturation percentage |
|---|---|---|---|
| A | 6091 | 75 | 1.231325% |
| B | 6091 | 162 | 2.659662% |
| C | 6091 | 37 | 0.607454% |
| D | 6091 | 329 | 5.401412% |
Noise dominated data is calculated using 1-second bins in cleaned event files. If a bin has >2000 counts, and if more than 50% of those come from <1% of pixels, then it is considered to be noise-dominated and hence unusable.
| Quadrant | # 1 sec bins | Bins with >0 counts | Bins with >2000 counts | High rate bins dominated by noise | Noise dominated (total time) | Noise dominated (detector-on time) | Marked lightcurve |
|---|---|---|---|---|---|---|---|
| A | 7371 | 6091 | 5 | 5 | 0.07% | 0.08% | 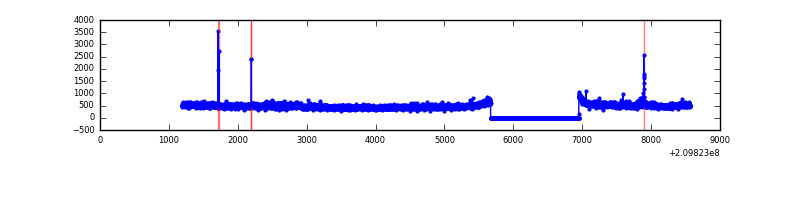 |
| B | 7371 | 6091 | 89 | 89 | 1.21% | 1.46% | 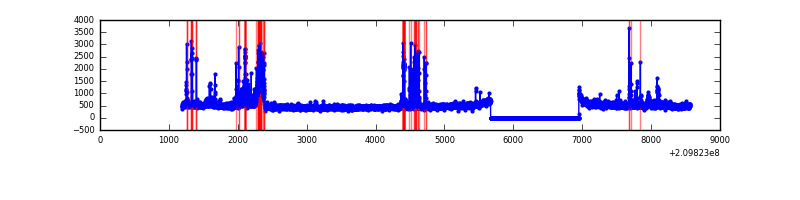 |
| C | 7371 | 6091 | 4 | 4 | 0.05% | 0.07% | 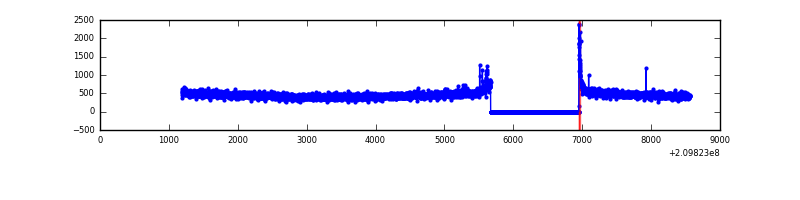 |
| D | 7371 | 6092 | 216 | 216 | 2.93% | 3.55% | 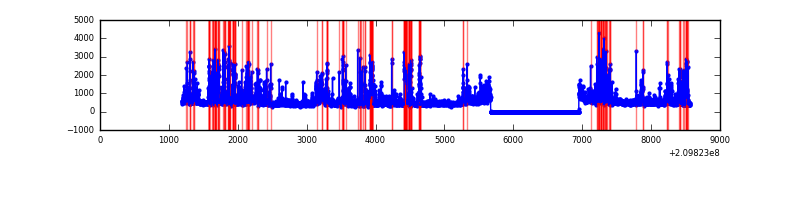 |
Top three noisy pixels from each quadrant. If the there are fewer than three noisy pixels in the level2.evt file, extra rows are filled as -1
| Pixel properties | Quadrant properties | ||||||
|---|---|---|---|---|---|---|---|
| Quadrant | DetID | PixID | Counts | Sigma | Mean | Median | Sigma |
| A | 0 | 31 | 131894 | 879.72 | 738 | 723 | 149.1 |
| A | 15 | 31 | 12157 | 76.68 | 738 | 723 | 149.1 |
| A | 15 | 222 | 9400 | 58.19 | 738 | 723 | 149.1 |
| B | 10 | 16 | 293452 | 2148.69 | 732 | 715 | 136.2 |
| B | 4 | 48 | 95858 | 698.35 | 732 | 715 | 136.2 |
| B | 15 | 54 | 78244 | 569.06 | 732 | 715 | 136.2 |
| C | 1 | 16 | 28934 | 175.4 | 706 | 710 | 160.9 |
| C | 9 | 247 | 27596 | 167.08 | 706 | 710 | 160.9 |
| C | 13 | 61 | 5870 | 32.07 | 706 | 710 | 160.9 |
| D | 2 | 33 | 708819 | 4188.76 | 701 | 680 | 169.1 |
| D | 2 | 136 | 164104 | 966.68 | 701 | 680 | 169.1 |
| D | 13 | 235 | 120659 | 709.69 | 701 | 680 | 169.1 |
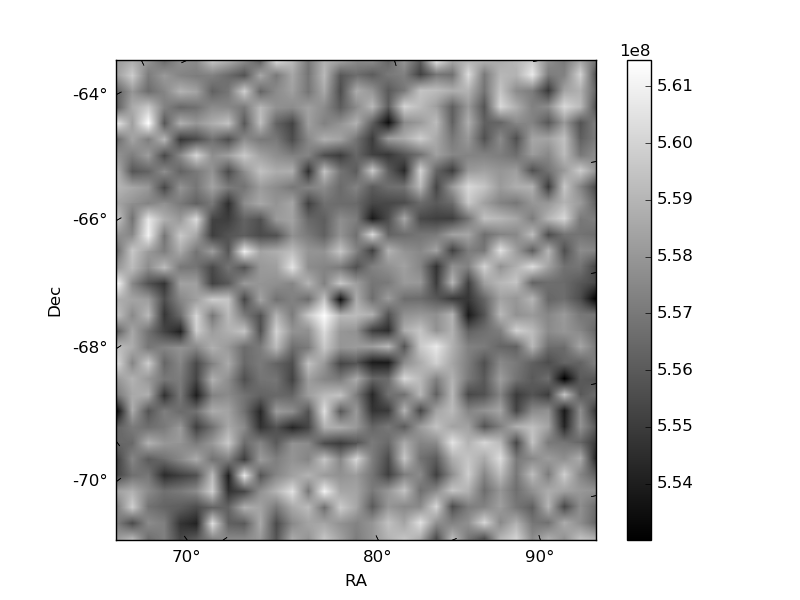
Histogram calculated using DETX and DETY for each event in the final _common_clean file
| Quadrant A | 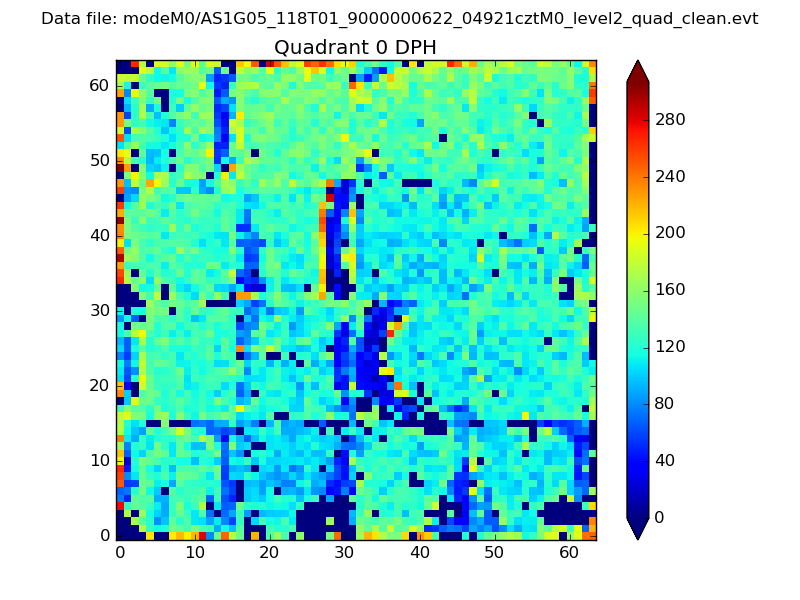 |
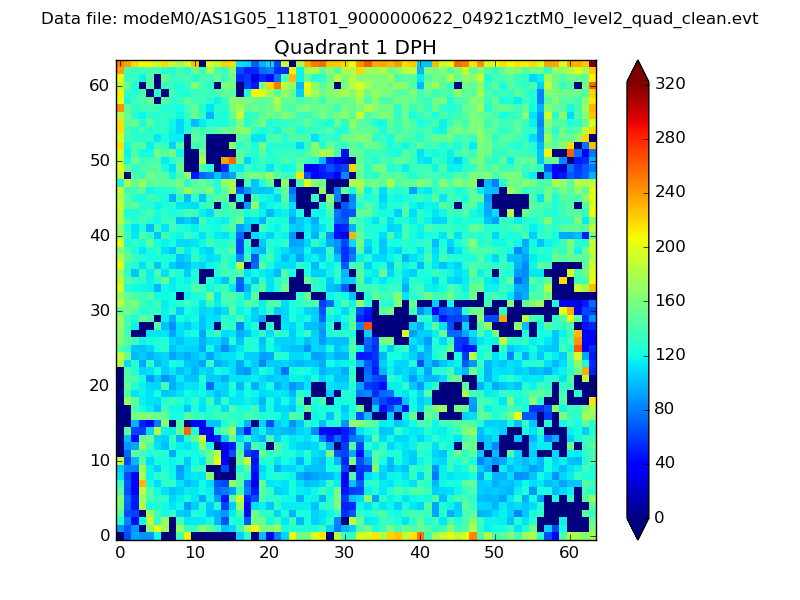 |
Quadrant B |
|---|---|---|---|
| Quadrant D | 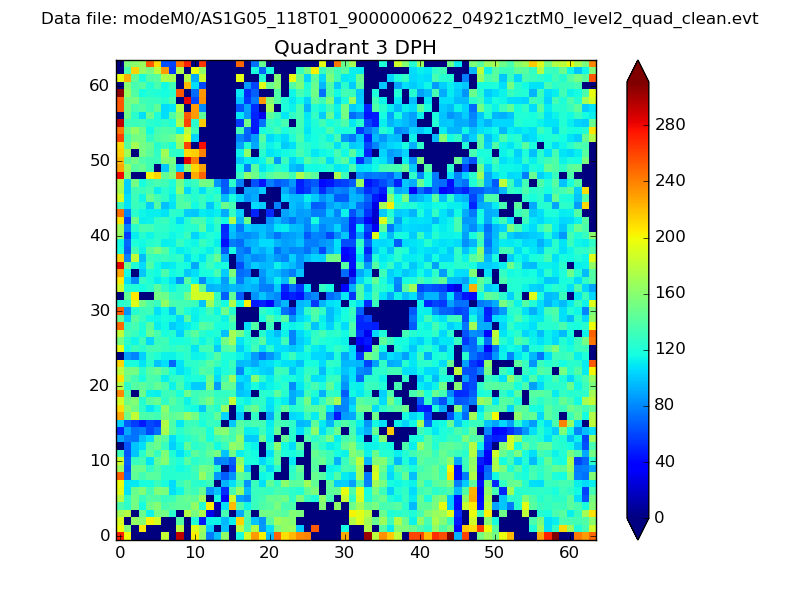 |
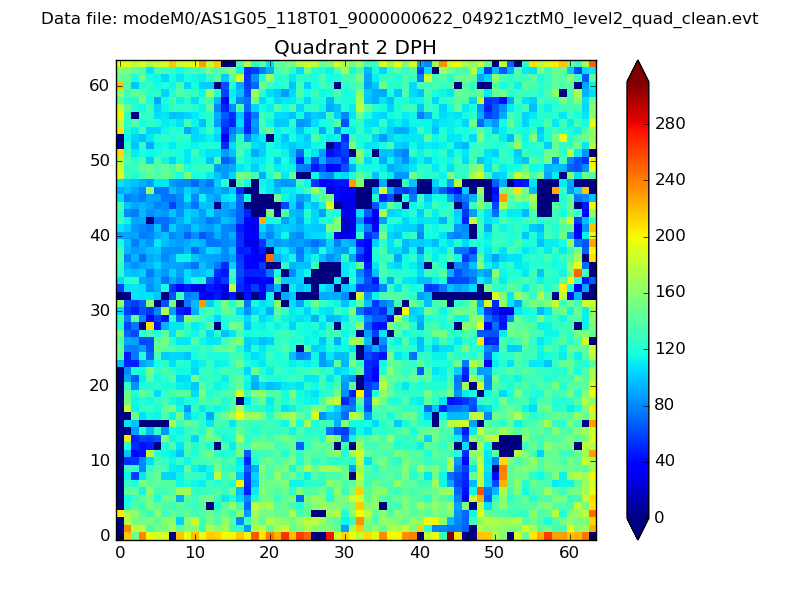 |
Quadrant C |
| Plot type | Count rate plots | Images |
|---|---|---|
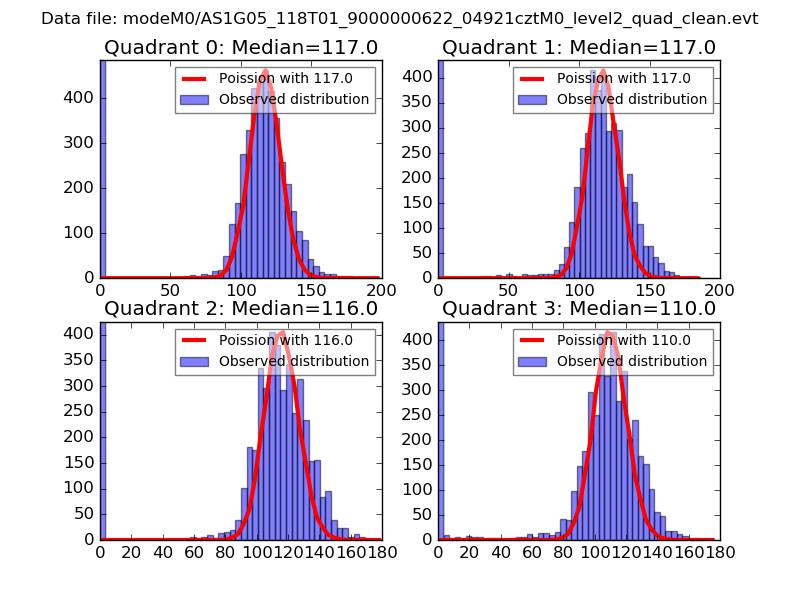
| Comparison with Poisson distribution Blue bars denote a histogram of data divided into 1 sec bins. Red curve is a Poisson curve with rate = median count rate of data. |
 |
 |
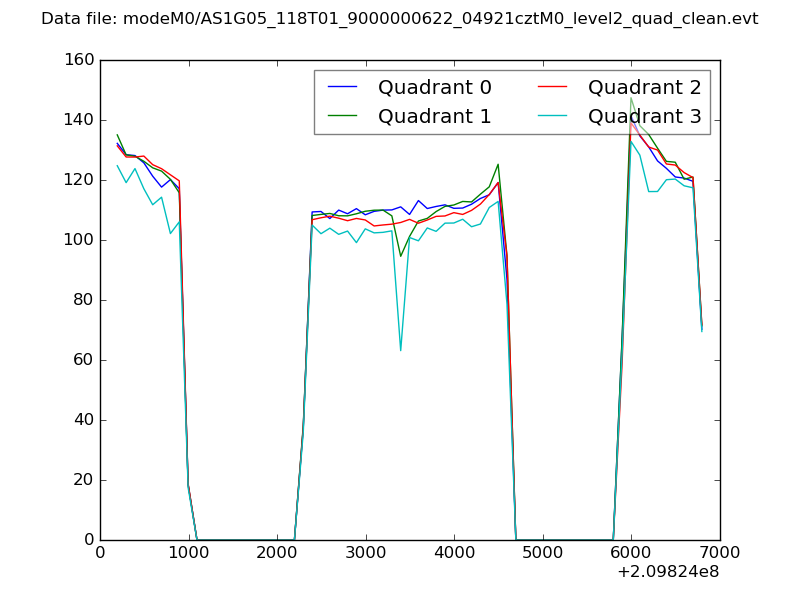
| Quadrant-wise count rates Data is divided into 100 sec bins |
 |
|
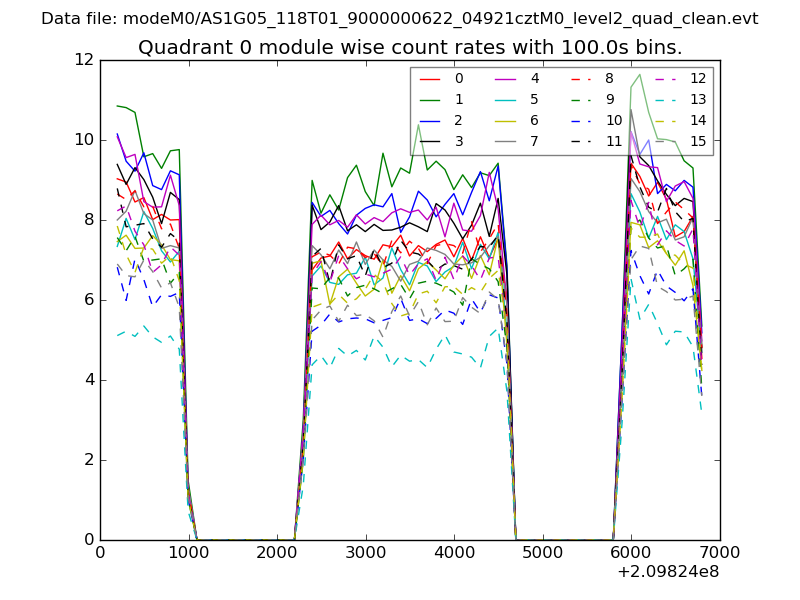
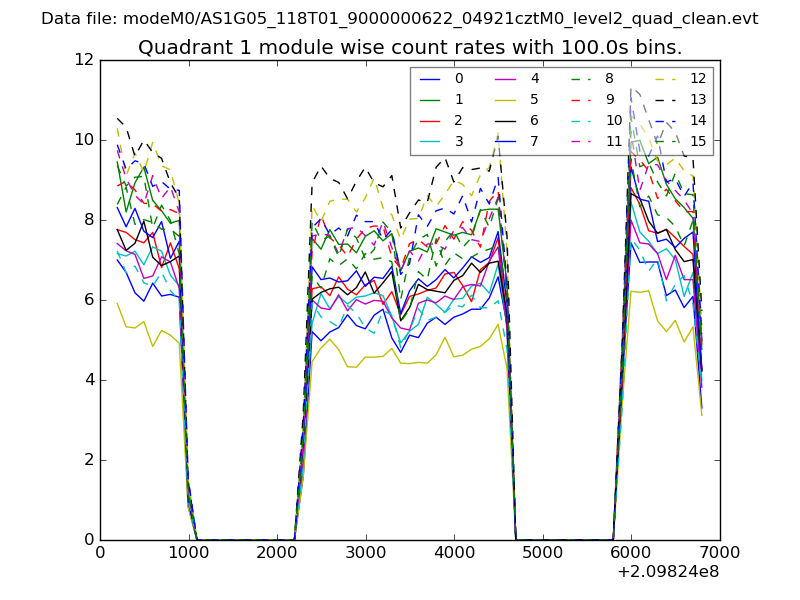
| Module-wise count rates for Quadrant A Data is divided into 100 sec bins |
 |
 |
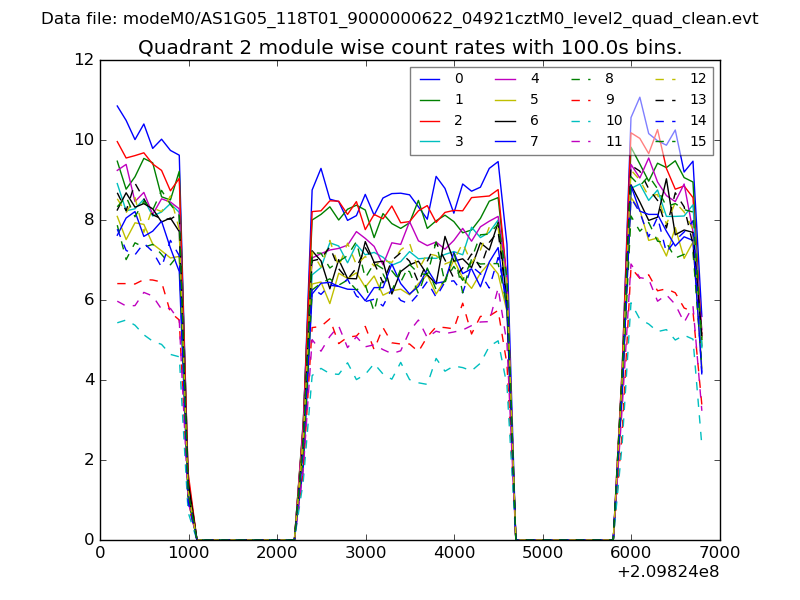
| Module-wise count rates for Quadrant B Data is divided into 100 sec bins |
 |
 |
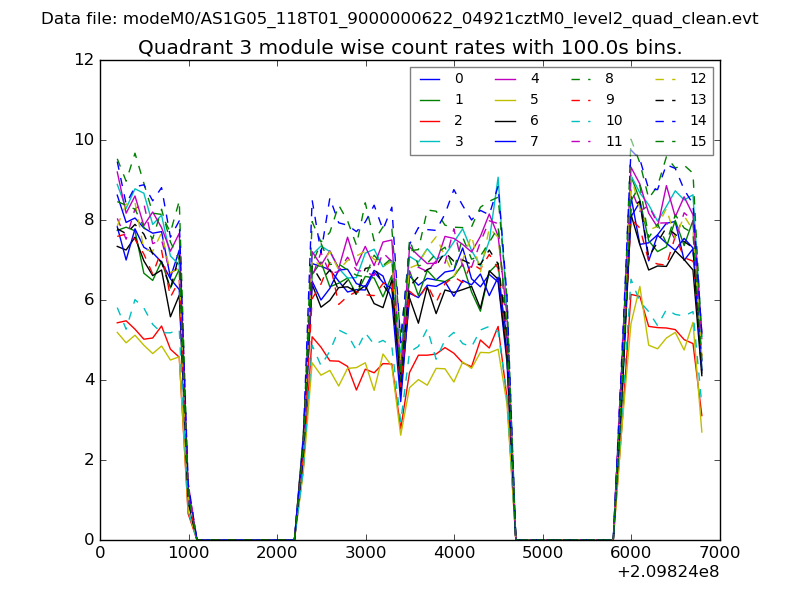
| Module-wise count rates for Quadrant C Data is divided into 100 sec bins |
 |
 |
| Module-wise count rates for Quadrant D Data is divided into 100 sec bins |
 |
 |
| Parameter | Plot |
|---|---|
| CZT HV Monitor | 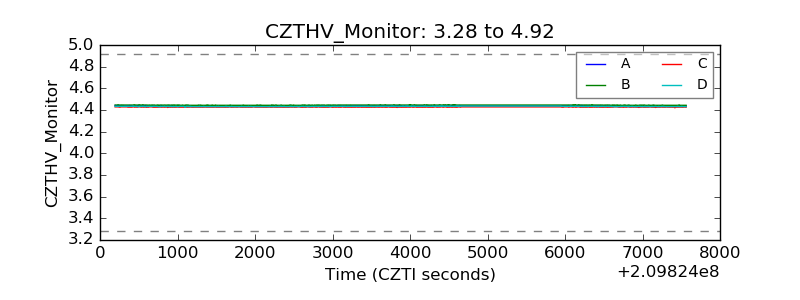 |
| D_VDD | 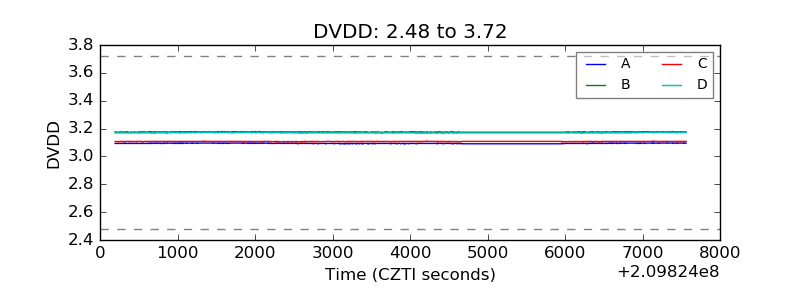 |
| Temperature 1 | 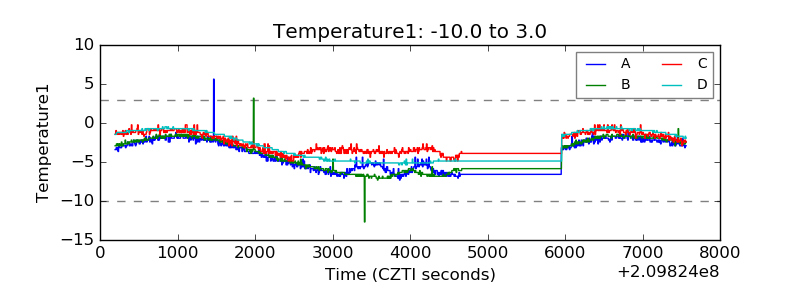 |
| Veto HV Monitor | 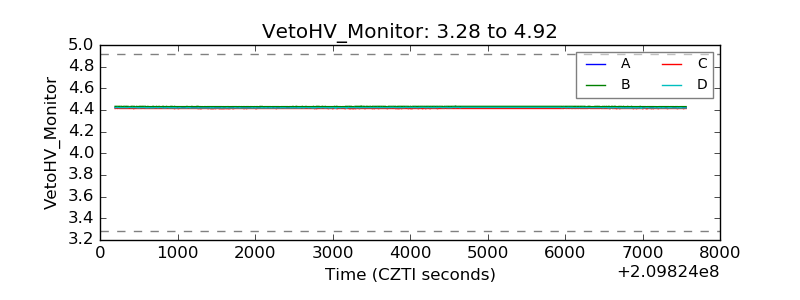 |
| Veto LLD | 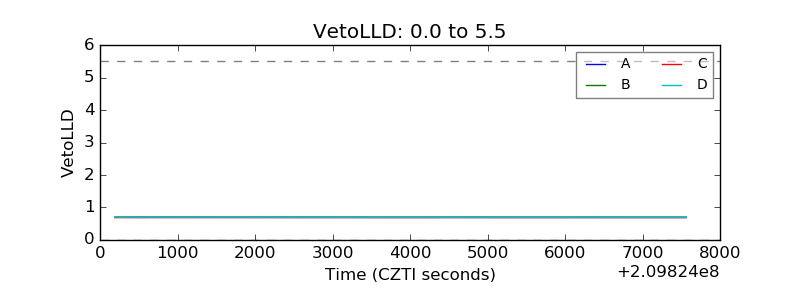 |
| Alpha Counter | 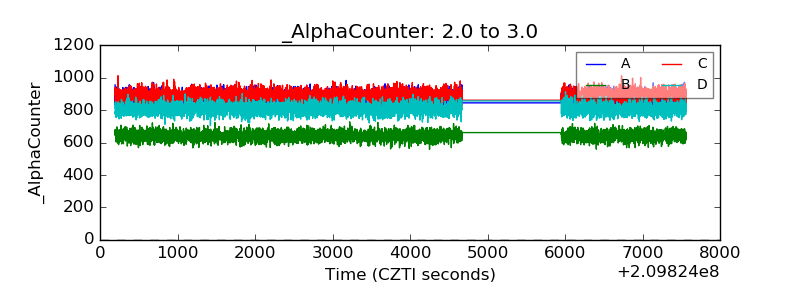 |
| _CPM_Rate | 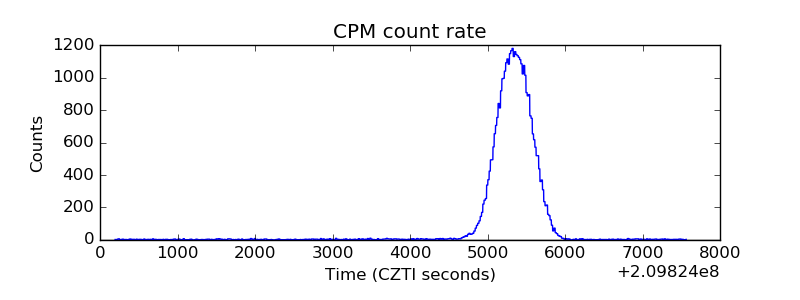 |
| CZT Counter | 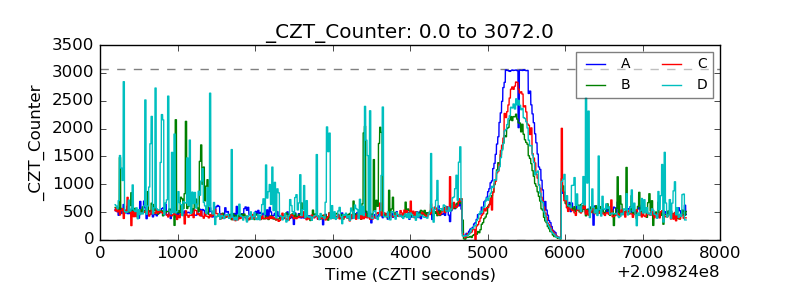 |
| +2.5 Volts monitor |  |
| +5 Volts monitor |  |
| _ROLL_ROT | 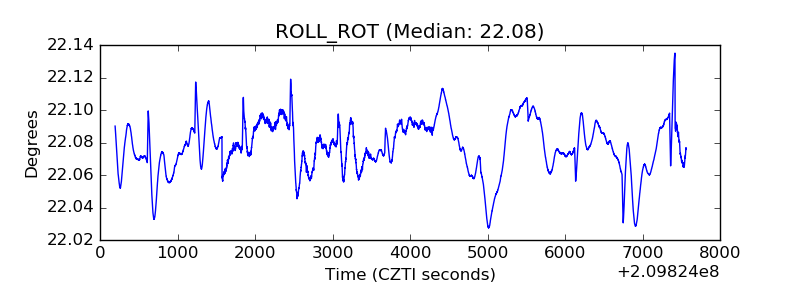 |
| _Roll_DEC | 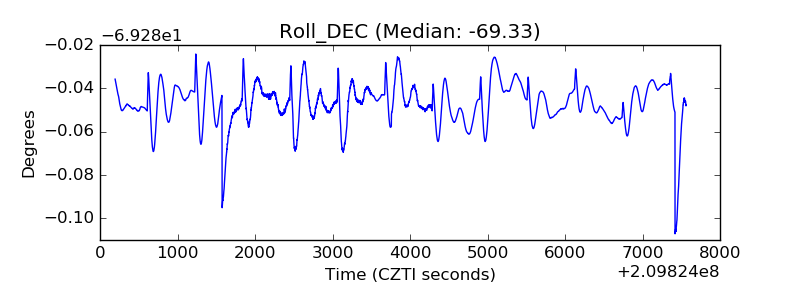 |
| _Roll_RA | 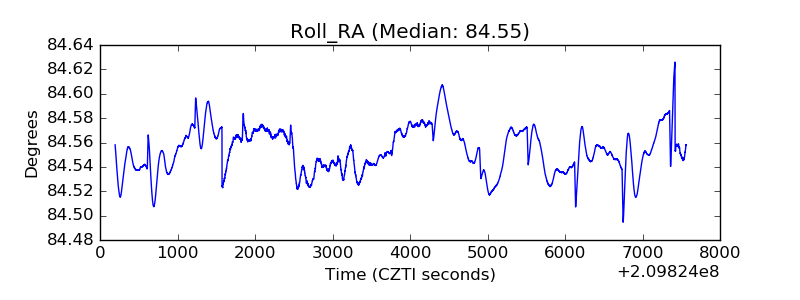 |
| Veto Counter | 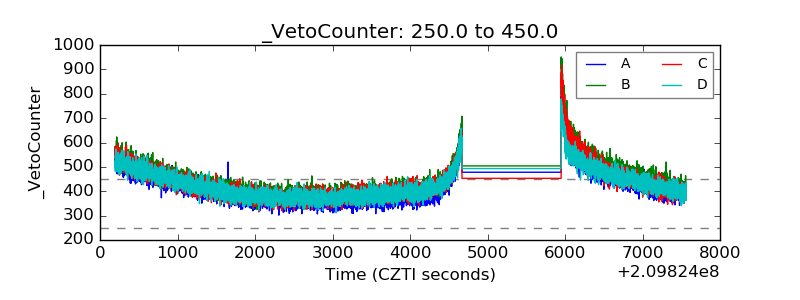 |