| Param | Original file | Final file |
|---|---|---|
| Filename | modeM0/AS1G05_118T01_9000000622_04923cztM0_level2.evt | modeM0/AS1G05_118T01_9000000622_04923cztM0_level2_quad_clean.evt |
| Size (bytes) | 434,692,800 | 61,522,560 |
| Size | 414.6 MB | 58.7 MB |
| Events in quadrant A | 2,774,964 | 369,404 |
| Events in quadrant B | 2,864,006 | 369,359 |
| Events in quadrant C | 2,626,207 | 364,813 |
| Events in quadrant D | 4,485,751 | 333,929 |
| Mode M0 | |||
|---|---|---|---|
| Quadrant | BADHDUFLAG | Total packets | Discarded packets |
| A | 0 | 12406 | 2 |
| B | 0 | 12639 | 1 |
| C | 0 | 12325 | 1 |
| D | 0 | 17463 | 1 |
| Mode M9 | |||
|---|---|---|---|
| Quadrant | BADHDUFLAG | Total packets | Discarded packets |
| A | 0 | 10 | 0 |
| B | 0 | 10 | 0 |
| C | 0 | 10 | 0 |
| D | 0 | 10 | 0 |
| Mode SS | |||
|---|---|---|---|
| Quadrant | BADHDUFLAG | Total packets | Discarded packets |
| A | 0 | 124 | 0 |
| B | 0 | 124 | 0 |
| C | 0 | 124 | 0 |
| D | 0 | 124 | 0 |
| Quadrant | Total seconds | Saturated seconds | Saturation percentage |
|---|---|---|---|
| A | 6083 | 33 | 0.542495% |
| B | 6083 | 36 | 0.591813% |
| C | 6083 | 7 | 0.115075% |
| D | 6083 | 446 | 7.331909% |
Noise dominated data is calculated using 1-second bins in cleaned event files. If a bin has >2000 counts, and if more than 50% of those come from <1% of pixels, then it is considered to be noise-dominated and hence unusable.
| Quadrant | # 1 sec bins | Bins with >0 counts | Bins with >2000 counts | High rate bins dominated by noise | Noise dominated (total time) | Noise dominated (detector-on time) | Marked lightcurve |
|---|---|---|---|---|---|---|---|
| A | 7118 | 6084 | 0 | 0 | 0.00% | 0.00% | 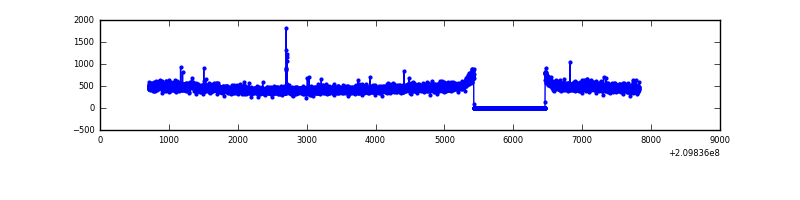 |
| B | 7118 | 6084 | 4 | 4 | 0.06% | 0.07% | 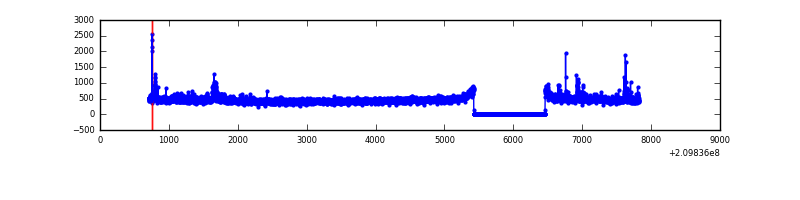 |
| C | 7118 | 6084 | 0 | 0 | 0.00% | 0.00% | 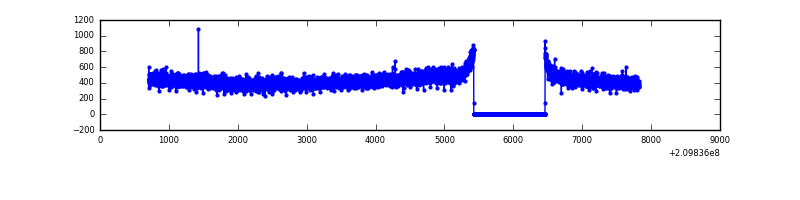 |
| D | 7118 | 6084 | 407 | 407 | 5.72% | 6.69% | 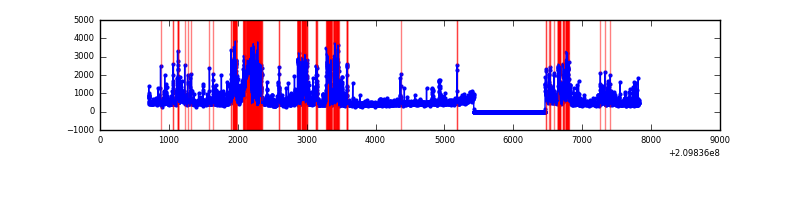 |
Top three noisy pixels from each quadrant. If the there are fewer than three noisy pixels in the level2.evt file, extra rows are filled as -1
| Pixel properties | Quadrant properties | ||||||
|---|---|---|---|---|---|---|---|
| Quadrant | DetID | PixID | Counts | Sigma | Mean | Median | Sigma |
| A | 0 | 31 | 80113 | 563.89 | 692 | 676 | 140.9 |
| A | 15 | 31 | 19867 | 136.23 | 692 | 676 | 140.9 |
| A | 0 | 50 | 10570 | 70.23 | 692 | 676 | 140.9 |
| B | 10 | 16 | 75275 | 569.22 | 697 | 682 | 131.0 |
| B | 15 | 204 | 36153 | 270.68 | 697 | 682 | 131.0 |
| B | 0 | 183 | 19361 | 142.54 | 697 | 682 | 131.0 |
| C | 7 | 238 | 5816 | 33.38 | 669 | 671 | 154.1 |
| C | 9 | 247 | 5748 | 32.94 | 669 | 671 | 154.1 |
| C | 13 | 61 | 5675 | 32.47 | 669 | 671 | 154.1 |
| D | 2 | 33 | 1343901 | 8456.67 | 652 | 630 | 158.8 |
| D | 2 | 136 | 168127 | 1054.49 | 652 | 630 | 158.8 |
| D | 1 | 7 | 150150 | 941.32 | 652 | 630 | 158.8 |
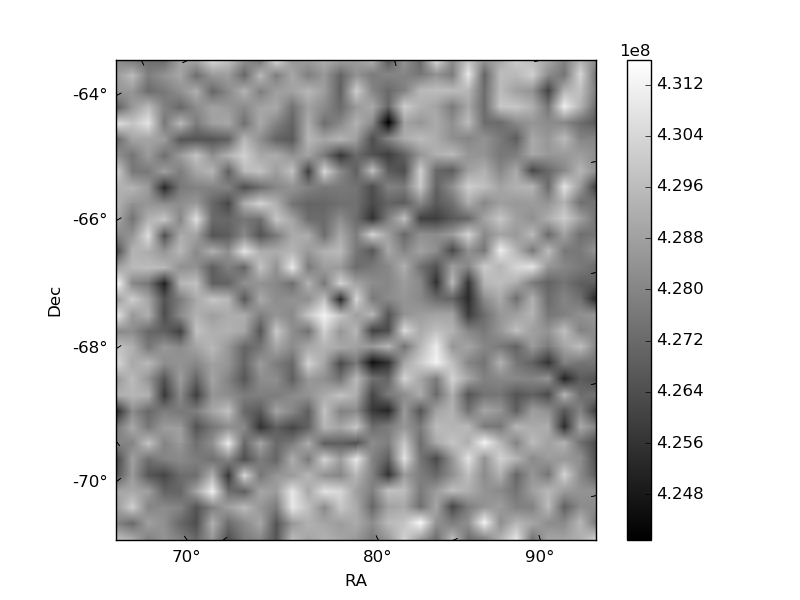
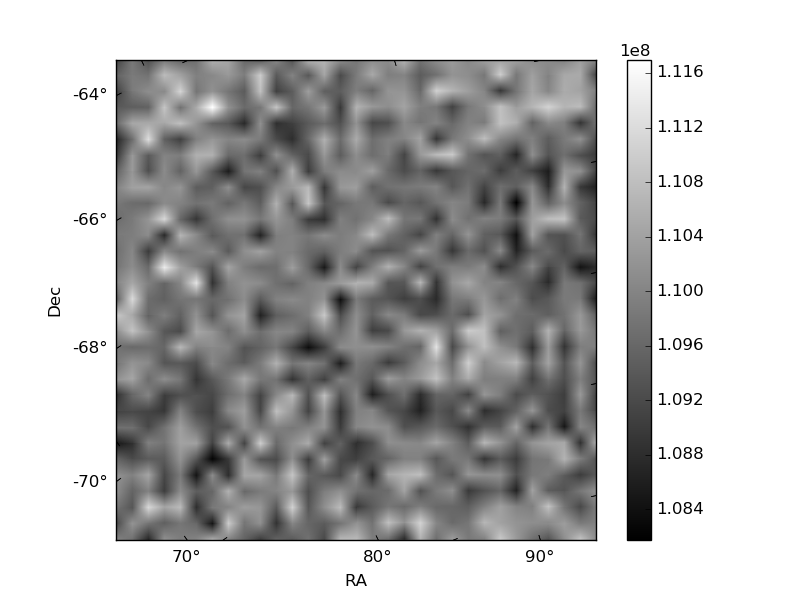
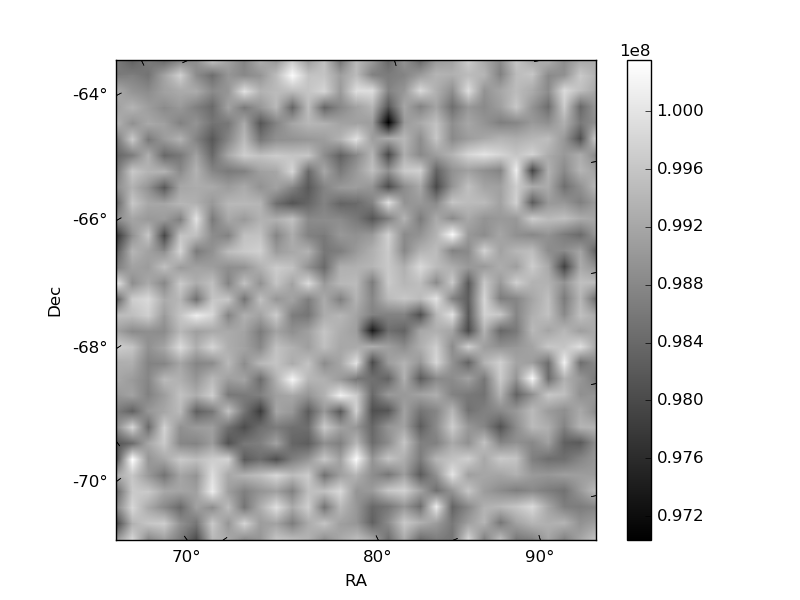
Histogram calculated using DETX and DETY for each event in the final _common_clean file
| Quadrant A | 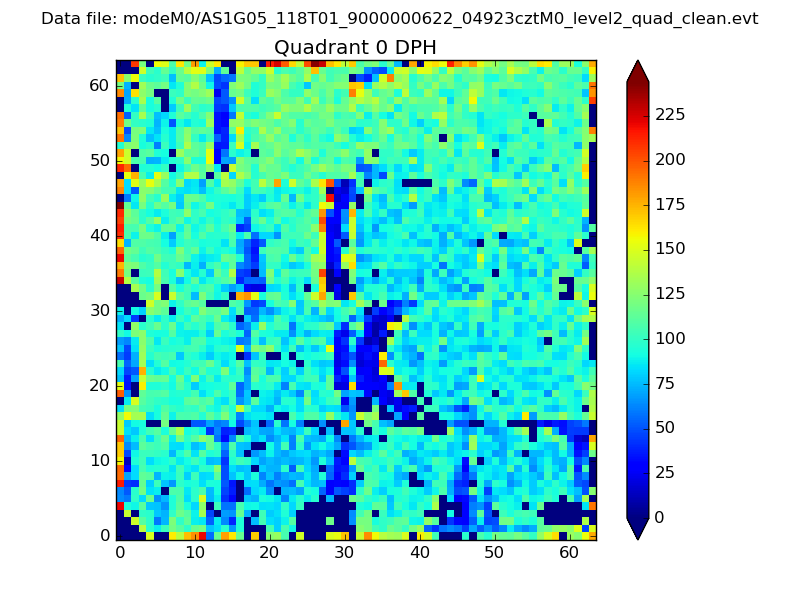 |
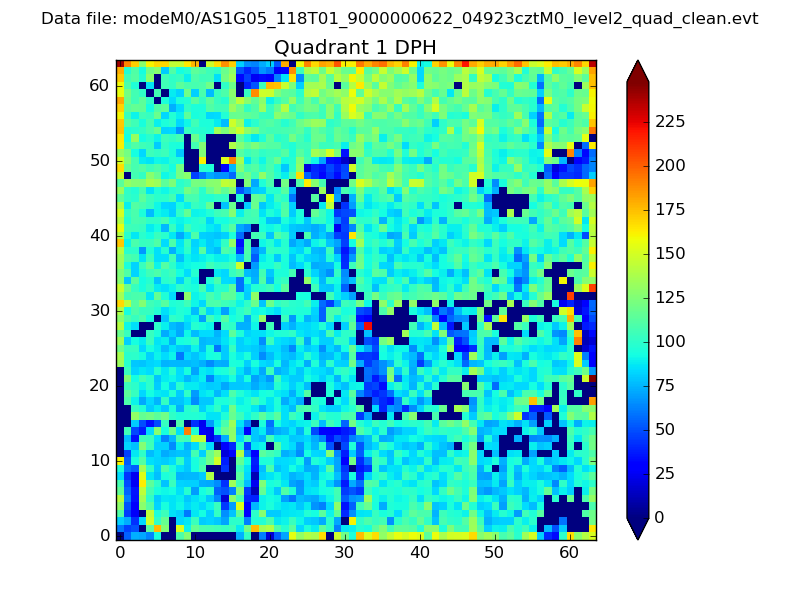 |
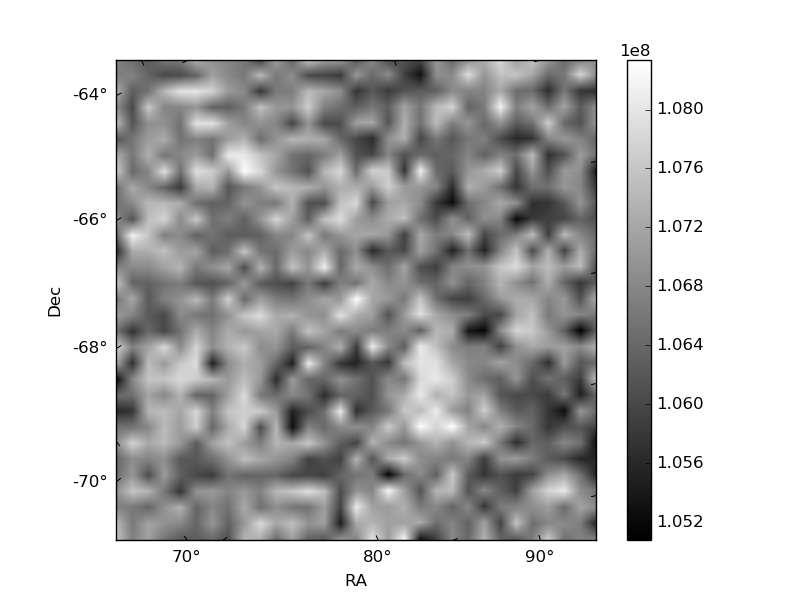
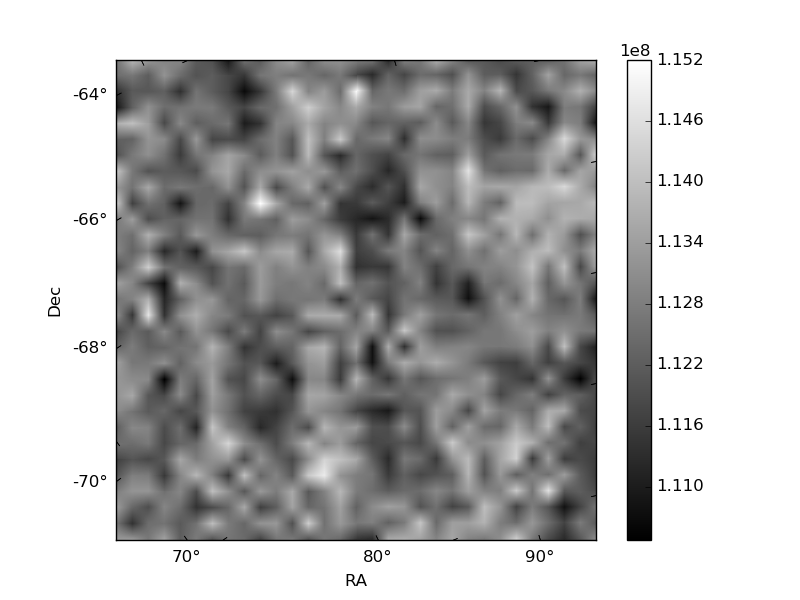
Quadrant B |
|---|---|---|---|
| Quadrant D | 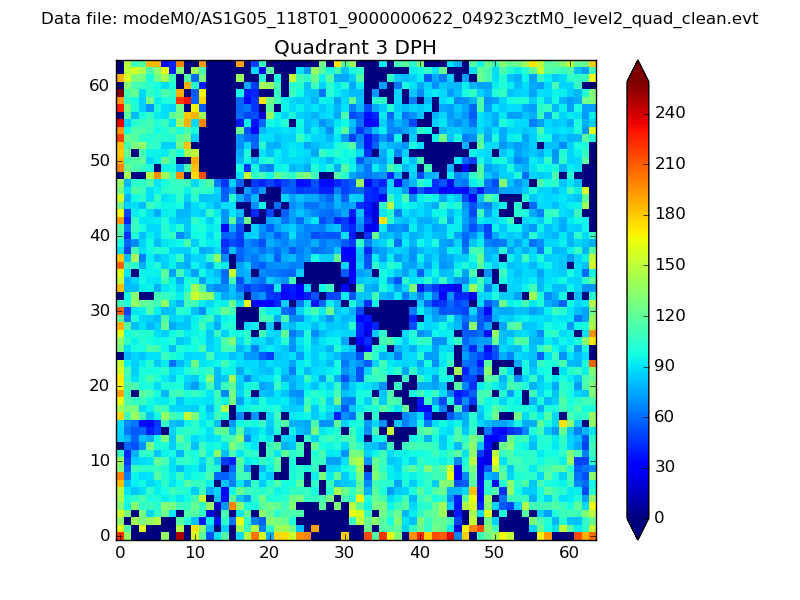 |
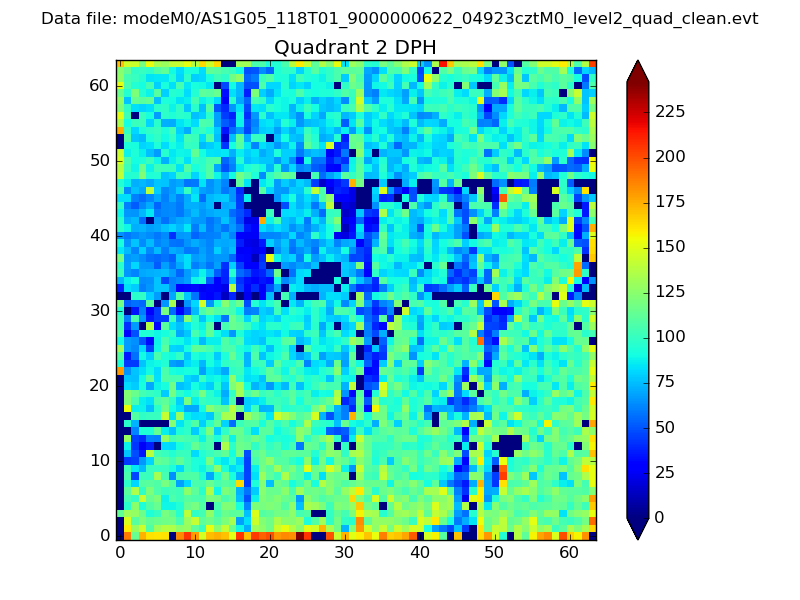 |
Quadrant C |
| Plot type | Count rate plots | Images |
|---|---|---|
| Comparison with Poisson distribution Blue bars denote a histogram of data divided into 1 sec bins. Red curve is a Poisson curve with rate = median count rate of data. |
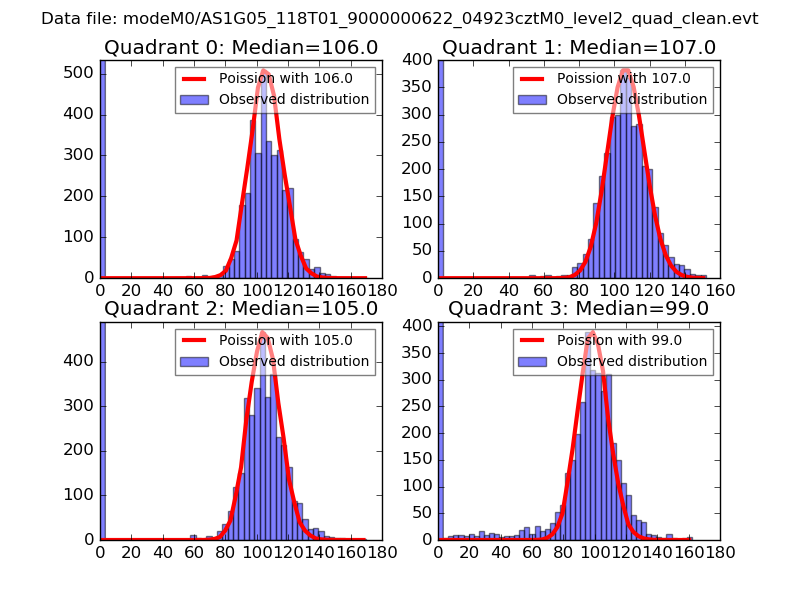 |
 |
| Quadrant-wise count rates Data is divided into 100 sec bins |
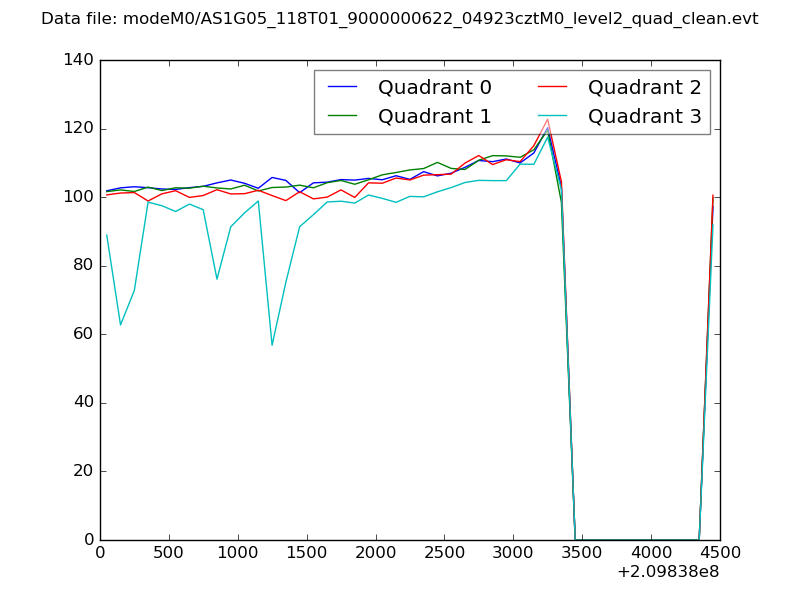 |
|
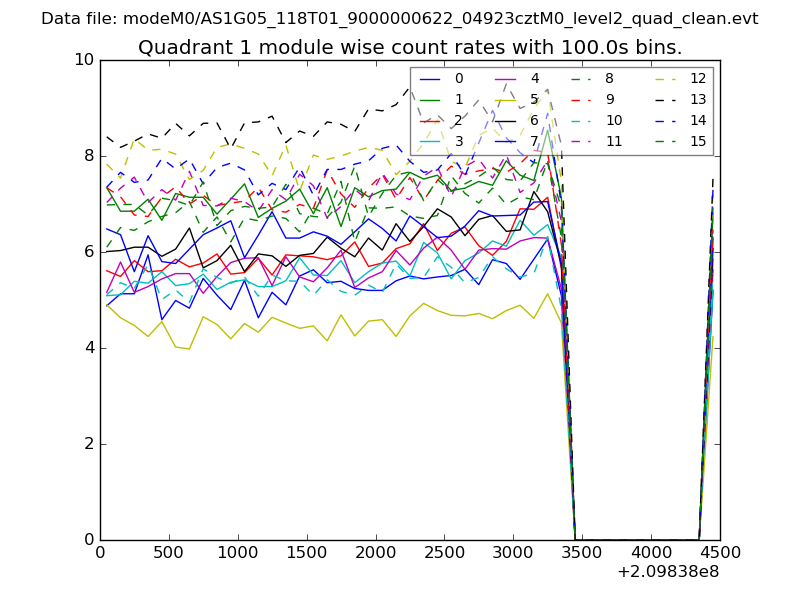
| Module-wise count rates for Quadrant A Data is divided into 100 sec bins |
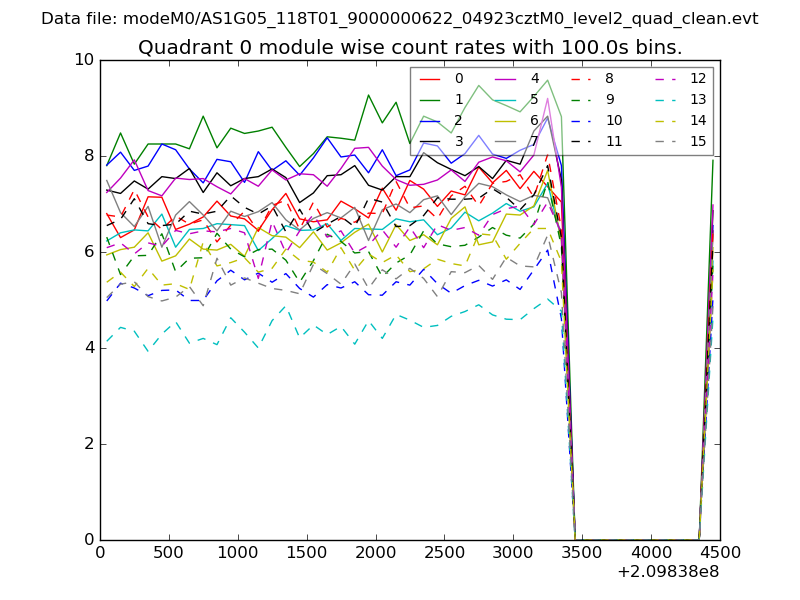 |
 |
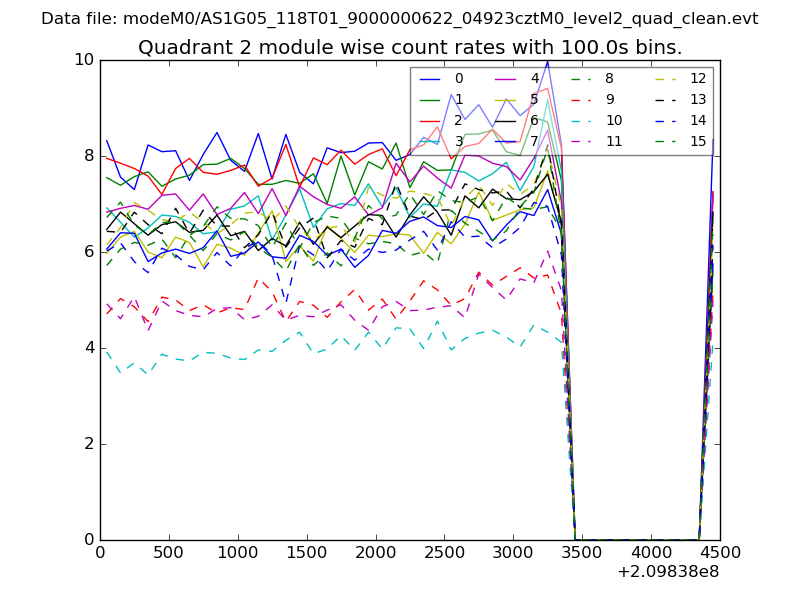
| Module-wise count rates for Quadrant B Data is divided into 100 sec bins |
 |
 |
| Module-wise count rates for Quadrant C Data is divided into 100 sec bins |
 |
 |
| Module-wise count rates for Quadrant D Data is divided into 100 sec bins |
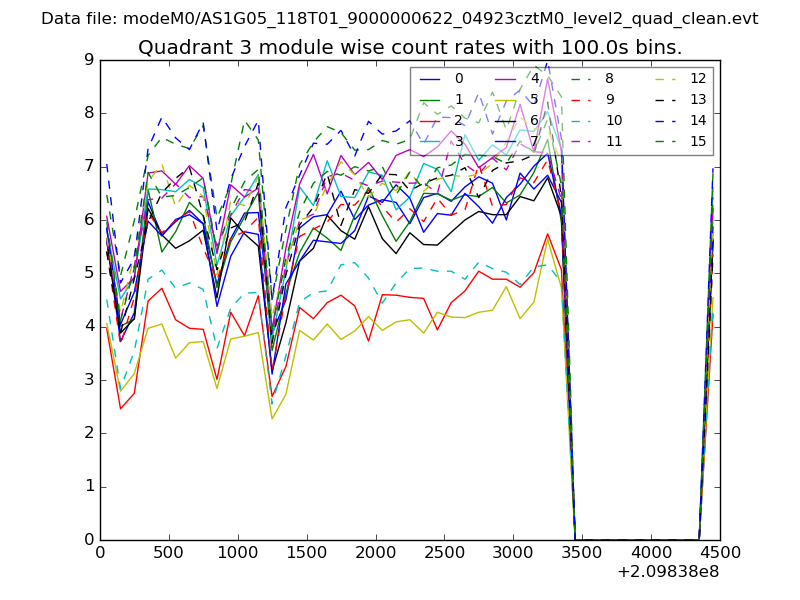 |
 |
| Parameter | Plot |
|---|---|
| CZT HV Monitor | 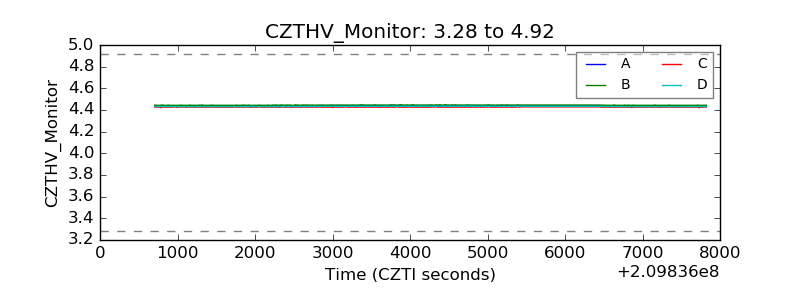 |
| D_VDD | 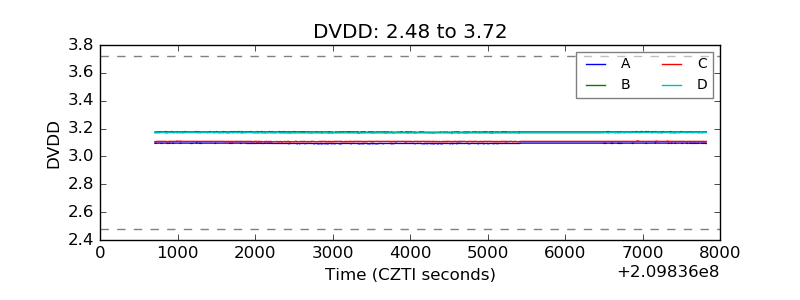 |
| Temperature 1 | 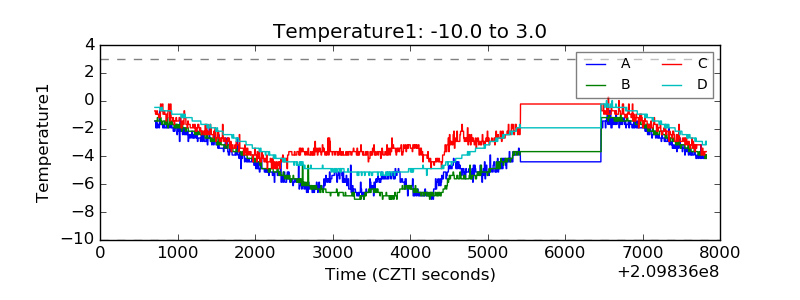 |
| Veto HV Monitor | 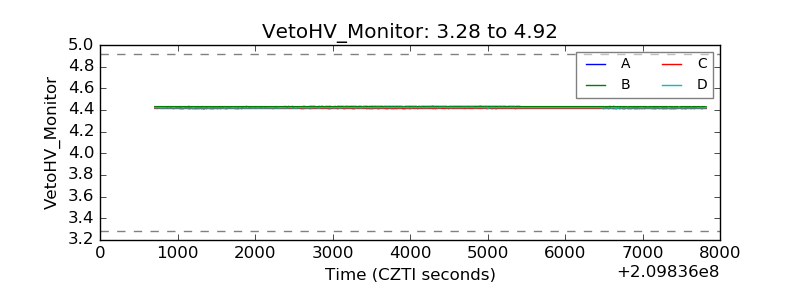 |
| Veto LLD | 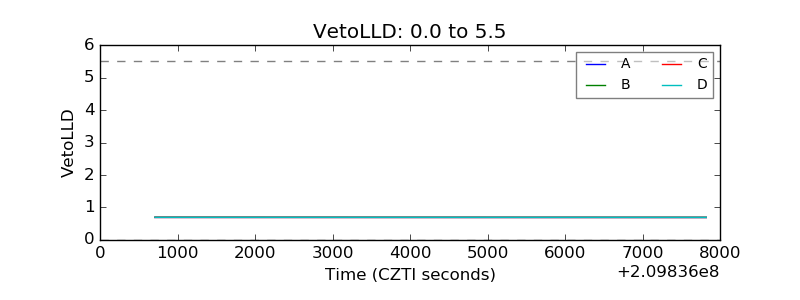 |
| Alpha Counter | 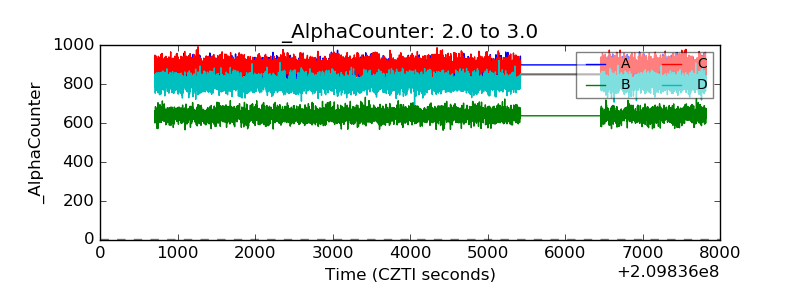 |
| _CPM_Rate | 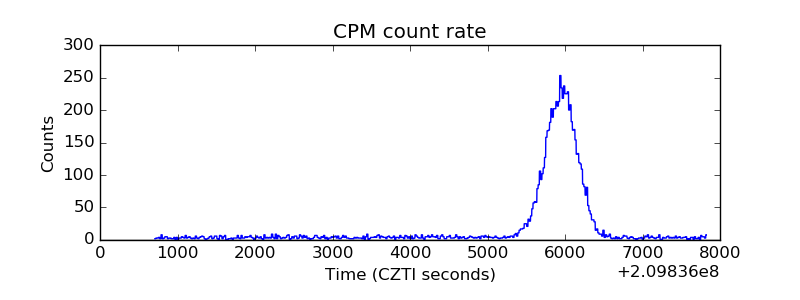 |
| CZT Counter | 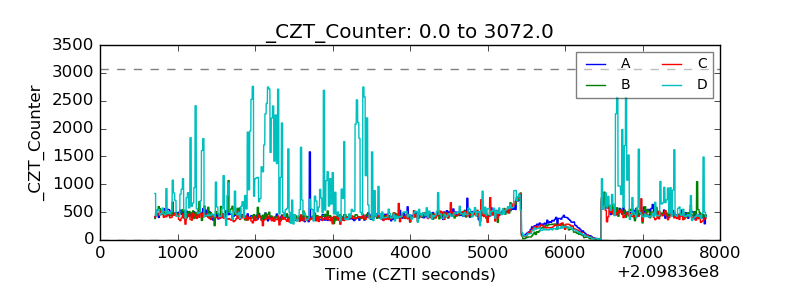 |
| +2.5 Volts monitor | 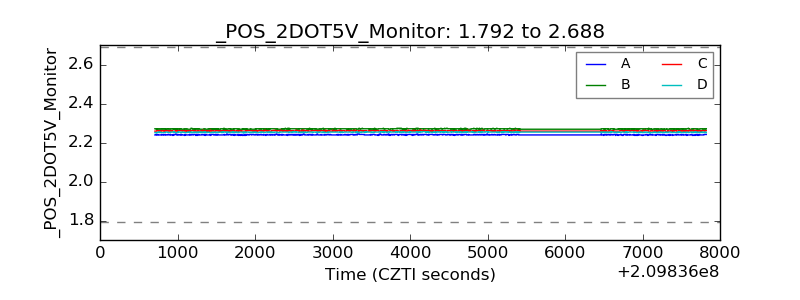 |
| +5 Volts monitor | 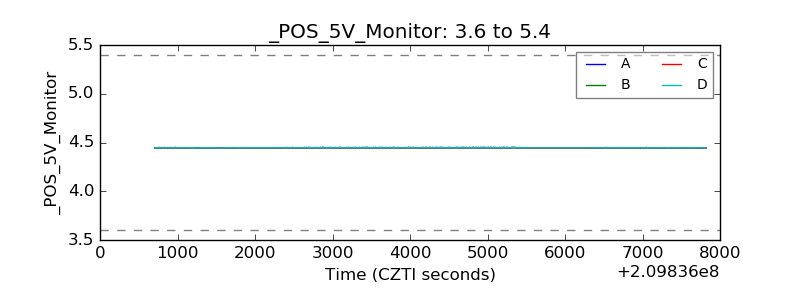 |
| _ROLL_ROT | 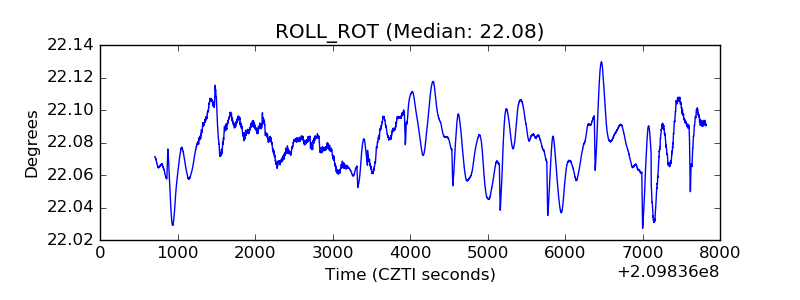 |
| _Roll_DEC | 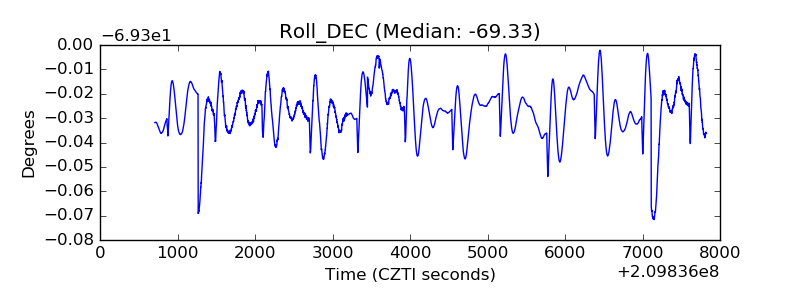 |
| _Roll_RA | 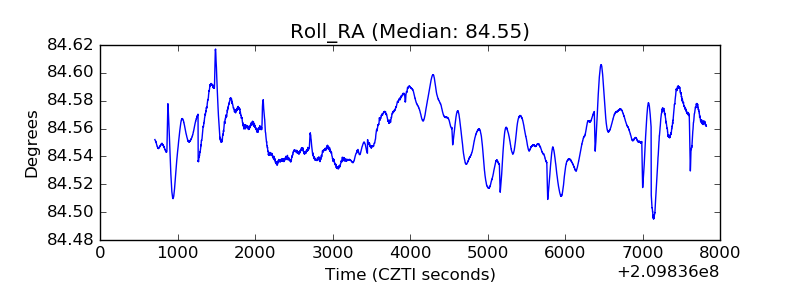 |
| Veto Counter | 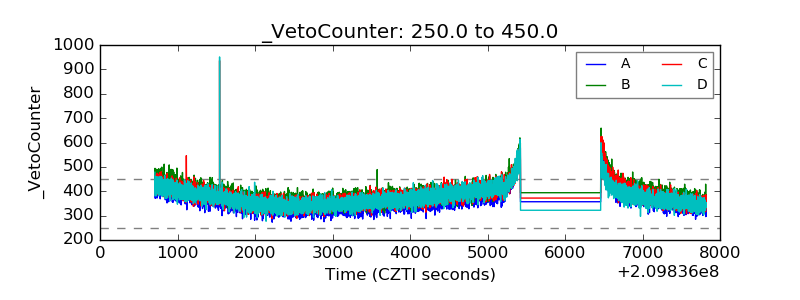 |