| Param | Original file | Final file |
|---|---|---|
| Filename | modeM0/AS1G05_118T01_9000000622_04924cztM0_level2.evt | modeM0/AS1G05_118T01_9000000622_04924cztM0_level2_quad_clean.evt |
| Size (bytes) | 552,559,680 | 75,960,000 |
| Size | 527.0 MB | 72.4 MB |
| Events in quadrant A | 3,311,644 | 470,654 |
| Events in quadrant B | 3,314,118 | 472,597 |
| Events in quadrant C | 3,039,416 | 470,959 |
| Events in quadrant D | 6,591,935 | 395,590 |
| Mode M0 | |||
|---|---|---|---|
| Quadrant | BADHDUFLAG | Total packets | Discarded packets |
| A | 0 | 14821 | 3 |
| B | 0 | 14747 | 2 |
| C | 0 | 14326 | 2 |
| D | 0 | 24459 | 2 |
| Mode M9 | |||
|---|---|---|---|
| Quadrant | BADHDUFLAG | Total packets | Discarded packets |
| A | 0 | 10 | 0 |
| B | 0 | 10 | 0 |
| C | 0 | 10 | 0 |
| D | 0 | 11 | 0 |
| Mode SS | |||
|---|---|---|---|
| Quadrant | BADHDUFLAG | Total packets | Discarded packets |
| A | 0 | 144 | 0 |
| B | 0 | 144 | 0 |
| C | 0 | 144 | 0 |
| D | 0 | 144 | 0 |
| Quadrant | Total seconds | Saturated seconds | Saturation percentage |
|---|---|---|---|
| A | 7028 | 75 | 1.067160% |
| B | 7028 | 77 | 1.095618% |
| C | 7028 | 22 | 0.313034% |
| D | 7028 | 1016 | 14.456460% |
Noise dominated data is calculated using 1-second bins in cleaned event files. If a bin has >2000 counts, and if more than 50% of those come from <1% of pixels, then it is considered to be noise-dominated and hence unusable.
| Quadrant | # 1 sec bins | Bins with >0 counts | Bins with >2000 counts | High rate bins dominated by noise | Noise dominated (total time) | Noise dominated (detector-on time) | Marked lightcurve |
|---|---|---|---|---|---|---|---|
| A | 7648 | 7028 | 13 | 13 | 0.17% | 0.18% | 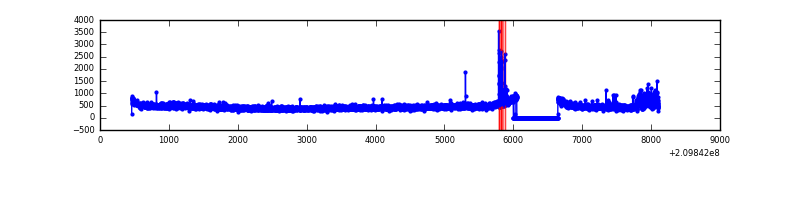 |
| B | 7648 | 7028 | 3 | 3 | 0.04% | 0.04% | 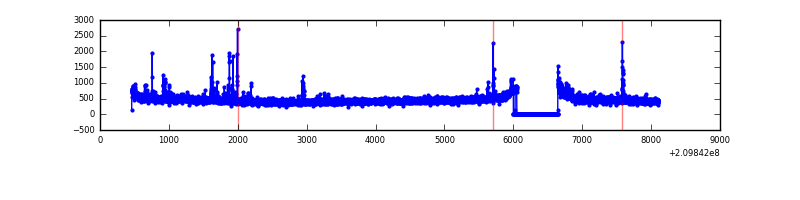 |
| C | 7648 | 7029 | 1 | 1 | 0.01% | 0.01% | 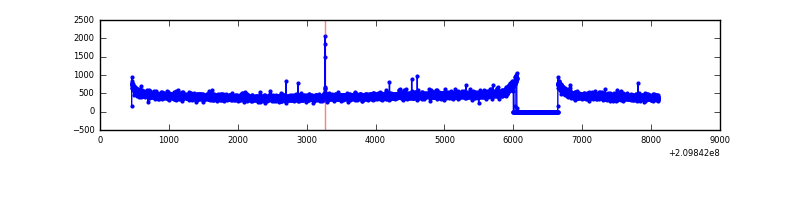 |
| D | 7648 | 7028 | 980 | 980 | 12.81% | 13.94% | 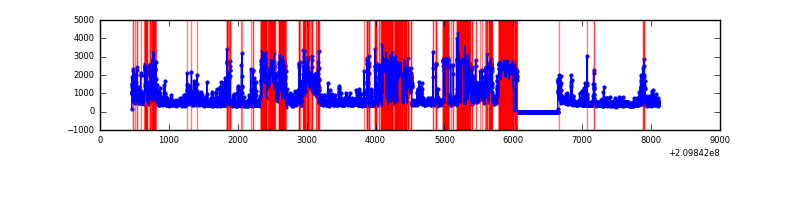 |
Top three noisy pixels from each quadrant. If the there are fewer than three noisy pixels in the level2.evt file, extra rows are filled as -1
| Pixel properties | Quadrant properties | ||||||
|---|---|---|---|---|---|---|---|
| Quadrant | DetID | PixID | Counts | Sigma | Mean | Median | Sigma |
| A | 0 | 31 | 206298 | 1260.07 | 798 | 777 | 163.1 |
| A | 15 | 31 | 22818 | 135.14 | 798 | 777 | 163.1 |
| A | 12 | 194 | 8185 | 45.42 | 798 | 777 | 163.1 |
| B | 10 | 16 | 73330 | 473.07 | 803 | 785 | 153.4 |
| B | 4 | 80 | 34283 | 218.44 | 803 | 785 | 153.4 |
| B | 0 | 183 | 22619 | 142.38 | 803 | 785 | 153.4 |
| C | 1 | 16 | 7752 | 39.07 | 773 | 775 | 178.6 |
| C | 9 | 247 | 6995 | 34.83 | 773 | 775 | 178.6 |
| C | 13 | 61 | 6493 | 32.02 | 773 | 775 | 178.6 |
| D | 1 | 7 | 2950829 | 16773.53 | 712 | 687 | 175.9 |
| D | 2 | 33 | 422279 | 2397.03 | 712 | 687 | 175.9 |
| D | 2 | 234 | 128262 | 725.35 | 712 | 687 | 175.9 |
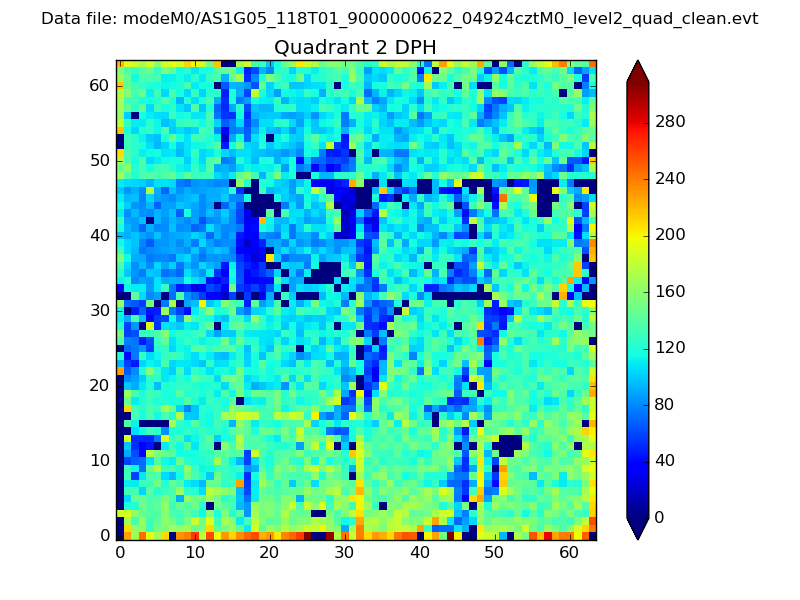
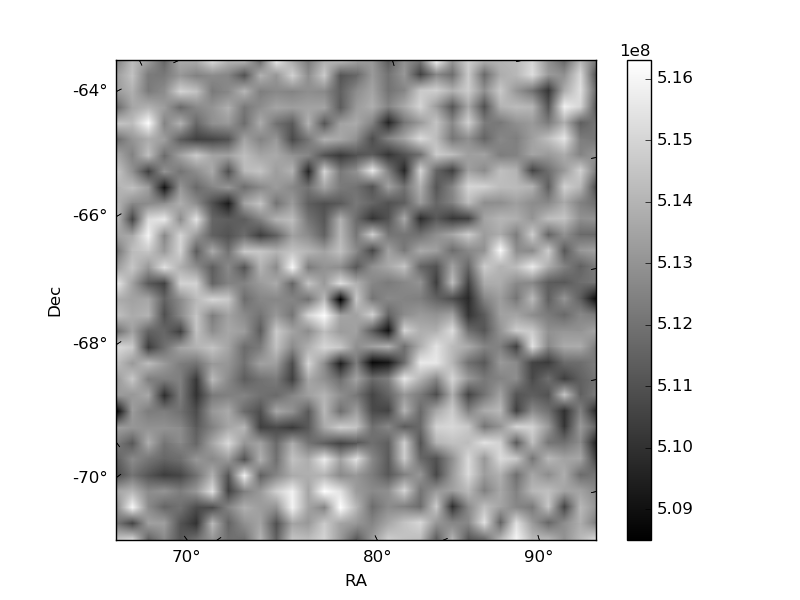
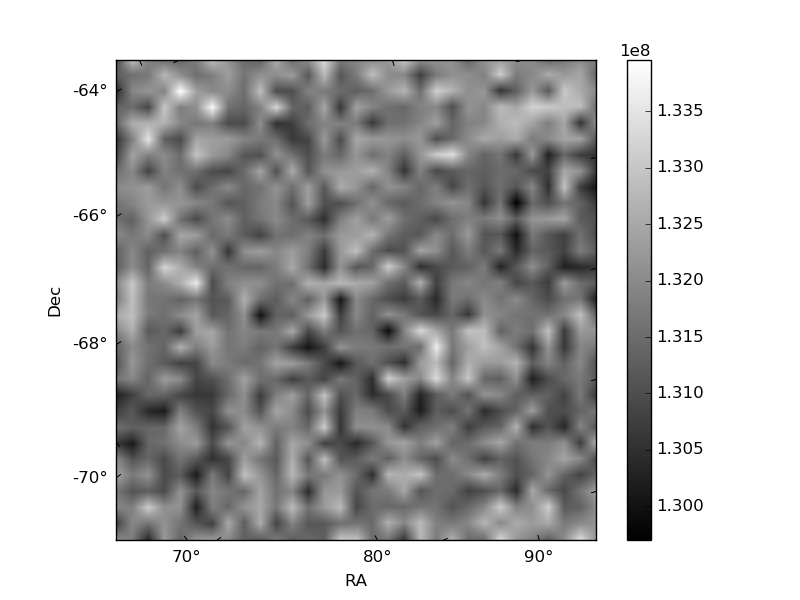
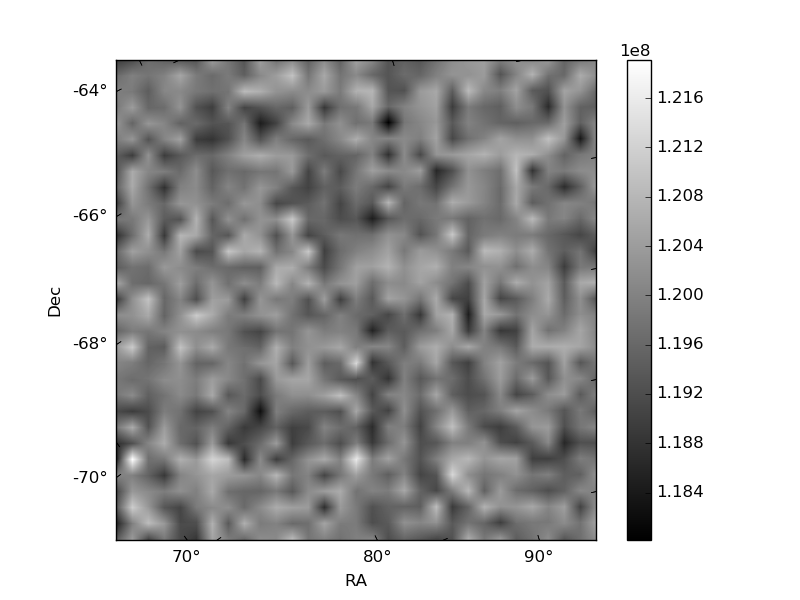
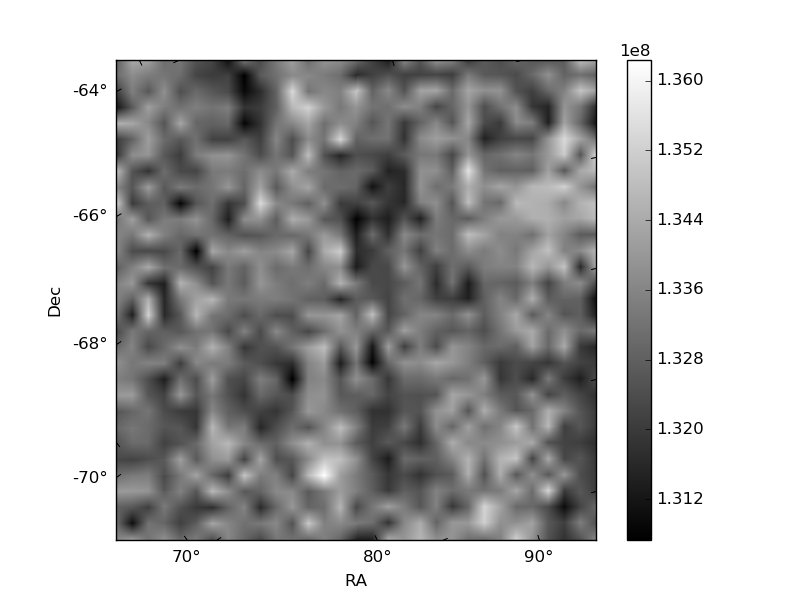
Histogram calculated using DETX and DETY for each event in the final _common_clean file
| Quadrant A | 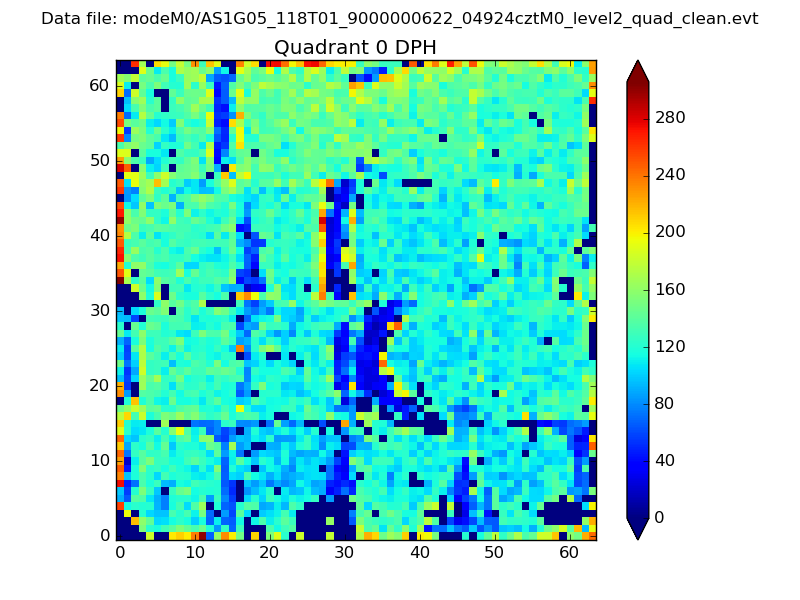 |
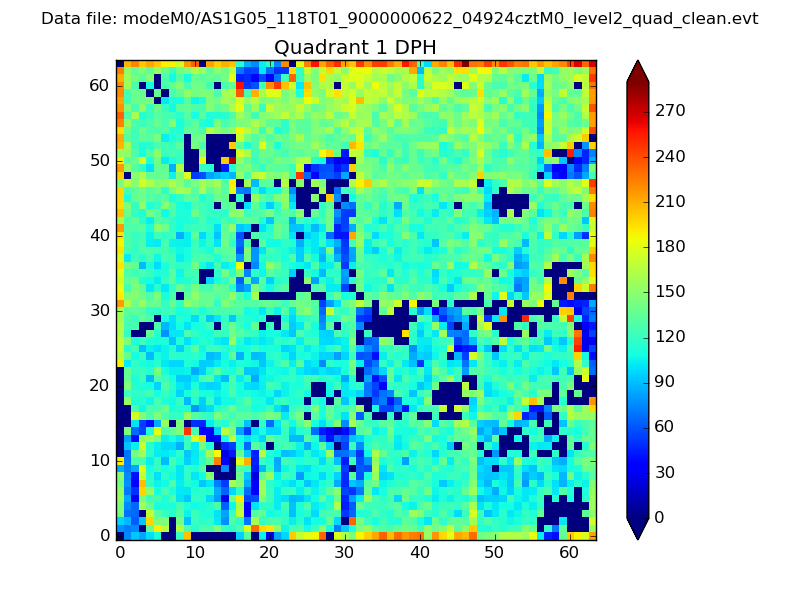 |
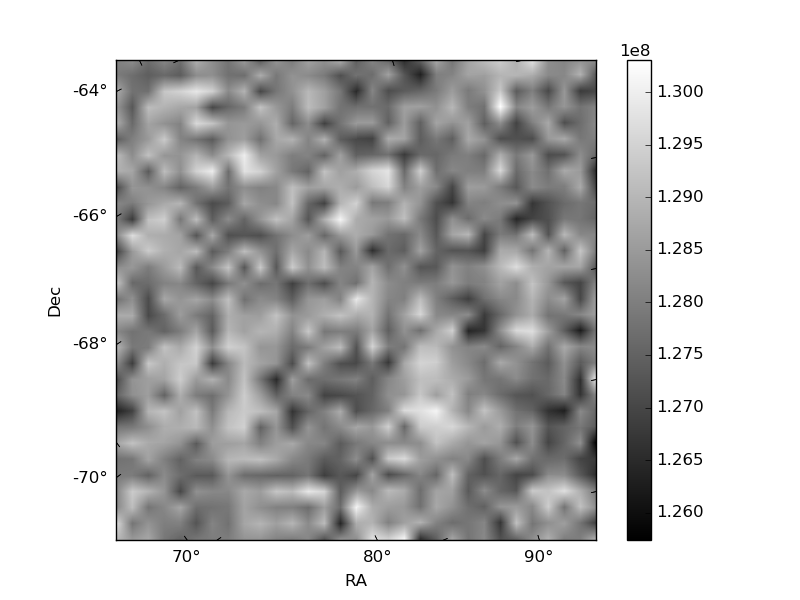
Quadrant B |
|---|---|---|---|
| Quadrant D | 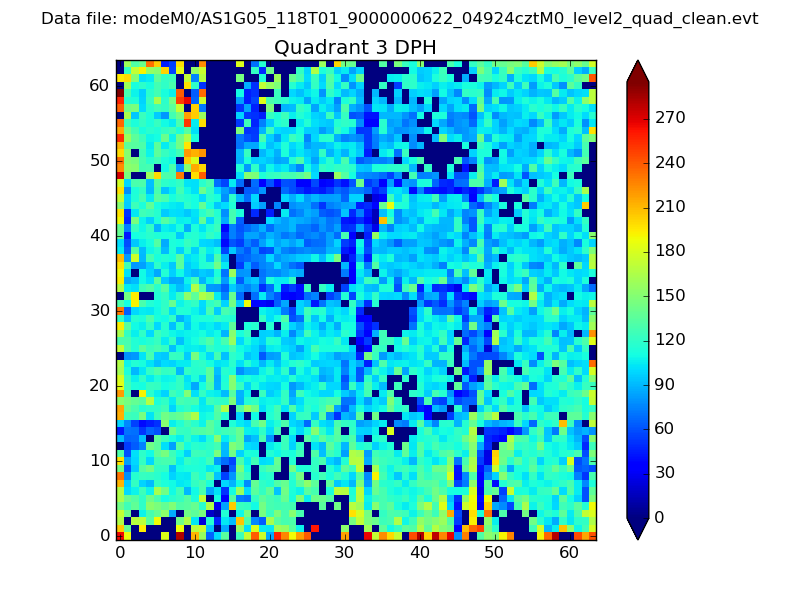 |
 |
Quadrant C |
| Plot type | Count rate plots | Images |
|---|---|---|
| Comparison with Poisson distribution Blue bars denote a histogram of data divided into 1 sec bins. Red curve is a Poisson curve with rate = median count rate of data. |
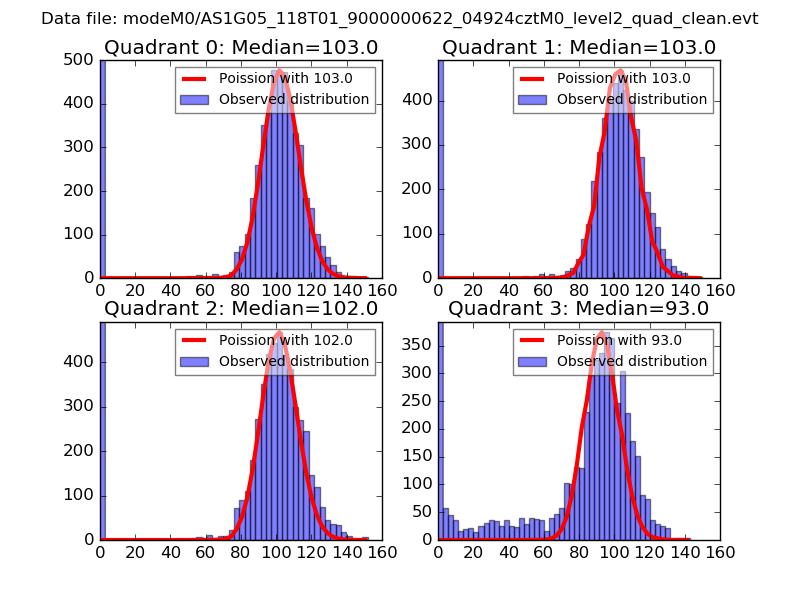 |
 |
| Quadrant-wise count rates Data is divided into 100 sec bins |
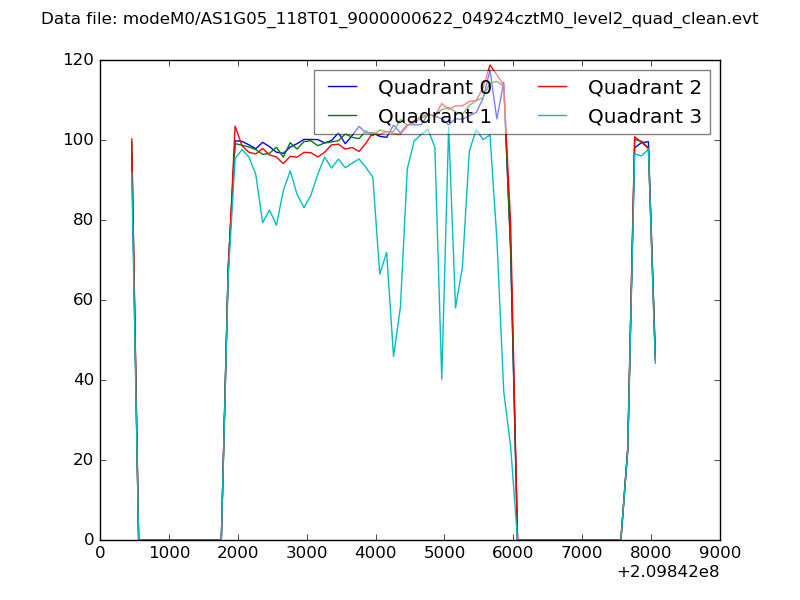 |
|
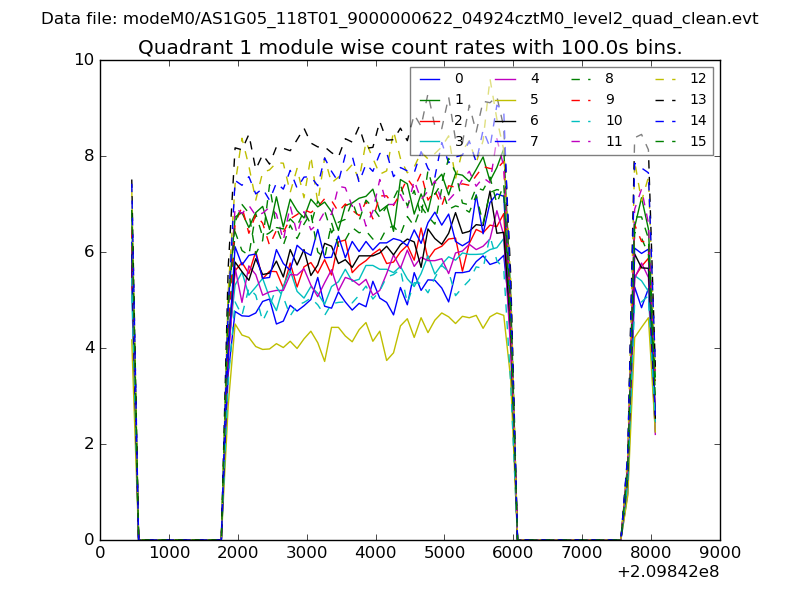
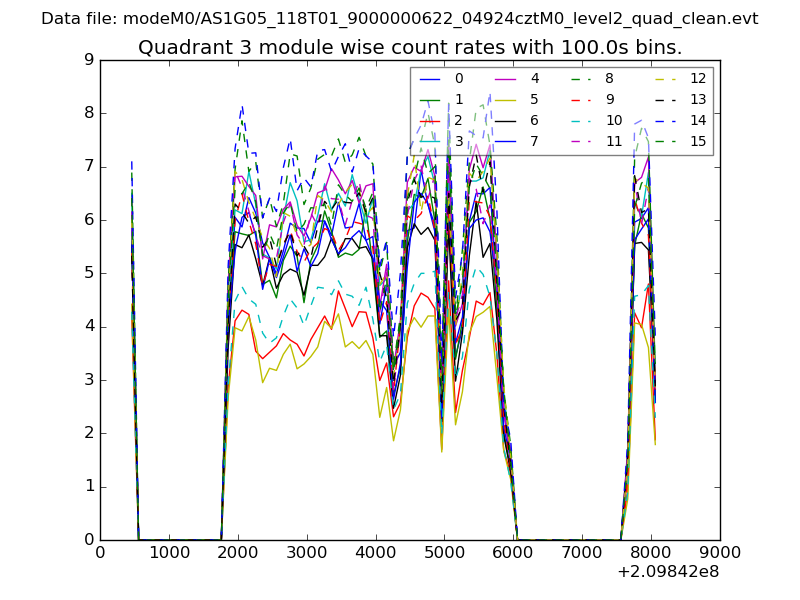
| Module-wise count rates for Quadrant A Data is divided into 100 sec bins |
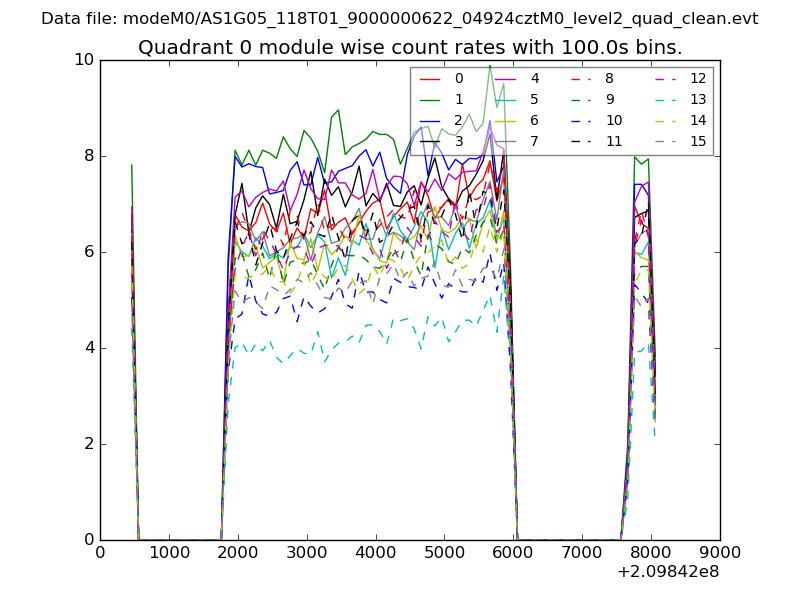 |
 |
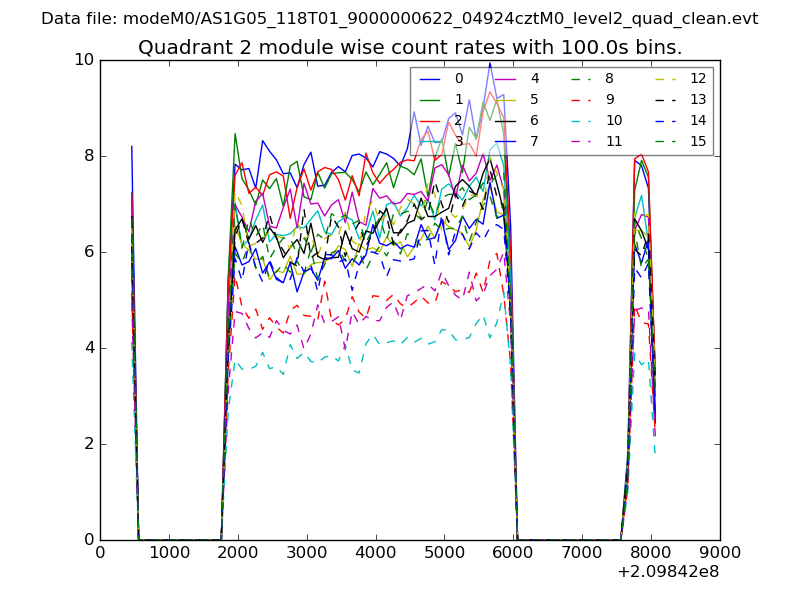
| Module-wise count rates for Quadrant B Data is divided into 100 sec bins |
 |
 |
| Module-wise count rates for Quadrant C Data is divided into 100 sec bins |
 |
 |
| Module-wise count rates for Quadrant D Data is divided into 100 sec bins |
 |
 |
| Parameter | Plot |
|---|---|
| CZT HV Monitor | 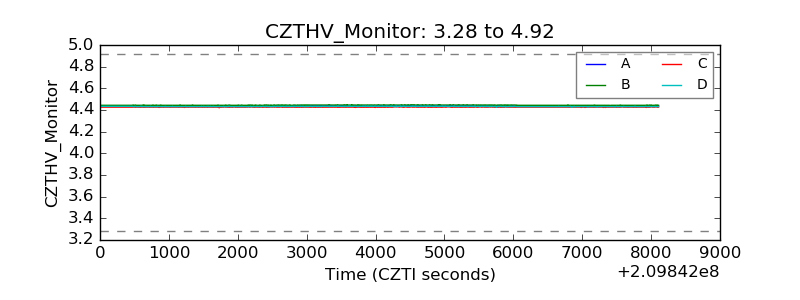 |
| D_VDD | 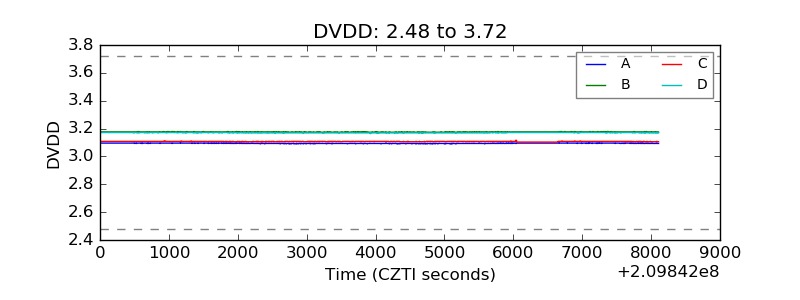 |
| Temperature 1 | 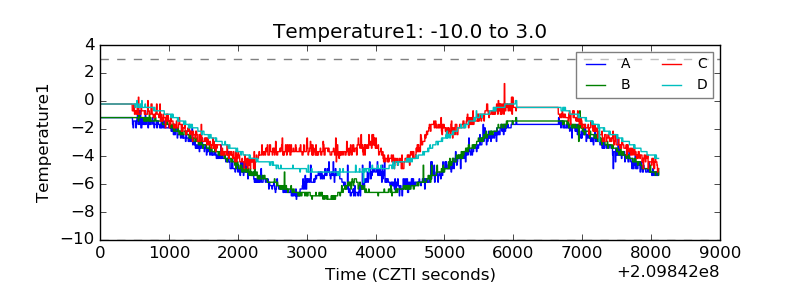 |
| Veto HV Monitor | 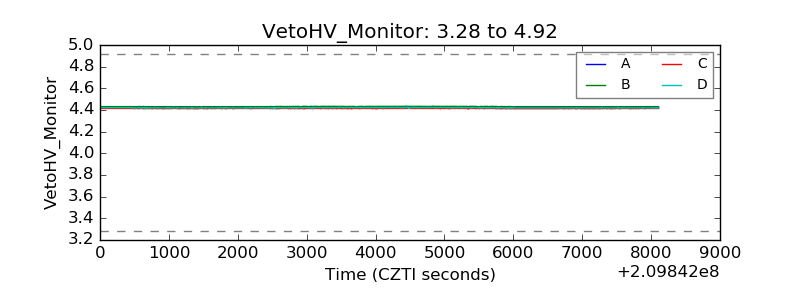 |
| Veto LLD | 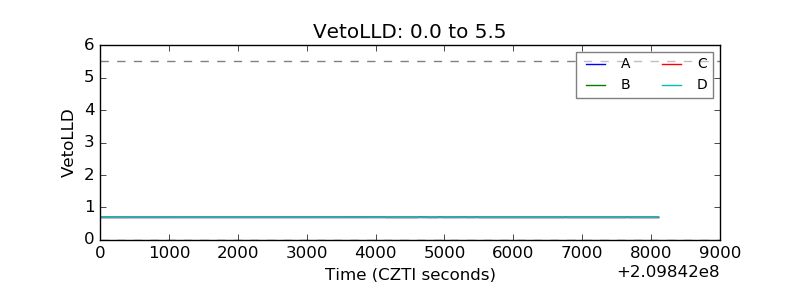 |
| Alpha Counter | 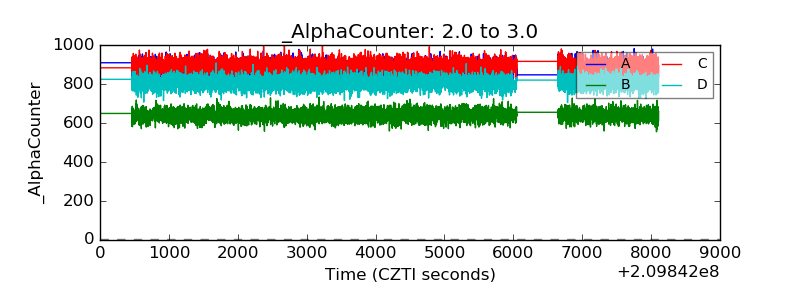 |
| _CPM_Rate | 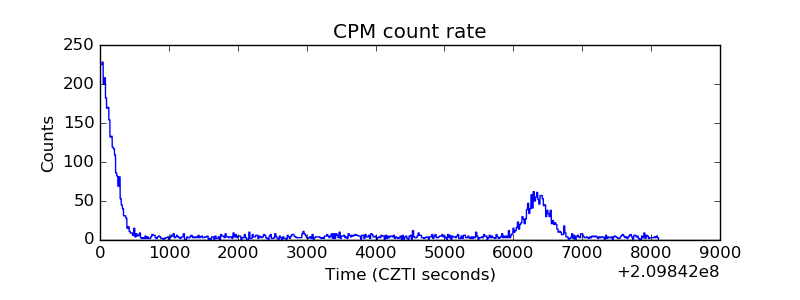 |
| CZT Counter | 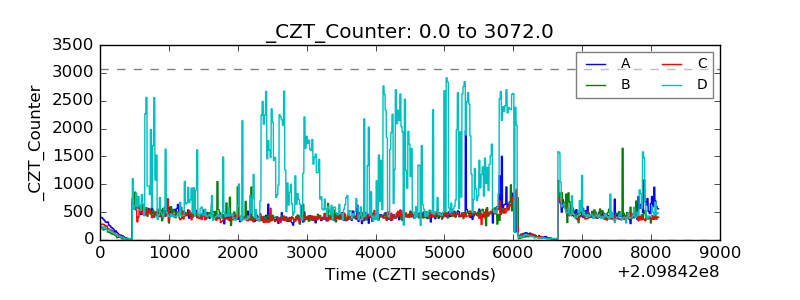 |
| +2.5 Volts monitor |  |
| +5 Volts monitor |  |
| _ROLL_ROT | 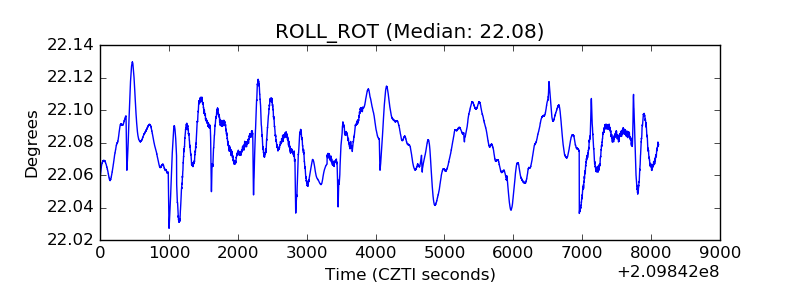 |
| _Roll_DEC | 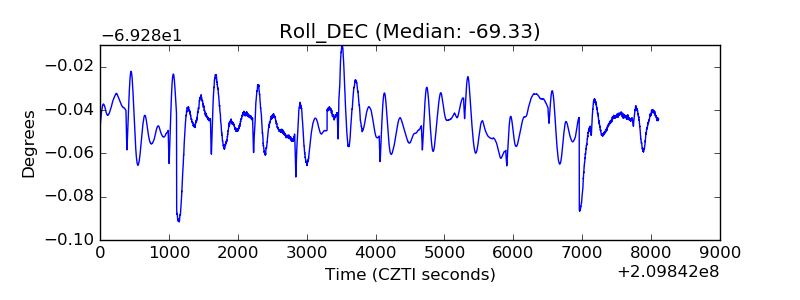 |
| _Roll_RA | 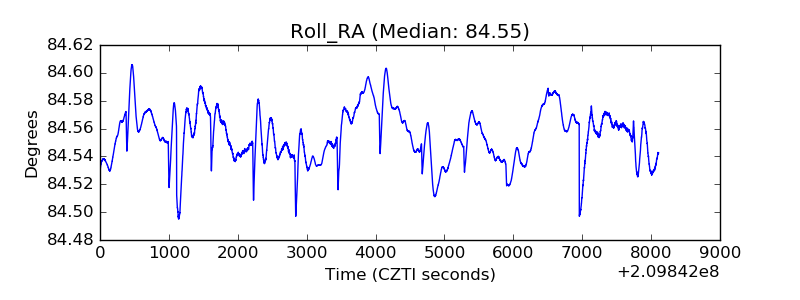 |
| Veto Counter | 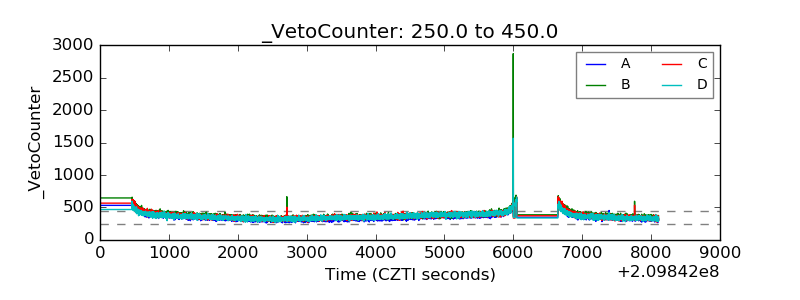 |