| Param | Original file | Final file |
|---|---|---|
| Filename | modeM0/AS1G05_118T01_9000000622_04925cztM0_level2.evt | modeM0/AS1G05_118T01_9000000622_04925cztM0_level2_quad_clean.evt |
| Size (bytes) | 599,901,120 | 85,570,560 |
| Size | 572.1 MB | 81.6 MB |
| Events in quadrant A | 4,525,368 | 526,944 |
| Events in quadrant B | 3,450,287 | 534,386 |
| Events in quadrant C | 3,186,015 | 530,347 |
| Events in quadrant D | 6,505,773 | 485,679 |
| Mode M0 | |||
|---|---|---|---|
| Quadrant | BADHDUFLAG | Total packets | Discarded packets |
| A | 0 | 18547 | 3 |
| B | 0 | 15450 | 2 |
| C | 0 | 15000 | 2 |
| D | 0 | 24652 | 2 |
| Mode M9 | |||
|---|---|---|---|
| Quadrant | BADHDUFLAG | Total packets | Discarded packets |
| A | 0 | 1 | 0 |
| B | 0 | 1 | 0 |
| C | 0 | 1 | 0 |
| D | 0 | 1 | 0 |
| Mode SS | |||
|---|---|---|---|
| Quadrant | BADHDUFLAG | Total packets | Discarded packets |
| A | 0 | 152 | 0 |
| B | 0 | 152 | 0 |
| C | 0 | 152 | 0 |
| D | 0 | 152 | 0 |
| Quadrant | Total seconds | Saturated seconds | Saturation percentage |
|---|---|---|---|
| A | 7371 | 483 | 6.552707% |
| B | 7371 | 74 | 1.003934% |
| C | 7371 | 34 | 0.461267% |
| D | 7371 | 993 | 13.471713% |
Noise dominated data is calculated using 1-second bins in cleaned event files. If a bin has >2000 counts, and if more than 50% of those come from <1% of pixels, then it is considered to be noise-dominated and hence unusable.
| Quadrant | # 1 sec bins | Bins with >0 counts | Bins with >2000 counts | High rate bins dominated by noise | Noise dominated (total time) | Noise dominated (detector-on time) | Marked lightcurve |
|---|---|---|---|---|---|---|---|
| A | 7596 | 7371 | 268 | 268 | 3.53% | 3.64% | 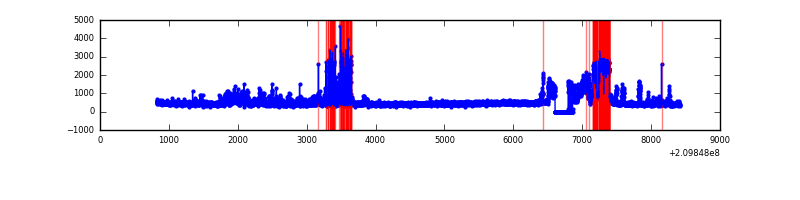 |
| B | 7596 | 7374 | 4 | 4 | 0.05% | 0.05% | 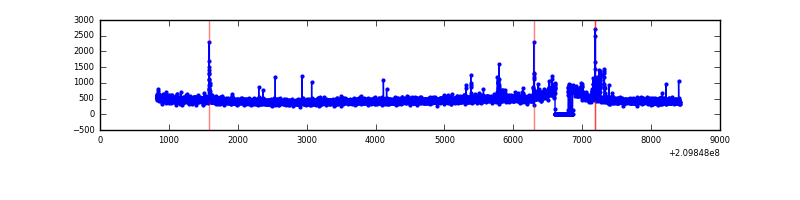 |
| C | 7596 | 7373 | 0 | 0 | 0.00% | 0.00% | 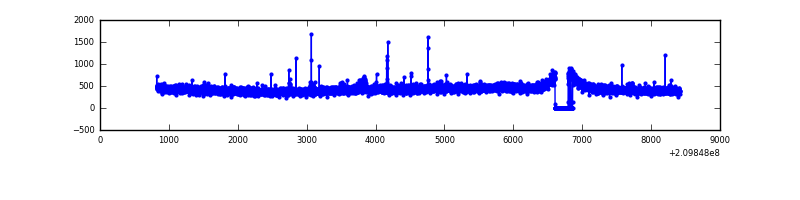 |
| D | 7596 | 7374 | 926 | 926 | 12.19% | 12.56% | 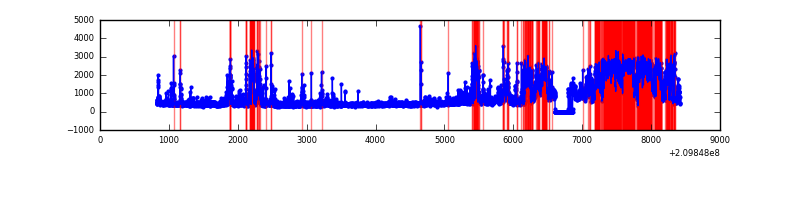 |
Top three noisy pixels from each quadrant. If the there are fewer than three noisy pixels in the level2.evt file, extra rows are filled as -1
| Pixel properties | Quadrant properties | ||||||
|---|---|---|---|---|---|---|---|
| Quadrant | DetID | PixID | Counts | Sigma | Mean | Median | Sigma |
| A | 0 | 31 | 1388848 | 8448.21 | 807 | 787 | 164.3 |
| A | 15 | 31 | 14558 | 83.82 | 807 | 787 | 164.3 |
| A | 12 | 194 | 8141 | 44.76 | 807 | 787 | 164.3 |
| B | 8 | 3 | 53122 | 327.43 | 837 | 816 | 159.7 |
| B | 0 | 219 | 41486 | 254.59 | 837 | 816 | 159.7 |
| B | 0 | 183 | 22917 | 138.35 | 837 | 816 | 159.7 |
| C | 1 | 16 | 28215 | 148.14 | 801 | 805 | 185.0 |
| C | 9 | 247 | 15200 | 77.8 | 801 | 805 | 185.0 |
| C | 13 | 61 | 6617 | 31.41 | 801 | 805 | 185.0 |
| D | 1 | 7 | 2506974 | 13267.07 | 769 | 745 | 188.9 |
| D | 2 | 33 | 551275 | 2914.31 | 769 | 745 | 188.9 |
| D | 2 | 136 | 149086 | 785.26 | 769 | 745 | 188.9 |
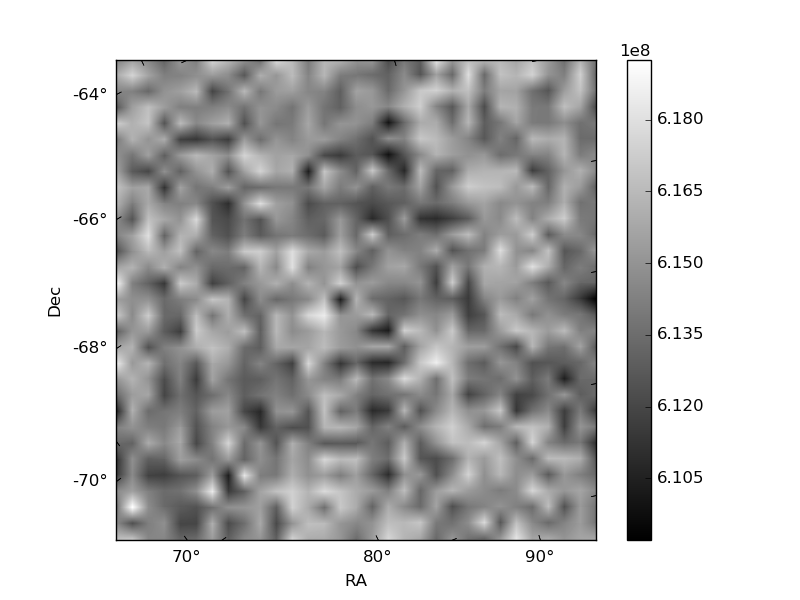
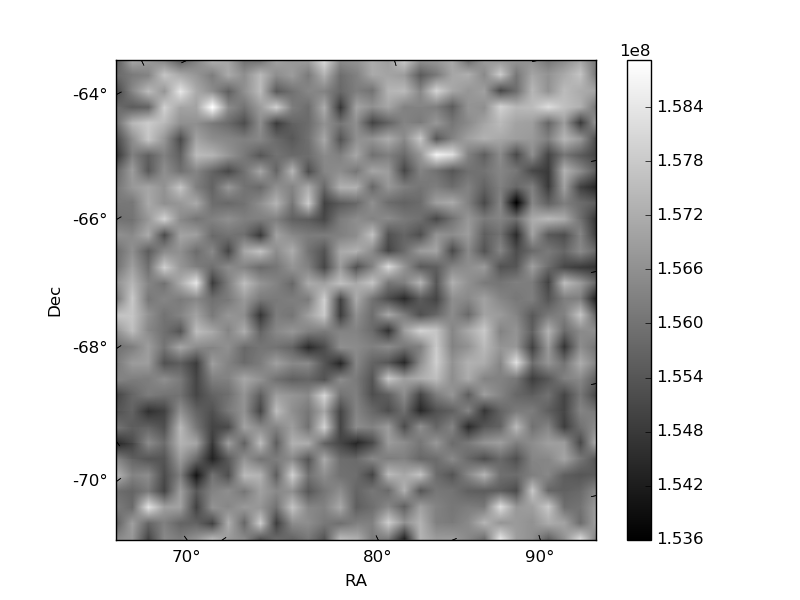
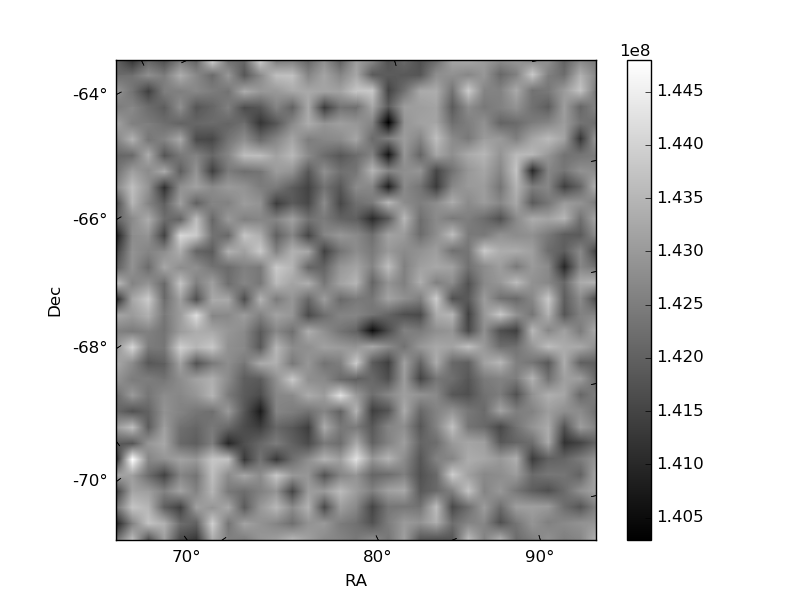
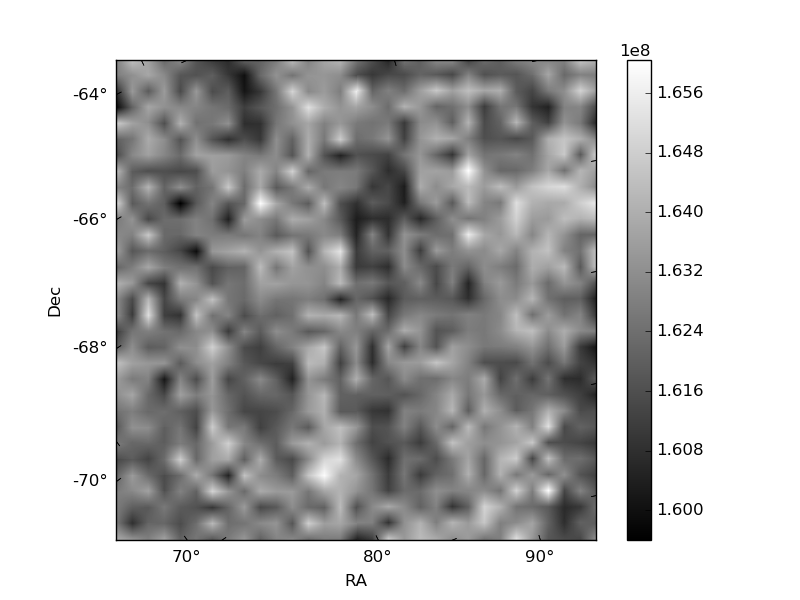
Histogram calculated using DETX and DETY for each event in the final _common_clean file
| Quadrant A | 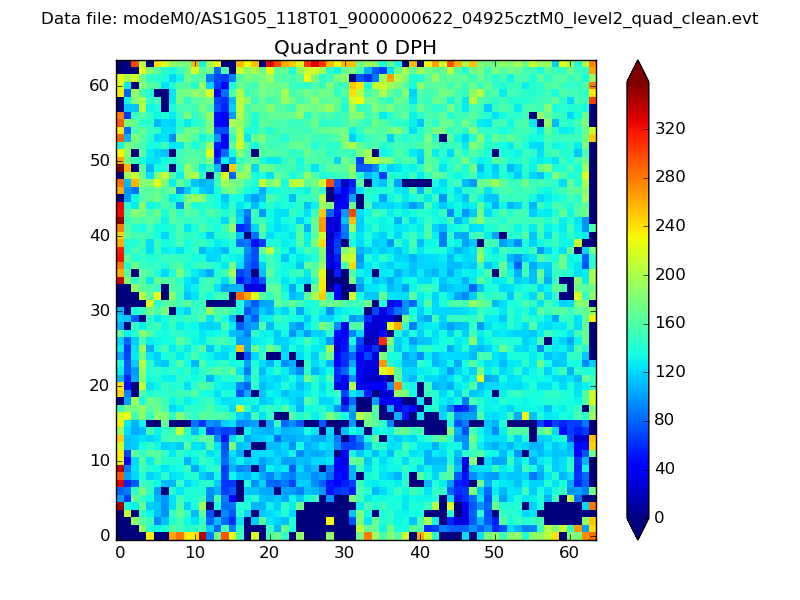 |
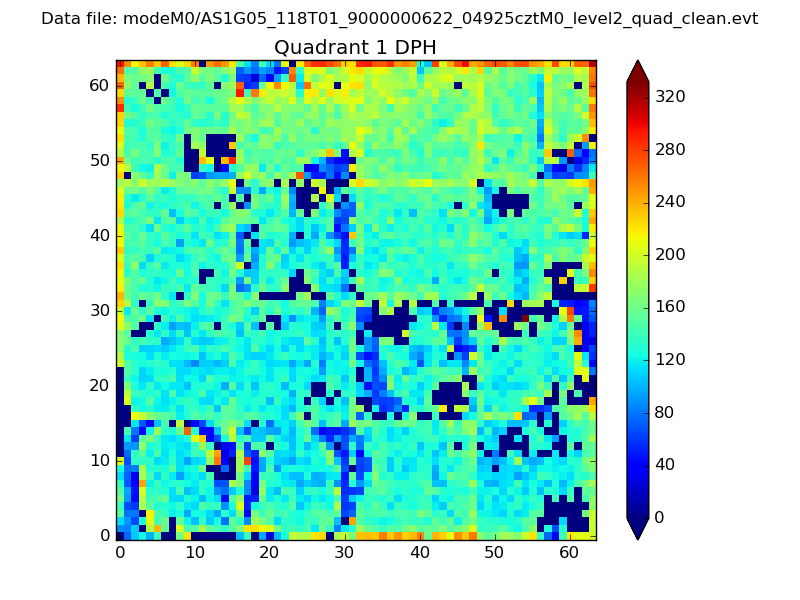 |
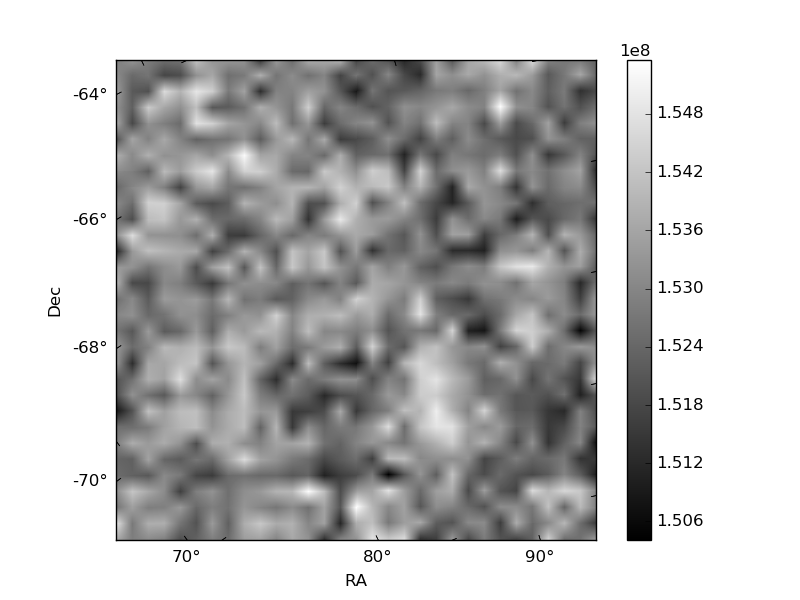
Quadrant B |
|---|---|---|---|
| Quadrant D | 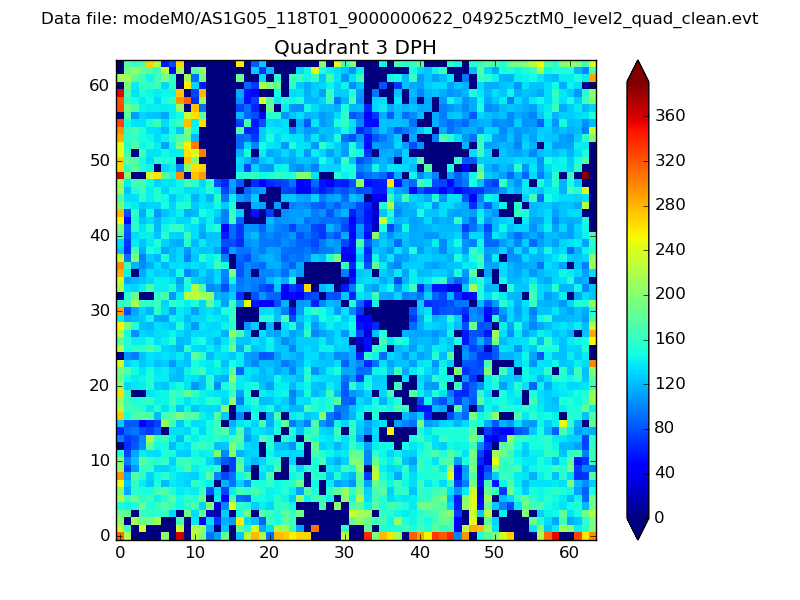 |
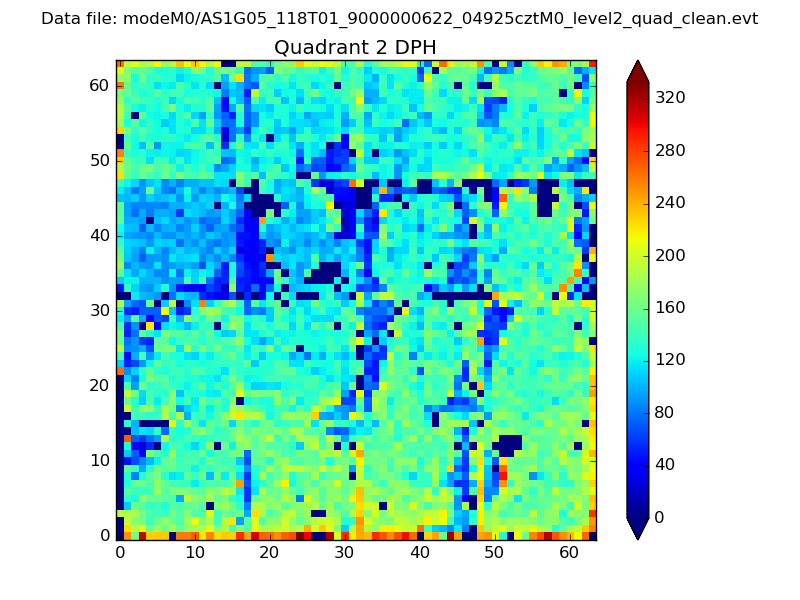 |
Quadrant C |
| Plot type | Count rate plots | Images |
|---|---|---|
| Comparison with Poisson distribution Blue bars denote a histogram of data divided into 1 sec bins. Red curve is a Poisson curve with rate = median count rate of data. |
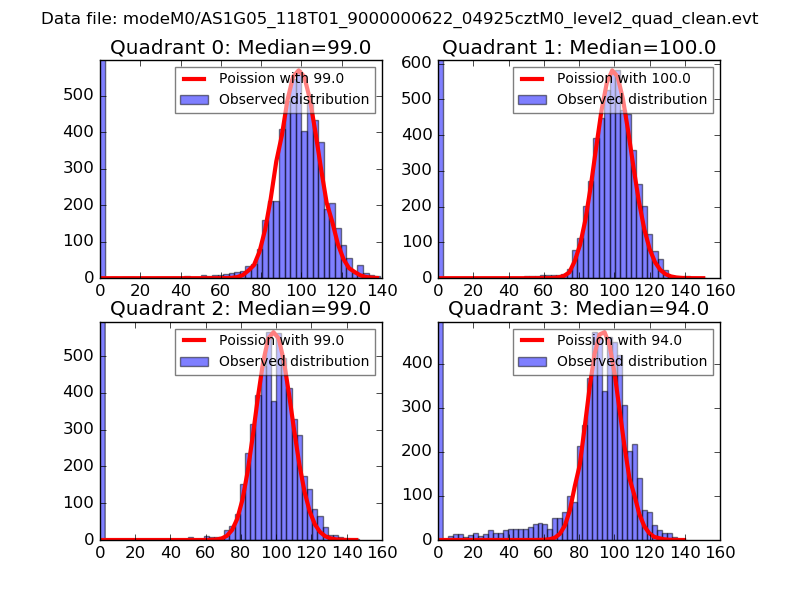 |
 |
| Quadrant-wise count rates Data is divided into 100 sec bins |
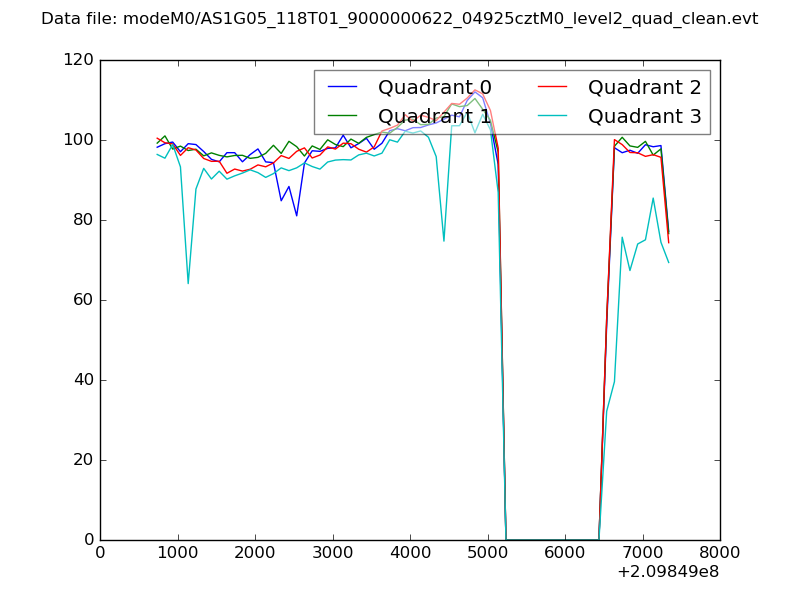 |
|
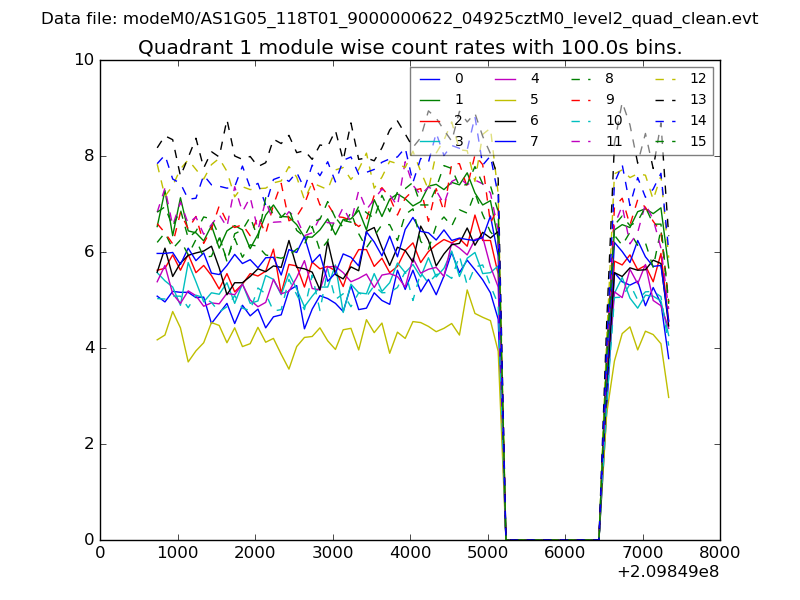
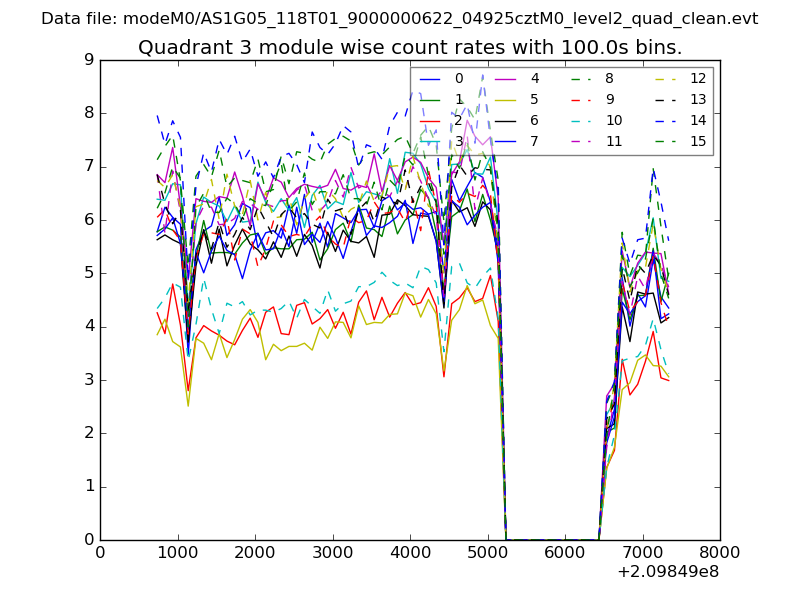
| Module-wise count rates for Quadrant A Data is divided into 100 sec bins |
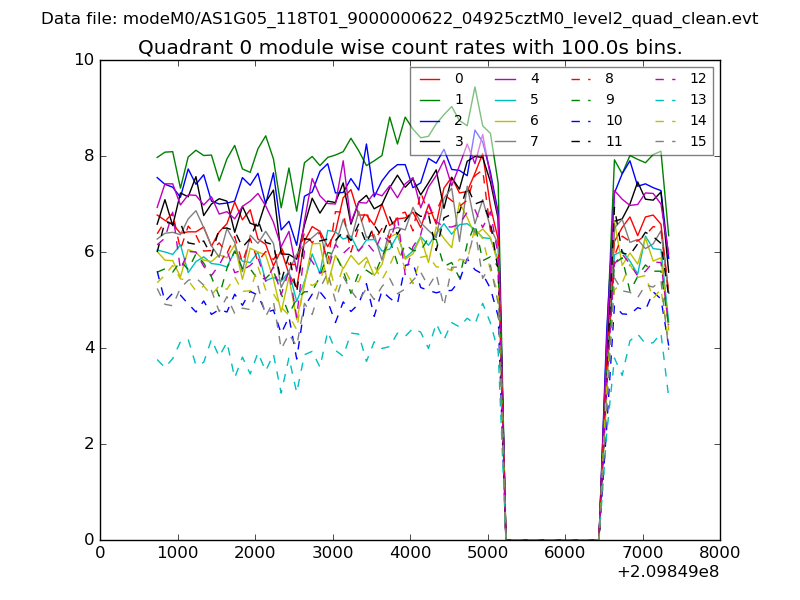 |
 |
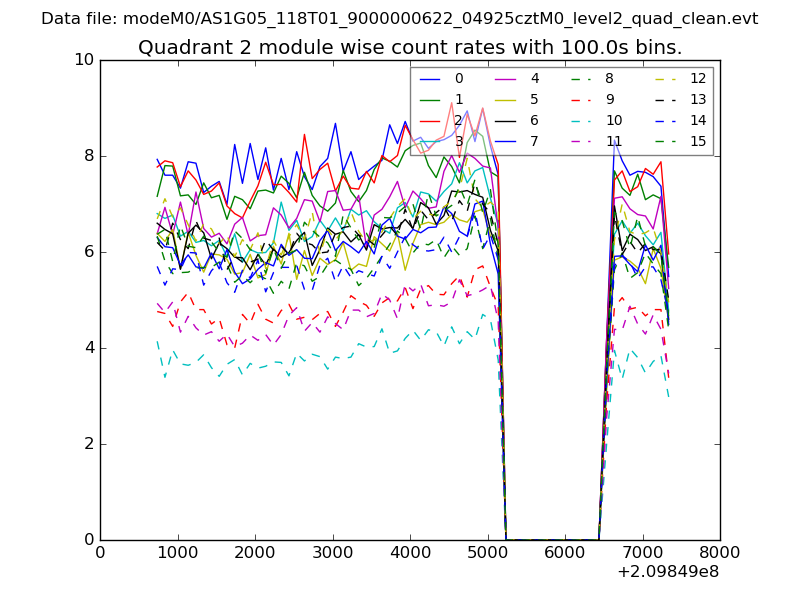
| Module-wise count rates for Quadrant B Data is divided into 100 sec bins |
 |
 |
| Module-wise count rates for Quadrant C Data is divided into 100 sec bins |
 |
 |
| Module-wise count rates for Quadrant D Data is divided into 100 sec bins |
 |
 |
| Parameter | Plot |
|---|---|
| CZT HV Monitor | 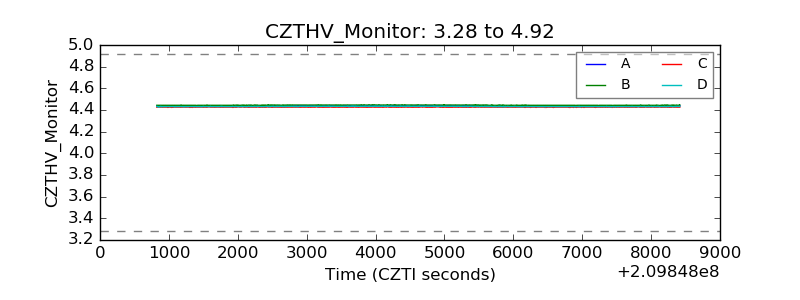 |
| D_VDD | 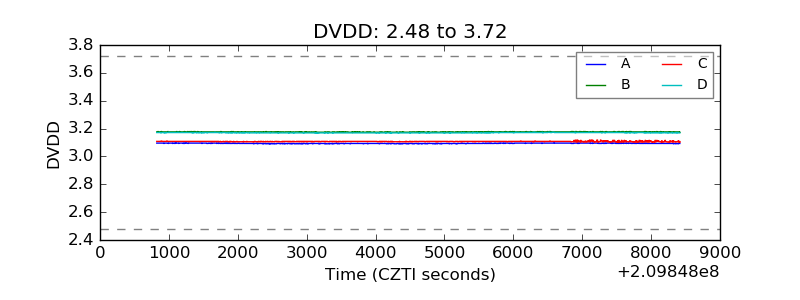 |
| Temperature 1 | 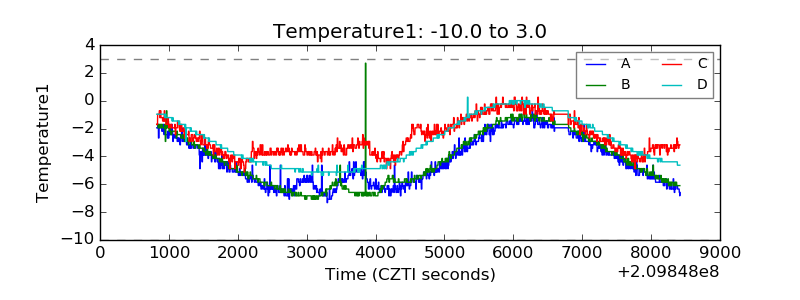 |
| Veto HV Monitor | 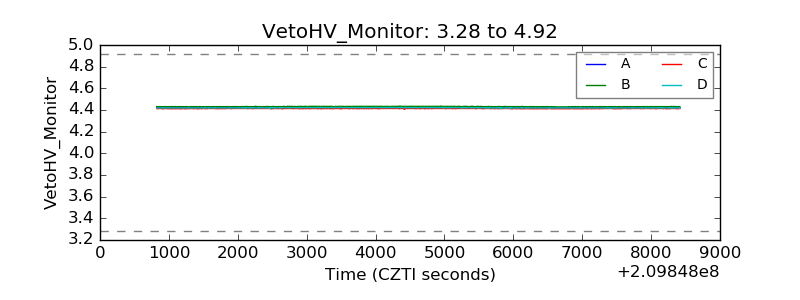 |
| Veto LLD | 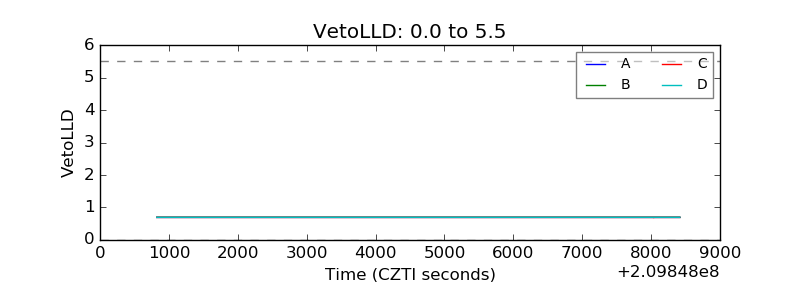 |
| Alpha Counter | 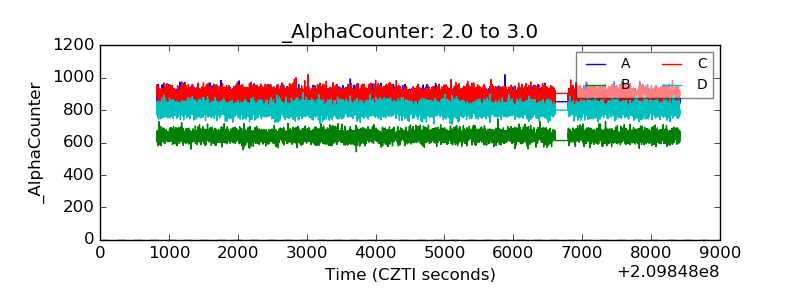 |
| _CPM_Rate | 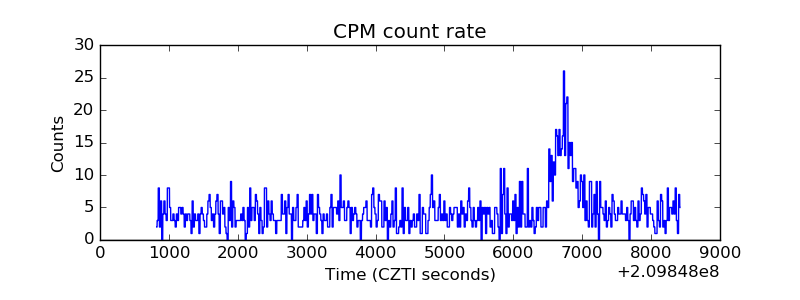 |
| CZT Counter | 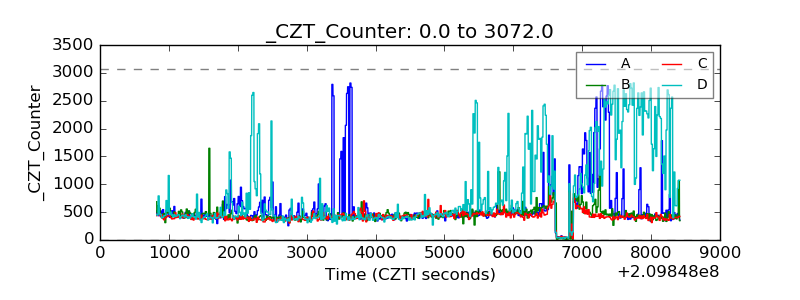 |
| +2.5 Volts monitor |  |
| +5 Volts monitor |  |
| _ROLL_ROT | 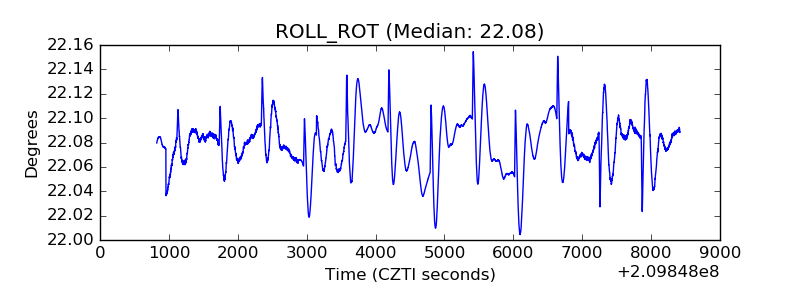 |
| _Roll_DEC | 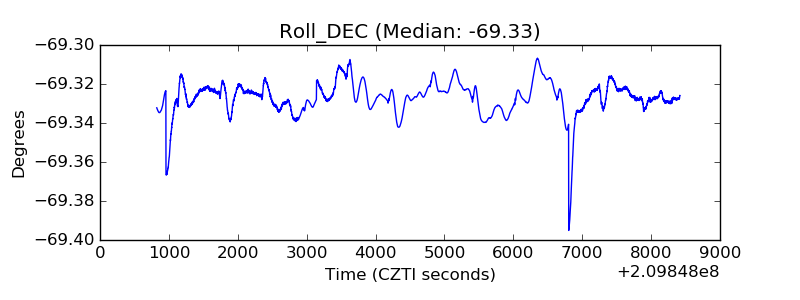 |
| _Roll_RA | 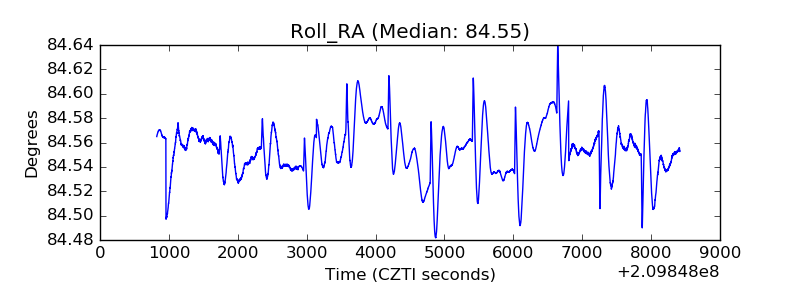 |
| Veto Counter | 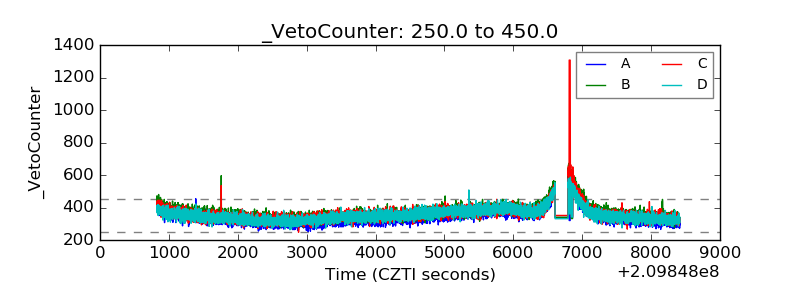 |