| Param | Original file | Final file |
|---|---|---|
| Filename | modeM0/AS1G05_118T01_9000000622_04926cztM0_level2.evt | modeM0/AS1G05_118T01_9000000622_04926cztM0_level2_quad_clean.evt |
| Size (bytes) | 828,567,360 | 91,653,120 |
| Size | 790.2 MB | 87.4 MB |
| Events in quadrant A | 5,541,061 | 568,157 |
| Events in quadrant B | 4,307,011 | 582,292 |
| Events in quadrant C | 6,070,109 | 552,991 |
| Events in quadrant D | 8,645,376 | 526,019 |
| Mode M0 | |||
|---|---|---|---|
| Quadrant | BADHDUFLAG | Total packets | Discarded packets |
| A | 0 | 22143 | 4 |
| B | 0 | 18452 | 3 |
| C | 0 | 23632 | 3 |
| D | 0 | 31192 | 3 |
| Mode M9 | |||
|---|---|---|---|
| Quadrant | BADHDUFLAG | Total packets | Discarded packets |
| A | 0 | 2 | 0 |
| B | 0 | 2 | 0 |
| C | 0 | 2 | 0 |
| D | 0 | 2 | 0 |
| Mode SS | |||
|---|---|---|---|
| Quadrant | BADHDUFLAG | Total packets | Discarded packets |
| A | 0 | 162 | 0 |
| B | 0 | 162 | 0 |
| C | 0 | 162 | 0 |
| D | 0 | 162 | 0 |
| Quadrant | Total seconds | Saturated seconds | Saturation percentage |
|---|---|---|---|
| A | 7838 | 624 | 7.961215% |
| B | 7838 | 266 | 3.393723% |
| C | 7838 | 690 | 8.803266% |
| D | 7839 | 1586 | 20.232172% |
Noise dominated data is calculated using 1-second bins in cleaned event files. If a bin has >2000 counts, and if more than 50% of those come from <1% of pixels, then it is considered to be noise-dominated and hence unusable.
| Quadrant | # 1 sec bins | Bins with >0 counts | Bins with >2000 counts | High rate bins dominated by noise | Noise dominated (total time) | Noise dominated (detector-on time) | Marked lightcurve |
|---|---|---|---|---|---|---|---|
| A | 8033 | 7840 | 372 | 372 | 4.63% | 4.74% | 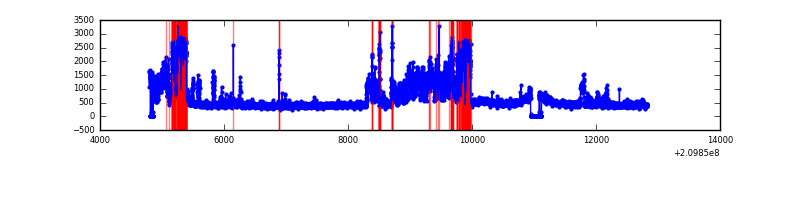 |
| B | 8033 | 7842 | 108 | 108 | 1.34% | 1.38% | 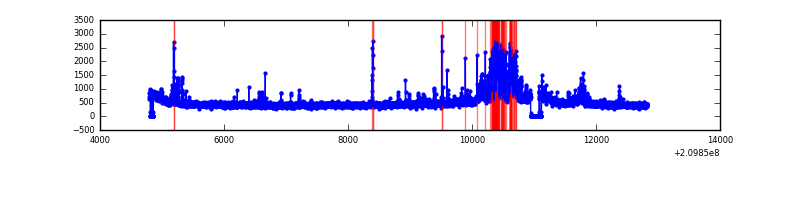 |
| C | 8033 | 7840 | 598 | 598 | 7.44% | 7.63% | 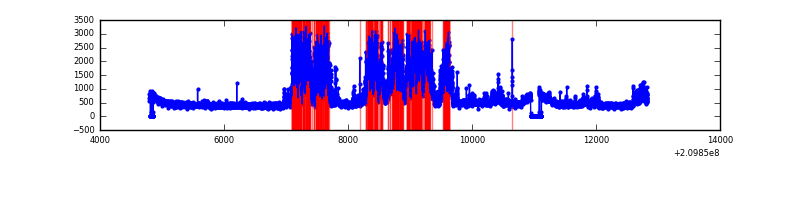 |
| D | 8034 | 7842 | 1441 | 1441 | 17.94% | 18.38% | 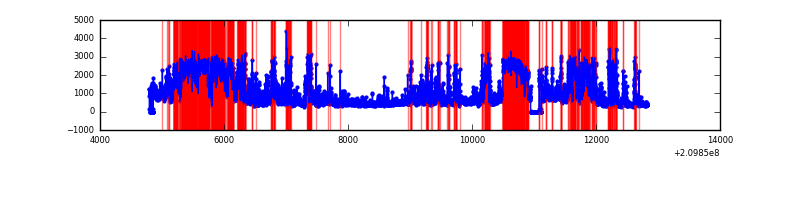 |
Top three noisy pixels from each quadrant. If the there are fewer than three noisy pixels in the level2.evt file, extra rows are filled as -1
| Pixel properties | Quadrant properties | ||||||
|---|---|---|---|---|---|---|---|
| Quadrant | DetID | PixID | Counts | Sigma | Mean | Median | Sigma |
| A | 0 | 31 | 2196742 | 12418.4 | 862 | 841 | 176.8 |
| A | 15 | 31 | 16117 | 86.39 | 862 | 841 | 176.8 |
| A | 12 | 194 | 8734 | 44.64 | 862 | 841 | 176.8 |
| B | 8 | 3 | 378733 | 2211.13 | 891 | 867 | 170.9 |
| B | 10 | 16 | 315021 | 1838.31 | 891 | 867 | 170.9 |
| B | 15 | 54 | 45145 | 259.1 | 891 | 867 | 170.9 |
| C | 9 | 247 | 2715496 | 13967.1 | 844 | 848 | 194.4 |
| C | 1 | 16 | 20649 | 101.88 | 844 | 848 | 194.4 |
| C | 8 | 128 | 16795 | 82.05 | 844 | 848 | 194.4 |
| D | 1 | 7 | 4080313 | 20741.23 | 798 | 770 | 196.7 |
| D | 2 | 33 | 728060 | 3697.69 | 798 | 770 | 196.7 |
| D | 2 | 136 | 176552 | 893.71 | 798 | 770 | 196.7 |
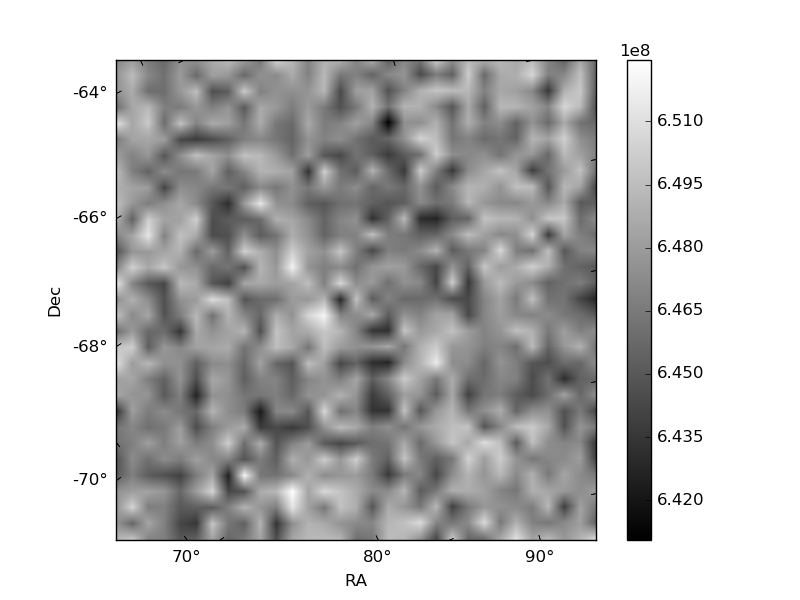
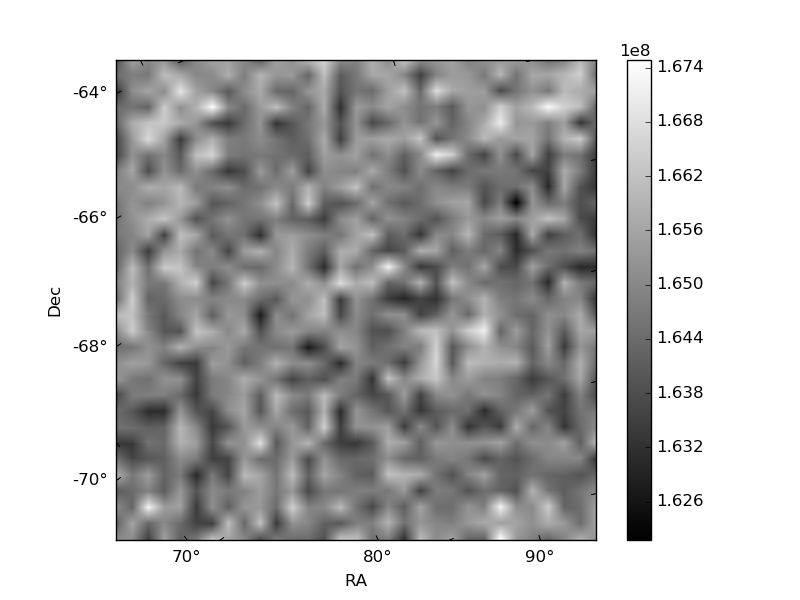
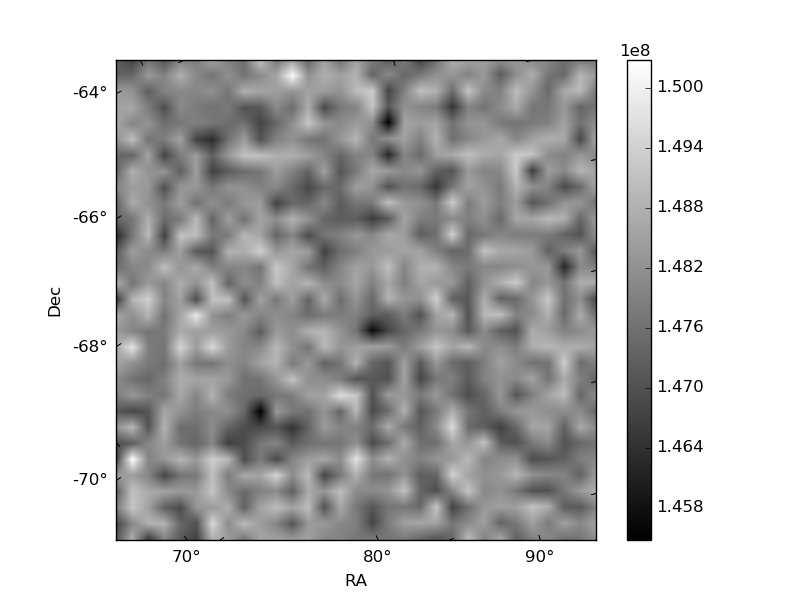
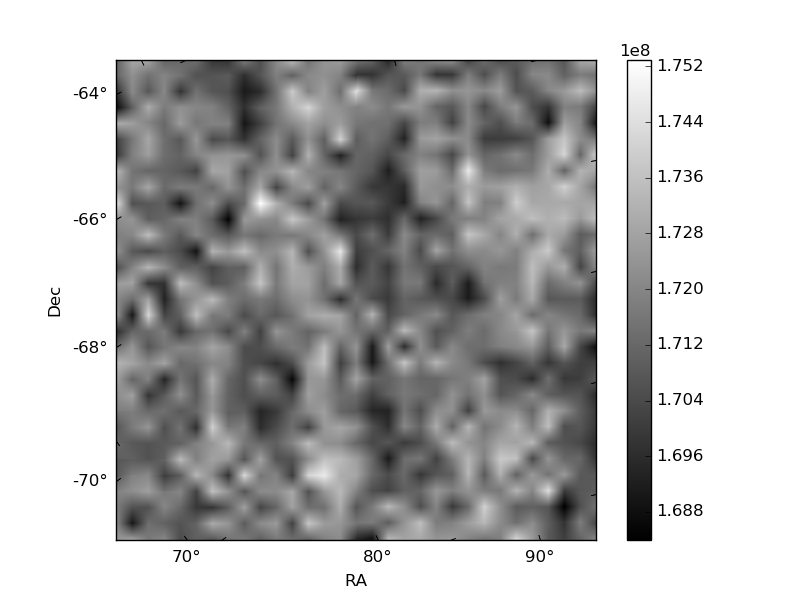
Histogram calculated using DETX and DETY for each event in the final _common_clean file
| Quadrant A | 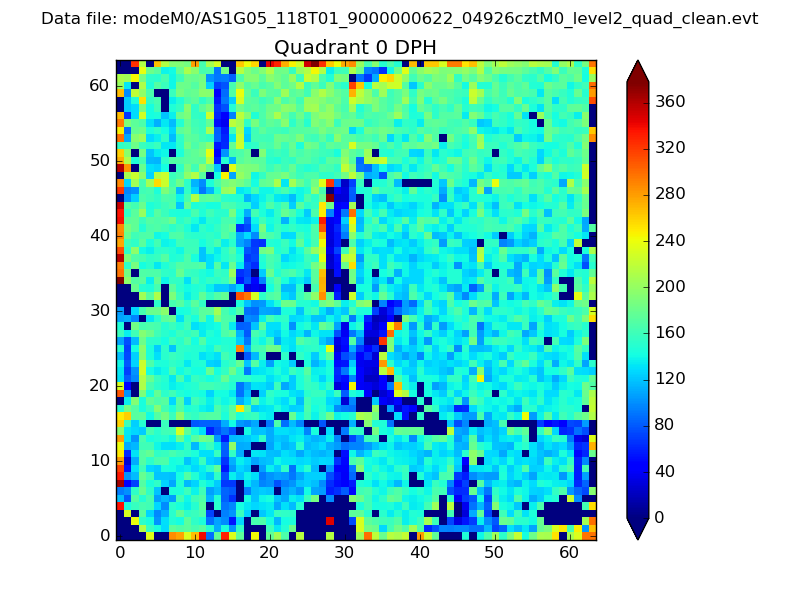 |
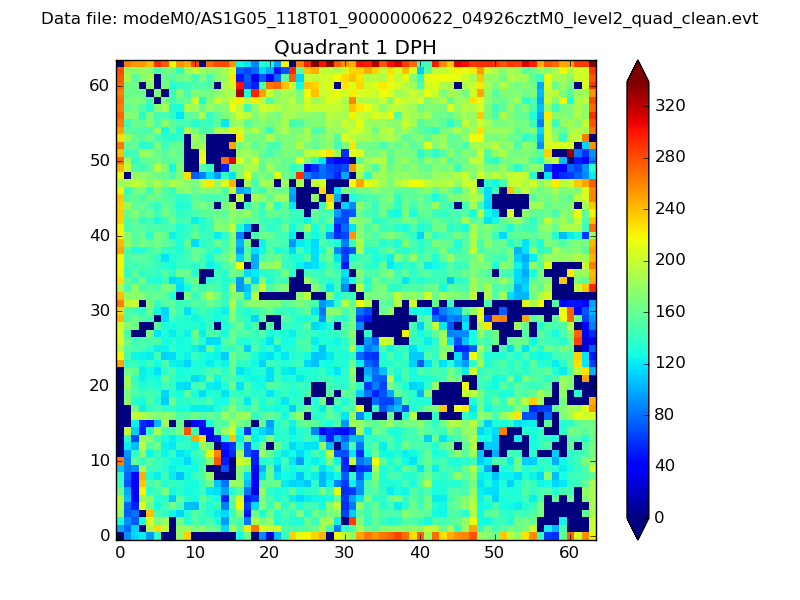 |
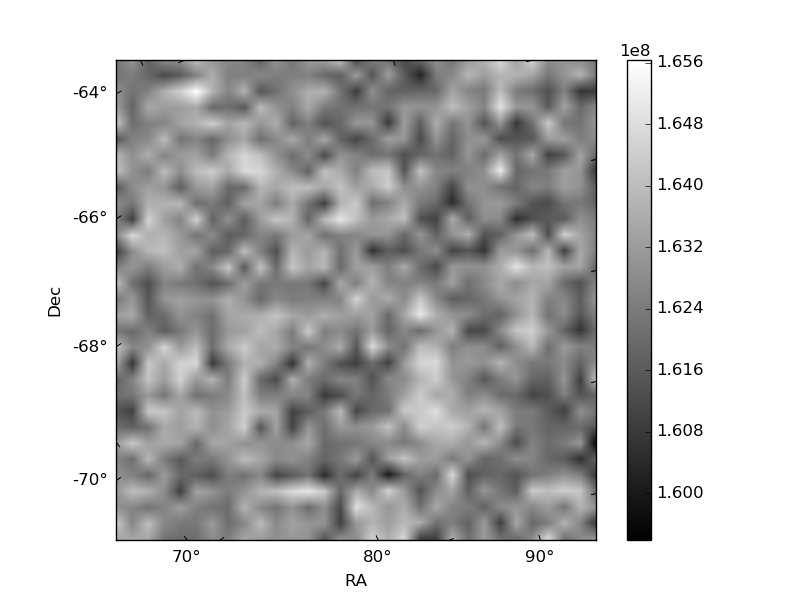
Quadrant B |
|---|---|---|---|
| Quadrant D | 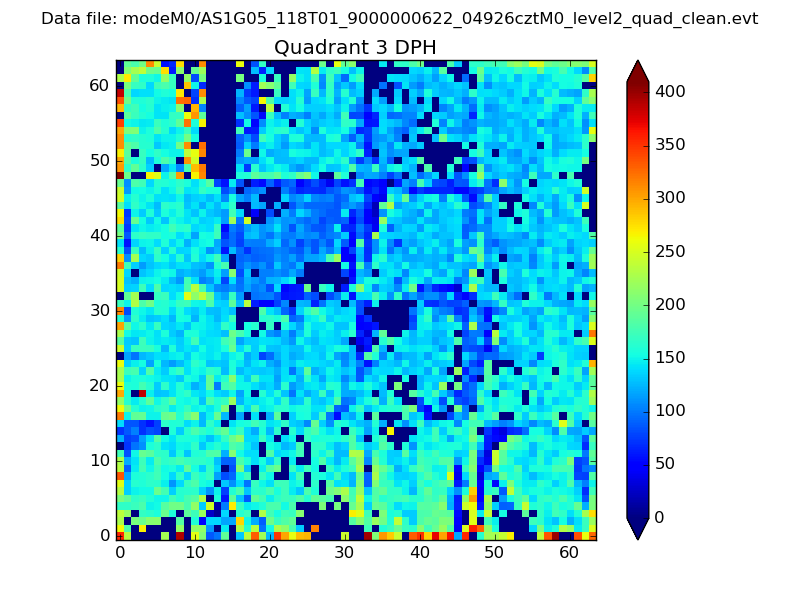 |
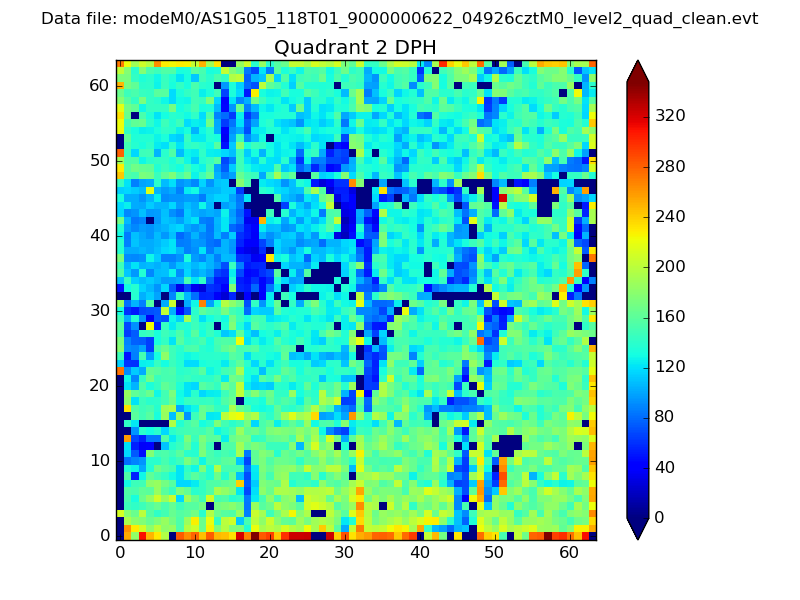 |
Quadrant C |
| Plot type | Count rate plots | Images |
|---|---|---|
| Comparison with Poisson distribution Blue bars denote a histogram of data divided into 1 sec bins. Red curve is a Poisson curve with rate = median count rate of data. |
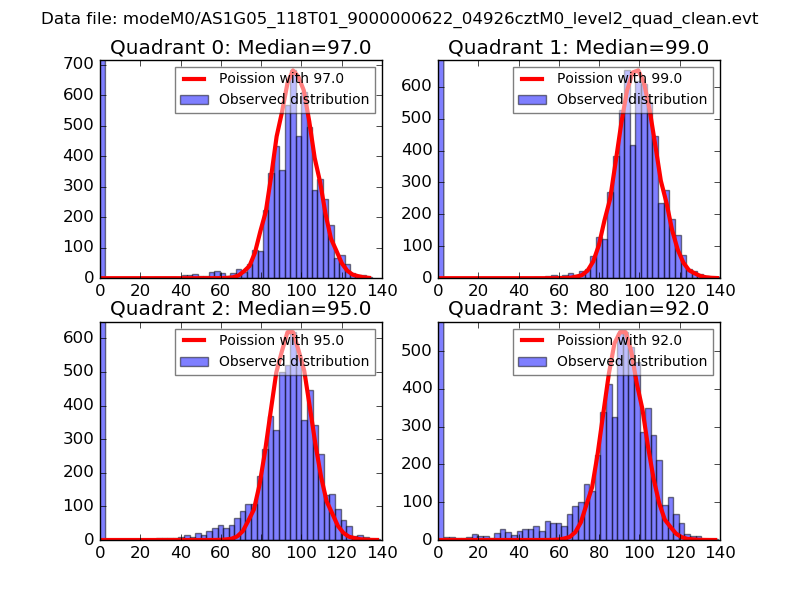 |
 |
| Quadrant-wise count rates Data is divided into 100 sec bins |
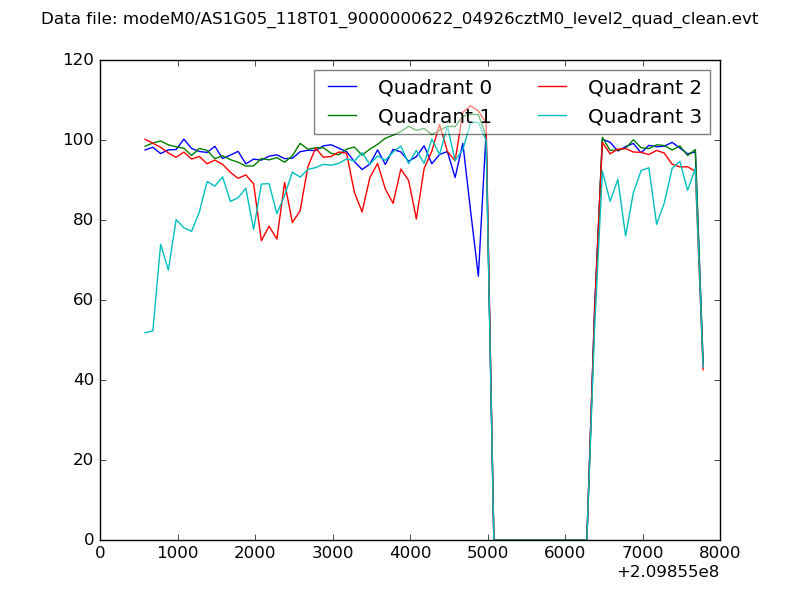 |
|
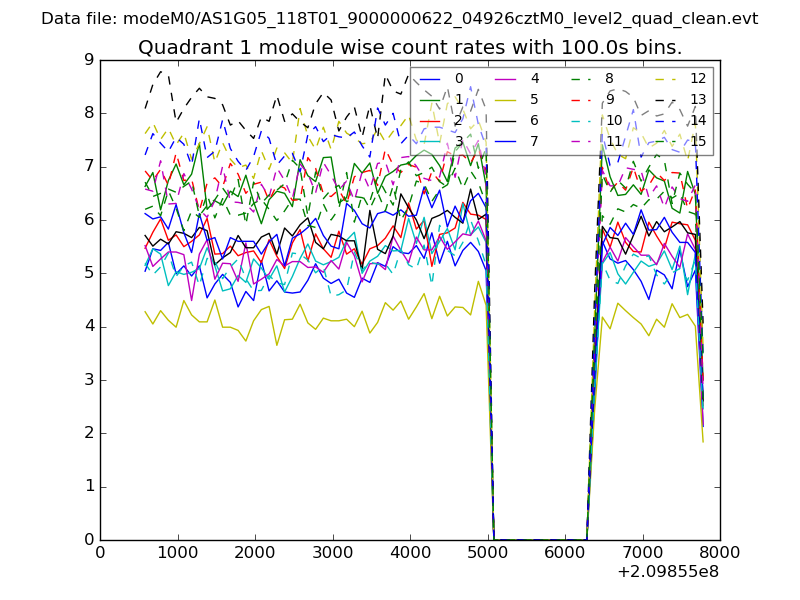
| Module-wise count rates for Quadrant A Data is divided into 100 sec bins |
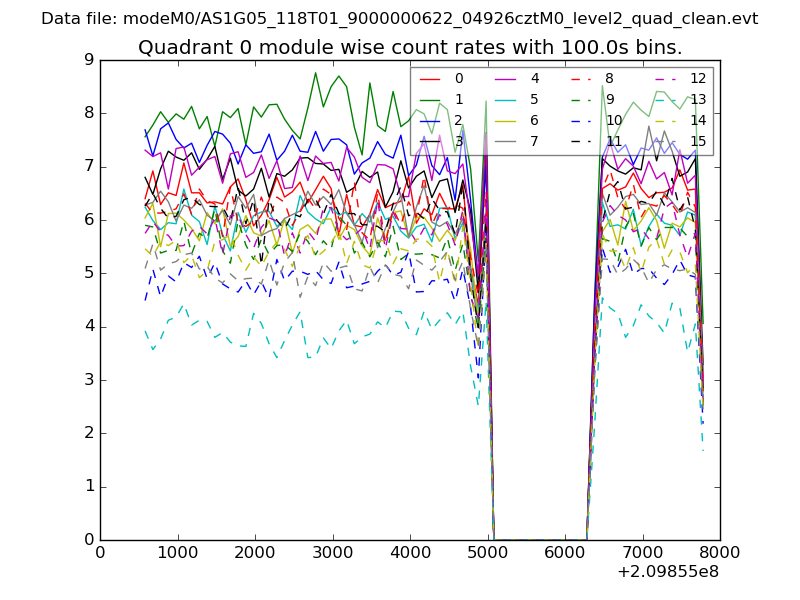 |
 |
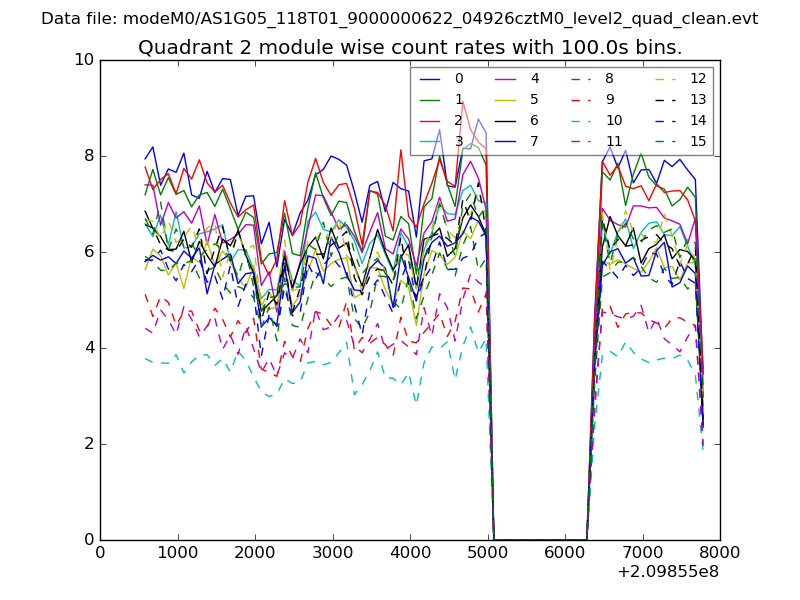
| Module-wise count rates for Quadrant B Data is divided into 100 sec bins |
 |
 |
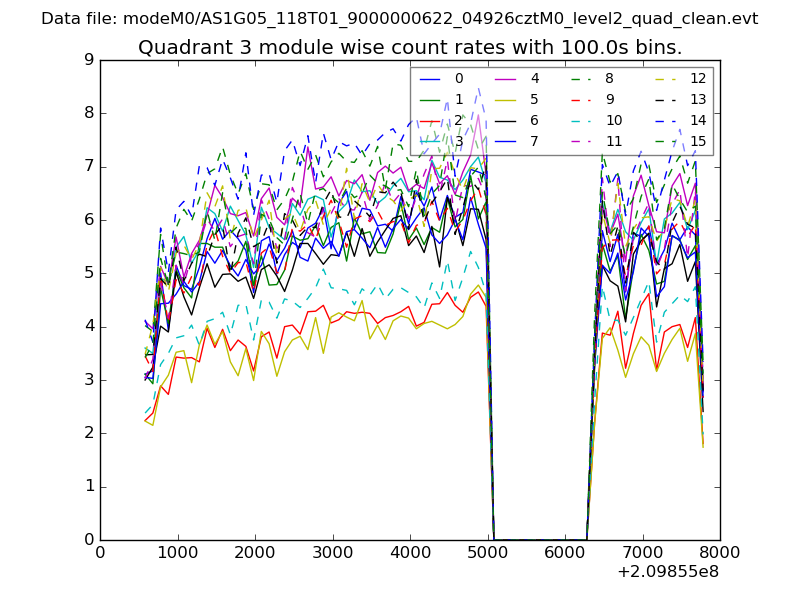
| Module-wise count rates for Quadrant C Data is divided into 100 sec bins |
 |
 |
| Module-wise count rates for Quadrant D Data is divided into 100 sec bins |
 |
 |
| Parameter | Plot |
|---|---|
| CZT HV Monitor | 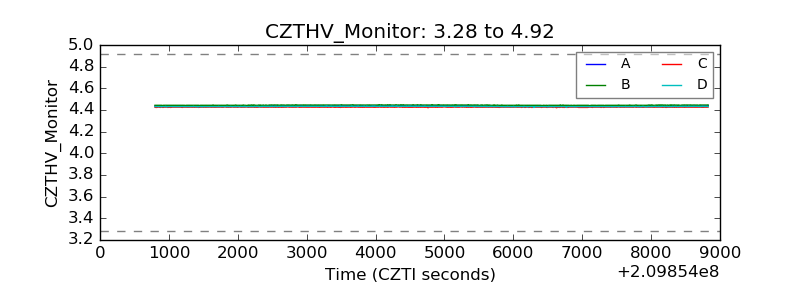 |
| D_VDD | 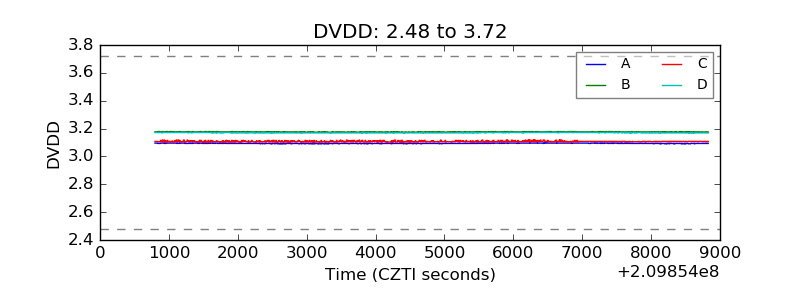 |
| Temperature 1 | 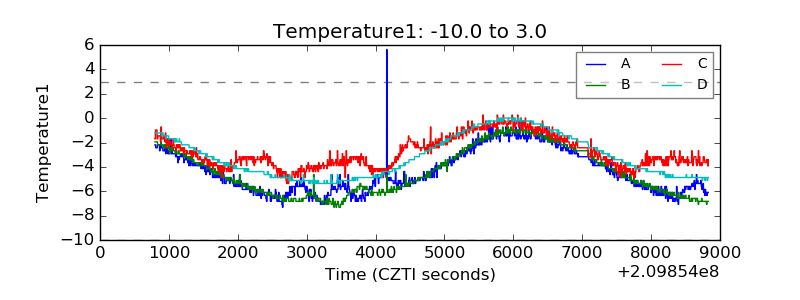 |
| Veto HV Monitor | 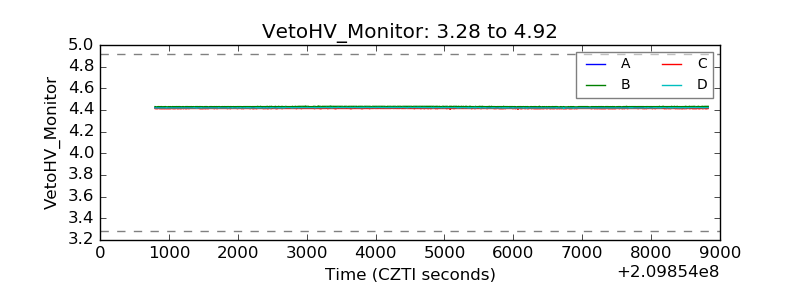 |
| Veto LLD | 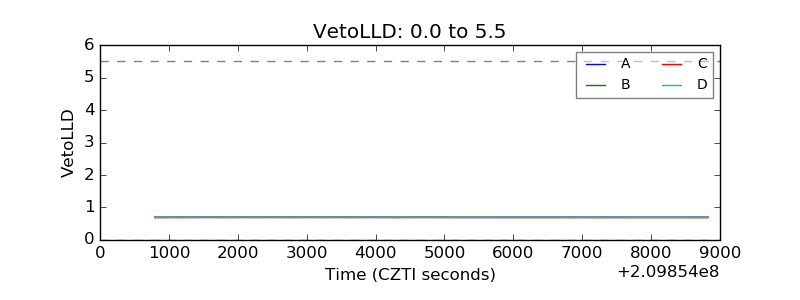 |
| Alpha Counter | 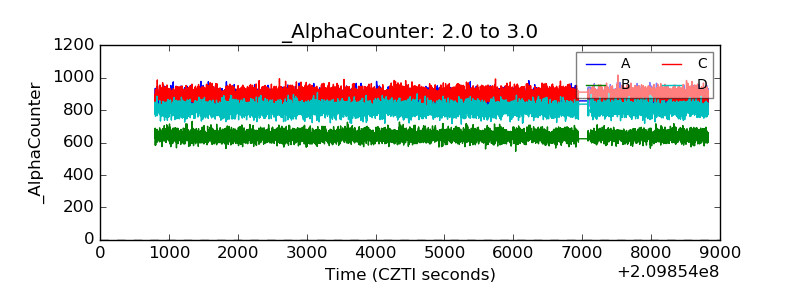 |
| _CPM_Rate | 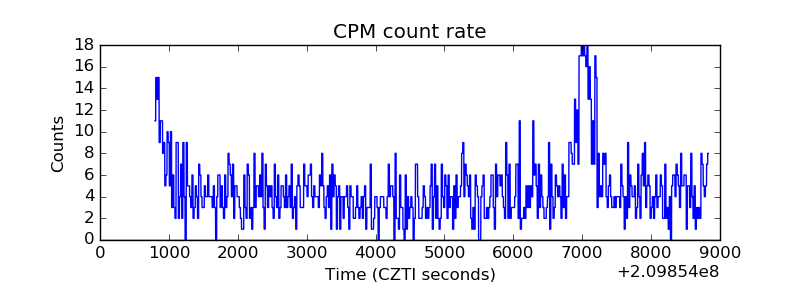 |
| CZT Counter | 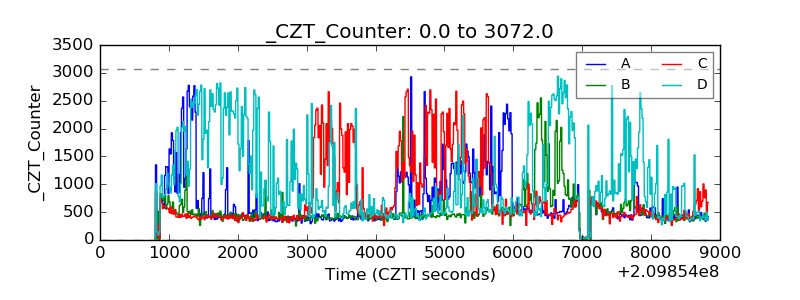 |
| +2.5 Volts monitor |  |
| +5 Volts monitor | 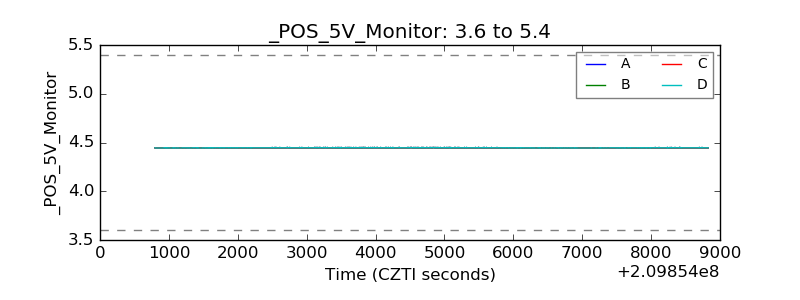 |
| _ROLL_ROT | 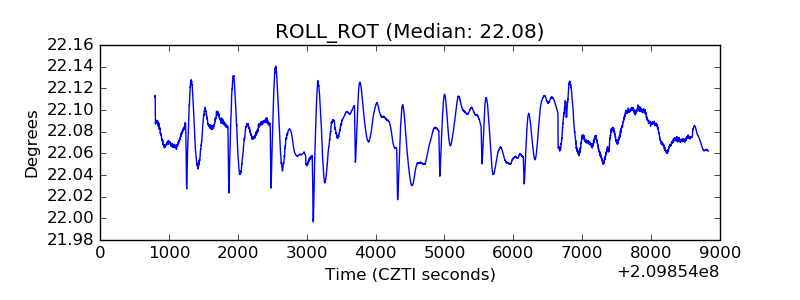 |
| _Roll_DEC | 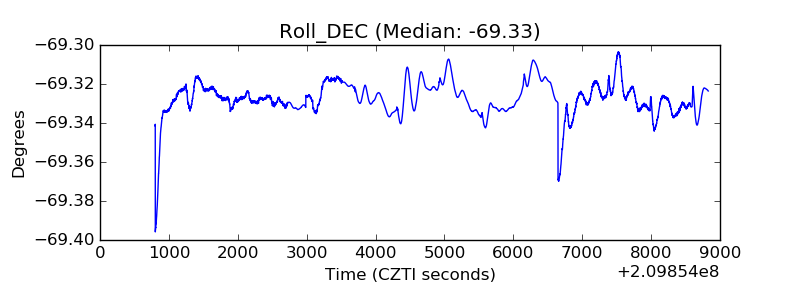 |
| _Roll_RA | 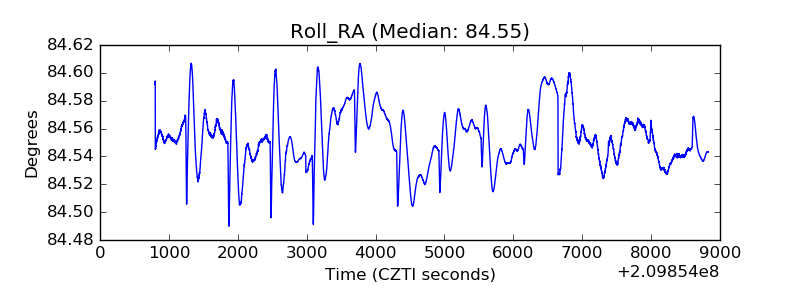 |
| Veto Counter |  |