| Param | Original file | Final file |
|---|---|---|
| Filename | modeM0/AS1G05_118T01_9000000622_04927cztM0_level2.evt | modeM0/AS1G05_118T01_9000000622_04927cztM0_level2_quad_clean.evt |
| Size (bytes) | 577,848,960 | 95,028,480 |
| Size | 551.1 MB | 90.6 MB |
| Events in quadrant A | 3,508,163 | 596,088 |
| Events in quadrant B | 3,779,624 | 600,015 |
| Events in quadrant C | 3,553,181 | 596,265 |
| Events in quadrant D | 6,143,813 | 556,458 |
| Mode M0 | |||
|---|---|---|---|
| Quadrant | BADHDUFLAG | Total packets | Discarded packets |
| A | 0 | 15865 | 7 |
| B | 0 | 16586 | 2 |
| C | 0 | 16032 | 6 |
| D | 0 | 23699 | 8 |
| Mode M9 | |||
|---|---|---|---|
| Quadrant | BADHDUFLAG | Total packets | Discarded packets |
| A | 0 | 4 | 0 |
| B | 0 | 4 | 0 |
| C | 0 | 4 | 0 |
| D | 0 | 4 | 0 |
| Mode SS | |||
|---|---|---|---|
| Quadrant | BADHDUFLAG | Total packets | Discarded packets |
| A | 0 | 154 | 0 |
| B | 0 | 154 | 0 |
| C | 0 | 154 | 0 |
| D | 0 | 154 | 0 |
| Quadrant | Total seconds | Saturated seconds | Saturation percentage |
|---|---|---|---|
| A | 7598 | 87 | 1.145038% |
| B | 7600 | 86 | 1.131579% |
| C | 7598 | 52 | 0.684391% |
| D | 7600 | 675 | 8.881579% |
Noise dominated data is calculated using 1-second bins in cleaned event files. If a bin has >2000 counts, and if more than 50% of those come from <1% of pixels, then it is considered to be noise-dominated and hence unusable.
| Quadrant | # 1 sec bins | Bins with >0 counts | Bins with >2000 counts | High rate bins dominated by noise | Noise dominated (total time) | Noise dominated (detector-on time) | Marked lightcurve |
|---|---|---|---|---|---|---|---|
| A | 8005 | 7601 | 0 | 0 | 0.00% | 0.00% | 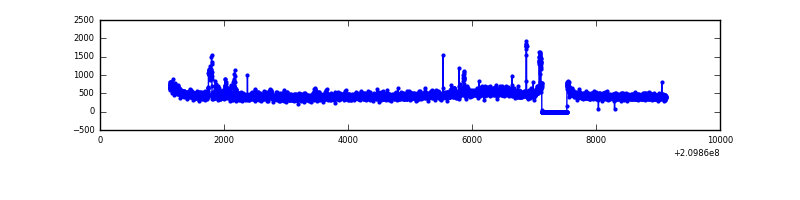 |
| B | 8005 | 7600 | 8 | 8 | 0.10% | 0.11% |  |
| C | 8005 | 7600 | 6 | 6 | 0.07% | 0.08% |  |
| D | 8006 | 7601 | 512 | 512 | 6.40% | 6.74% | 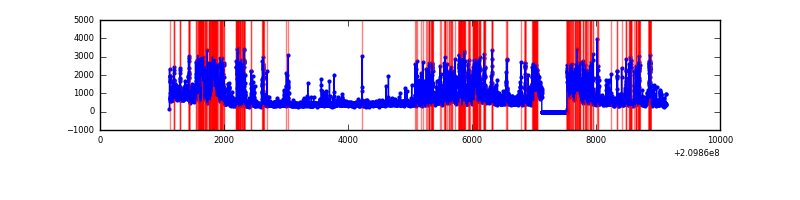 |
Top three noisy pixels from each quadrant. If the there are fewer than three noisy pixels in the level2.evt file, extra rows are filled as -1
| Pixel properties | Quadrant properties | ||||||
|---|---|---|---|---|---|---|---|
| Quadrant | DetID | PixID | Counts | Sigma | Mean | Median | Sigma |
| A | 0 | 31 | 209686 | 1194.99 | 849 | 829 | 174.8 |
| A | 15 | 31 | 19188 | 105.04 | 849 | 829 | 174.8 |
| A | 12 | 194 | 8671 | 44.87 | 849 | 829 | 174.8 |
| B | 10 | 16 | 265809 | 1599.29 | 864 | 840 | 165.7 |
| B | 0 | 219 | 59796 | 355.84 | 864 | 840 | 165.7 |
| B | 15 | 54 | 47663 | 282.61 | 864 | 840 | 165.7 |
| C | 9 | 247 | 263731 | 1365.53 | 832 | 834 | 192.5 |
| C | 1 | 16 | 33395 | 169.13 | 832 | 834 | 192.5 |
| C | 13 | 61 | 6809 | 31.04 | 832 | 834 | 192.5 |
| D | 1 | 7 | 1199323 | 6038.52 | 806 | 779 | 198.5 |
| D | 2 | 33 | 879004 | 4424.68 | 806 | 779 | 198.5 |
| D | 12 | 233 | 395783 | 1990.11 | 806 | 779 | 198.5 |
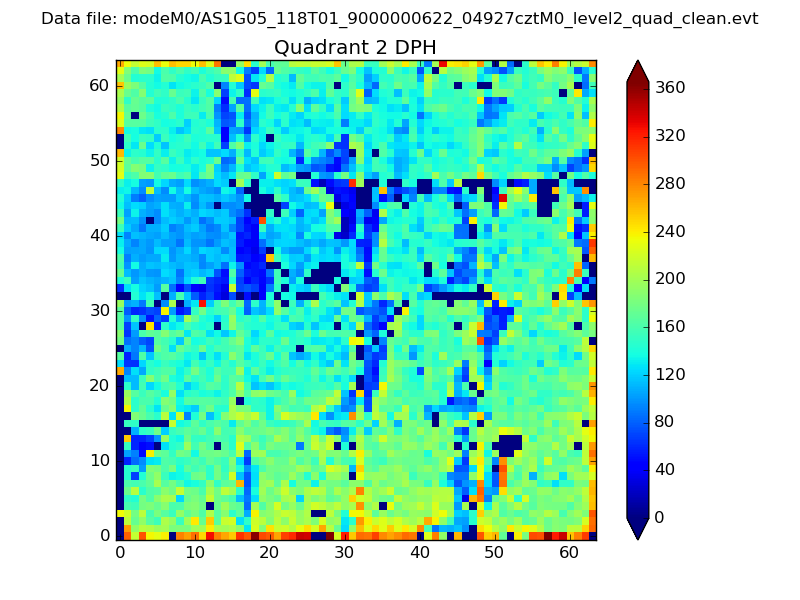
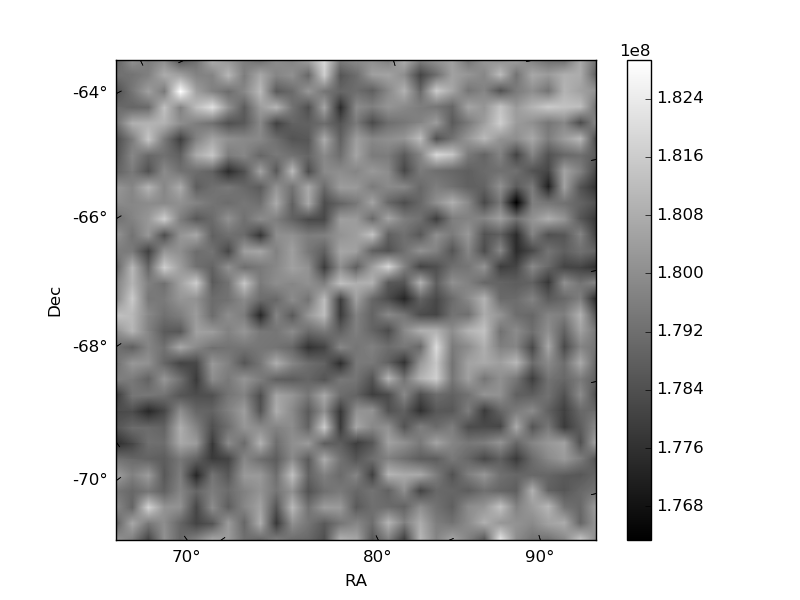
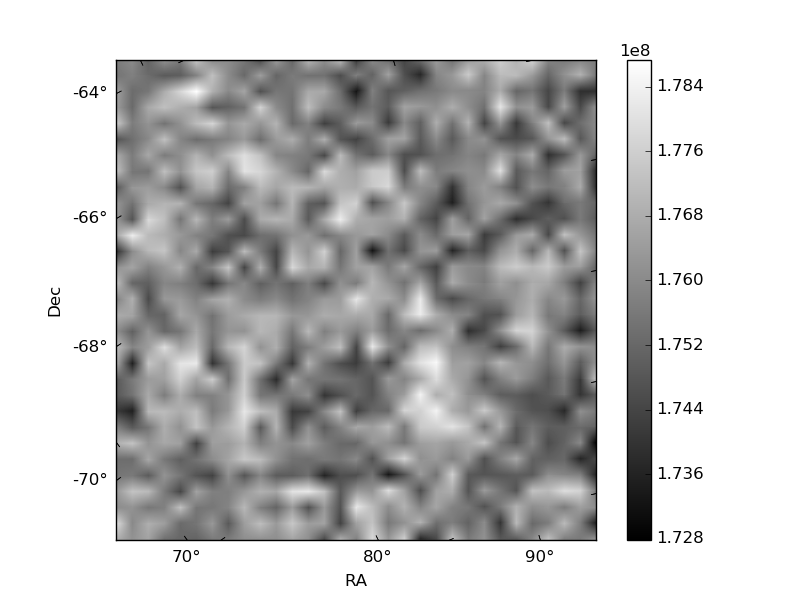
Histogram calculated using DETX and DETY for each event in the final _common_clean file
| Quadrant A | 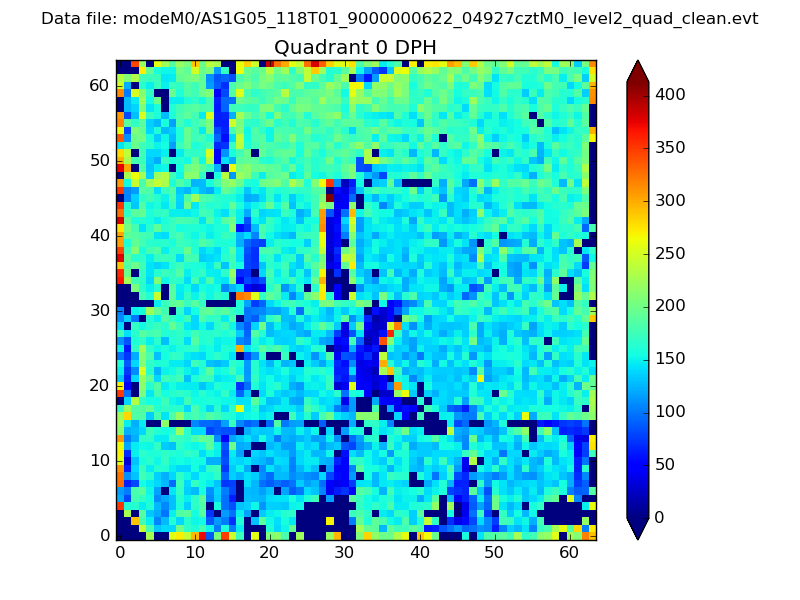 |
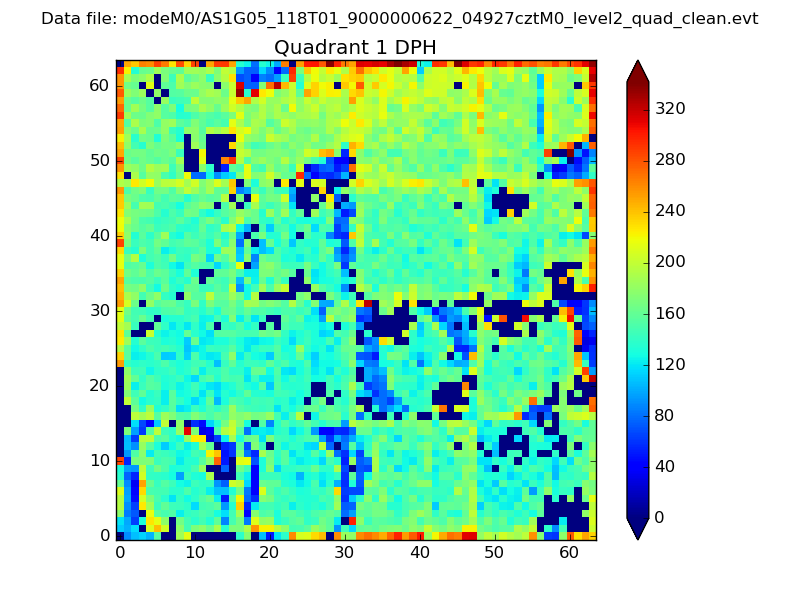 |
Quadrant B |
|---|---|---|---|
| Quadrant D | 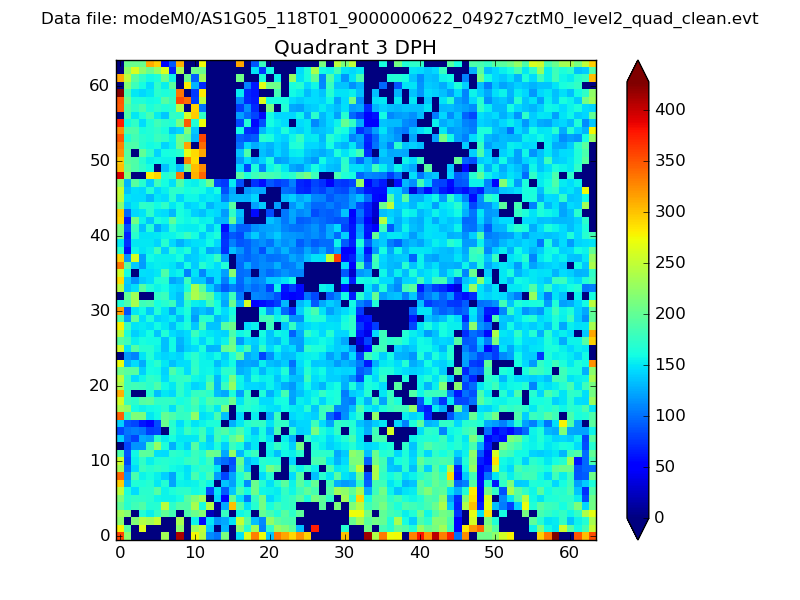 |
 |
Quadrant C |
| Plot type | Count rate plots | Images |
|---|---|---|
| Comparison with Poisson distribution Blue bars denote a histogram of data divided into 1 sec bins. Red curve is a Poisson curve with rate = median count rate of data. |
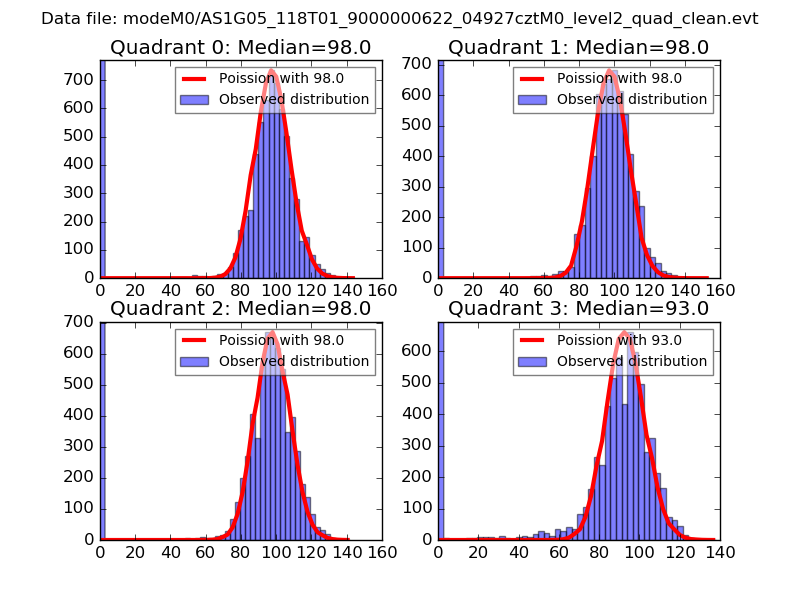 |
 |
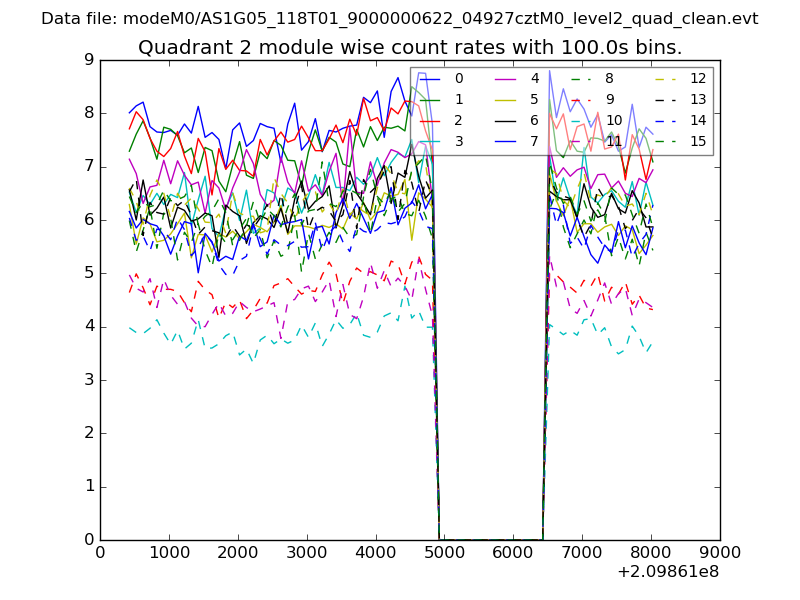
| Quadrant-wise count rates Data is divided into 100 sec bins |
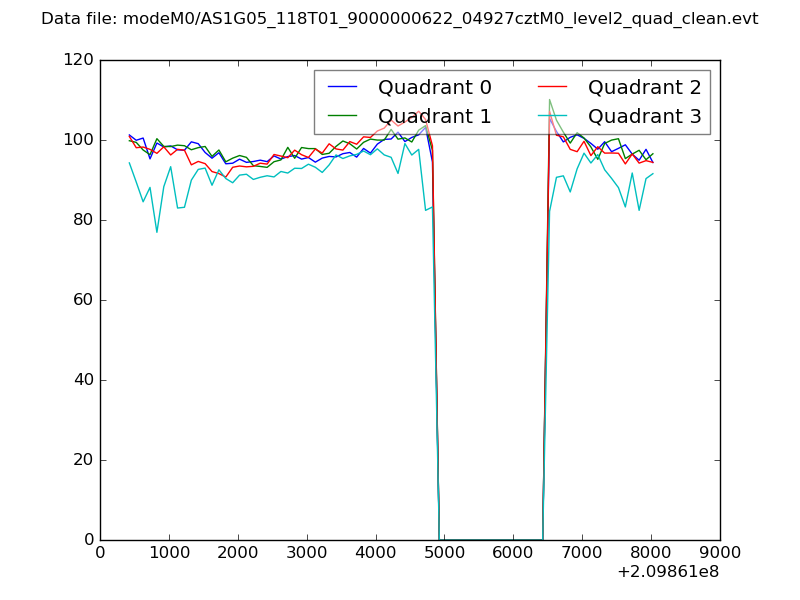 |
|
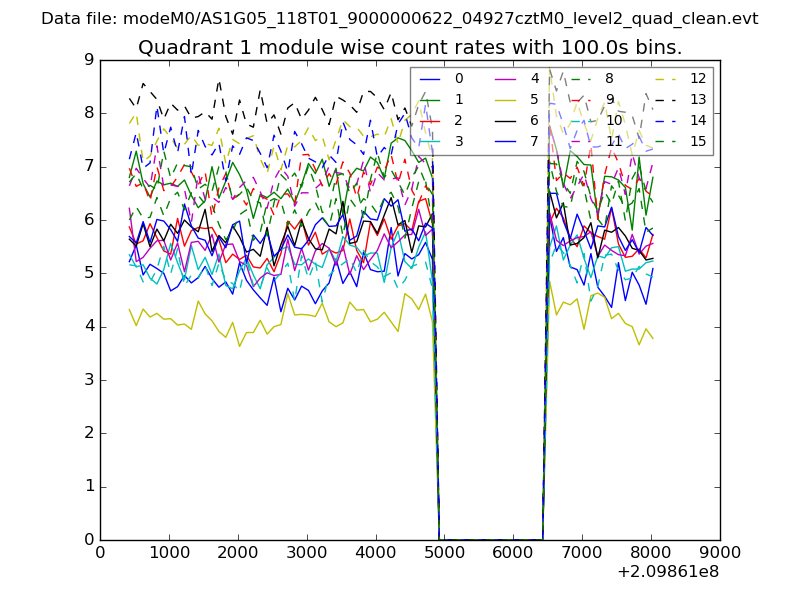
| Module-wise count rates for Quadrant A Data is divided into 100 sec bins |
 |
 |
| Module-wise count rates for Quadrant B Data is divided into 100 sec bins |
 |
 |
| Module-wise count rates for Quadrant C Data is divided into 100 sec bins |
 |
 |
| Module-wise count rates for Quadrant D Data is divided into 100 sec bins |
 |
 |
| Parameter | Plot |
|---|---|
| CZT HV Monitor | 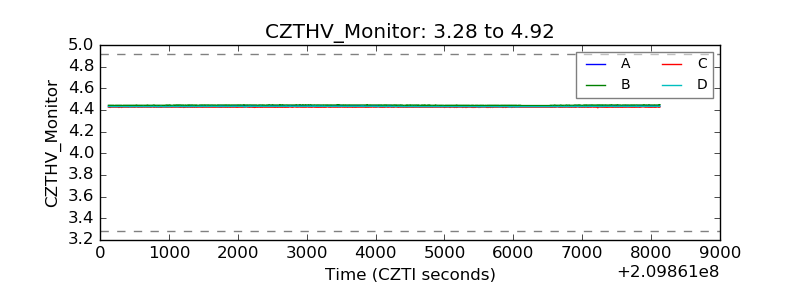 |
| D_VDD | 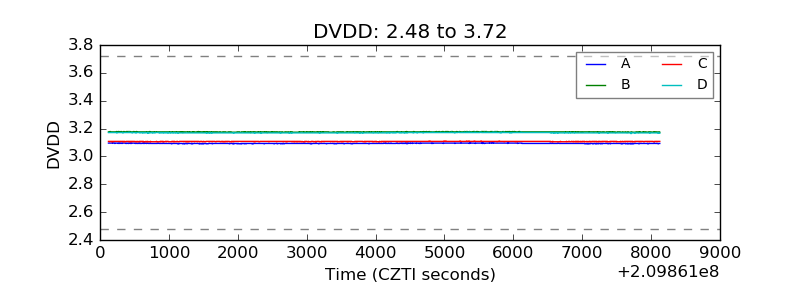 |
| Temperature 1 | 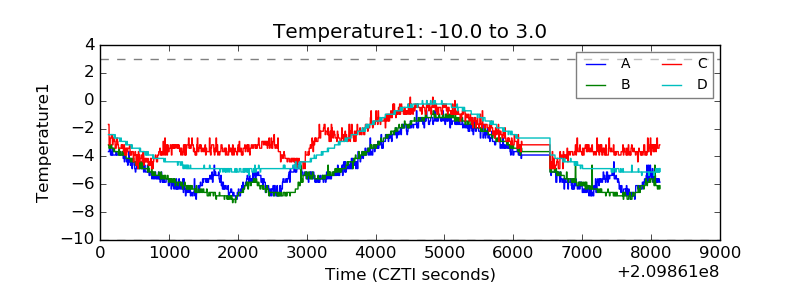 |
| Veto HV Monitor | 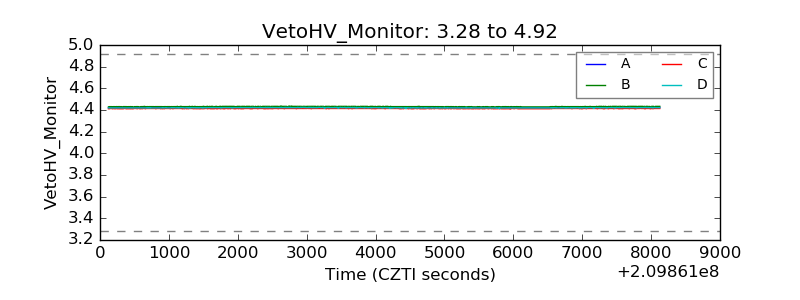 |
| Veto LLD | 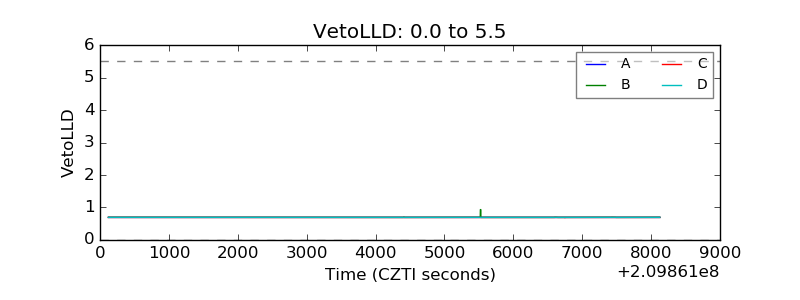 |
| Alpha Counter | 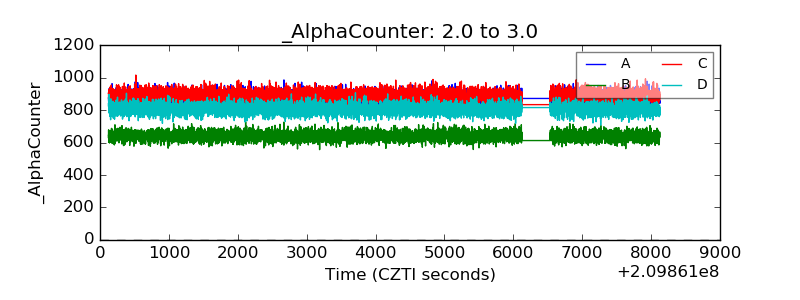 |
| _CPM_Rate | 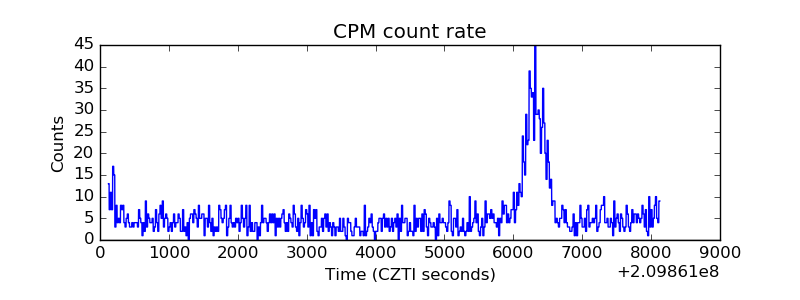 |
| CZT Counter | 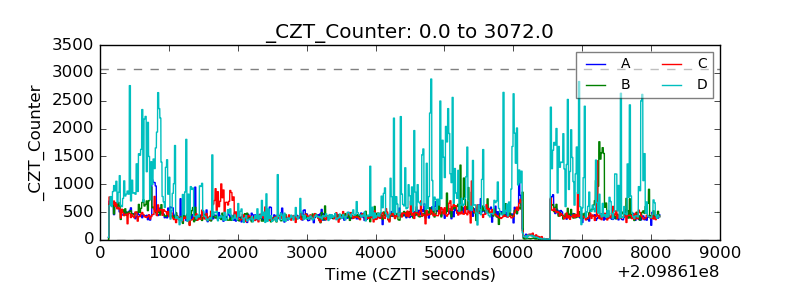 |
| +2.5 Volts monitor |  |
| +5 Volts monitor |  |
| _ROLL_ROT |  |
| _Roll_DEC | 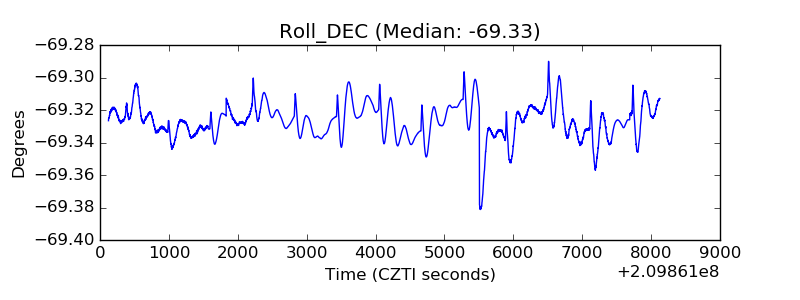 |
| _Roll_RA | 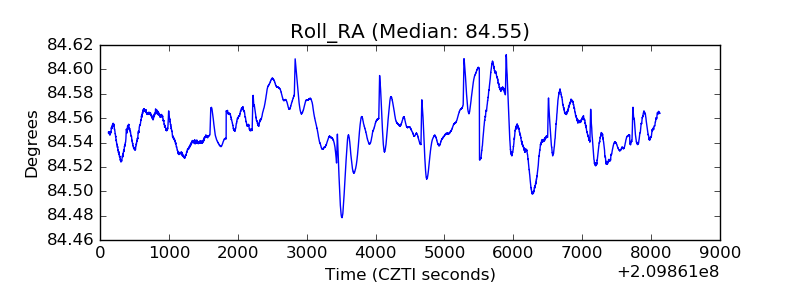 |
| Veto Counter | 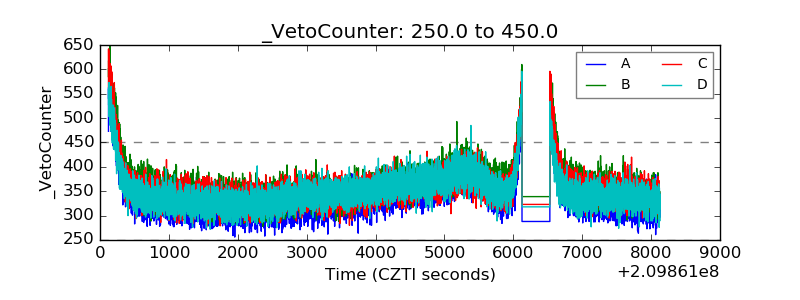 |