| Param | Original file | Final file |
|---|---|---|
| Filename | modeM0/AS1G05_118T01_9000000622_04930cztM0_level2.evt | modeM0/AS1G05_118T01_9000000622_04930cztM0_level2_quad_clean.evt |
| Size (bytes) | 1,223,562,240 | 186,552,000 |
| Size | 1.1 GB | 177.9 MB |
| Events in quadrant A | 7,052,511 | 1,152,515 |
| Events in quadrant B | 7,514,992 | 1,168,647 |
| Events in quadrant C | 10,448,598 | 1,144,131 |
| Events in quadrant D | 10,980,522 | 1,102,830 |
| Mode M0 | |||
|---|---|---|---|
| Quadrant | BADHDUFLAG | Total packets | Discarded packets |
| A | 0 | 32351 | 3 |
| B | 0 | 33211 | 3 |
| C | 0 | 42228 | 3 |
| D | 0 | 43819 | 3 |
| Mode M9 | |||
|---|---|---|---|
| Quadrant | BADHDUFLAG | Total packets | Discarded packets |
| A | 0 | 17 | 0 |
| B | 0 | 17 | 0 |
| C | 0 | 17 | 0 |
| D | 0 | 17 | 0 |
| Mode SS | |||
|---|---|---|---|
| Quadrant | BADHDUFLAG | Total packets | Discarded packets |
| A | 0 | 320 | 0 |
| B | 0 | 320 | 0 |
| C | 0 | 320 | 0 |
| D | 0 | 320 | 0 |
| Quadrant | Total seconds | Saturated seconds | Saturation percentage |
|---|---|---|---|
| A | 15672 | 139 | 0.886932% |
| B | 15672 | 149 | 0.950740% |
| C | 15672 | 875 | 5.583206% |
| D | 15672 | 986 | 6.291475% |
Noise dominated data is calculated using 1-second bins in cleaned event files. If a bin has >2000 counts, and if more than 50% of those come from <1% of pixels, then it is considered to be noise-dominated and hence unusable.
| Quadrant | # 1 sec bins | Bins with >0 counts | Bins with >2000 counts | High rate bins dominated by noise | Noise dominated (total time) | Noise dominated (detector-on time) | Marked lightcurve |
|---|---|---|---|---|---|---|---|
| A | 17437 | 15675 | 36 | 36 | 0.21% | 0.23% | 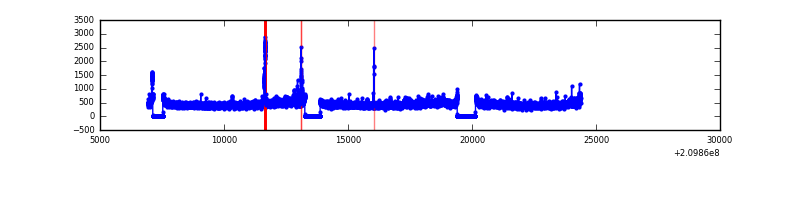 |
| B | 17437 | 15674 | 50 | 50 | 0.29% | 0.32% | 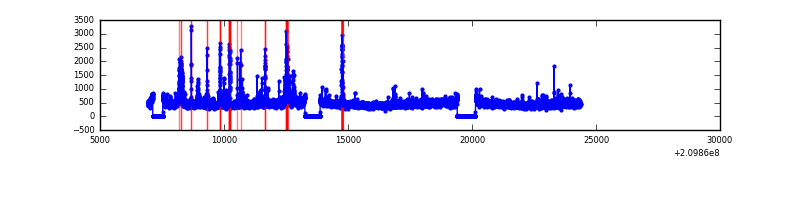 |
| C | 17437 | 15674 | 697 | 697 | 4.00% | 4.45% | 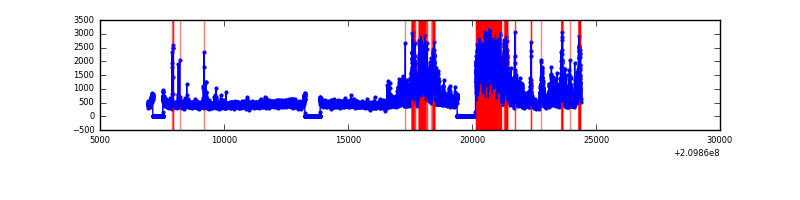 |
| D | 17437 | 15673 | 772 | 772 | 4.43% | 4.93% | 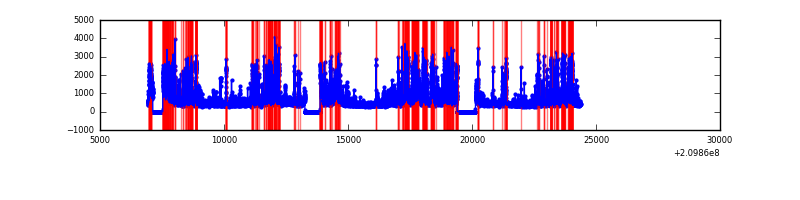 |
Top three noisy pixels from each quadrant. If the there are fewer than three noisy pixels in the level2.evt file, extra rows are filled as -1
| Pixel properties | Quadrant properties | ||||||
|---|---|---|---|---|---|---|---|
| Quadrant | DetID | PixID | Counts | Sigma | Mean | Median | Sigma |
| A | 0 | 31 | 259545 | 727.51 | 1742 | 1699 | 354.4 |
| A | 15 | 31 | 24807 | 65.2 | 1742 | 1699 | 354.4 |
| A | 0 | 50 | 24584 | 64.57 | 1742 | 1699 | 354.4 |
| B | 10 | 16 | 482289 | 1433.42 | 1762 | 1719 | 335.3 |
| B | 15 | 54 | 67165 | 195.21 | 1762 | 1719 | 335.3 |
| B | 15 | 204 | 66944 | 194.55 | 1762 | 1719 | 335.3 |
| C | 9 | 247 | 3802124 | 9799.24 | 1686 | 1694 | 387.8 |
| C | 1 | 16 | 52379 | 130.69 | 1686 | 1694 | 387.8 |
| C | 13 | 61 | 13675 | 30.89 | 1686 | 1694 | 387.8 |
| D | 2 | 33 | 1951544 | 4765.44 | 1677 | 1622 | 409.2 |
| D | 12 | 233 | 672984 | 1640.75 | 1677 | 1622 | 409.2 |
| D | 12 | 22 | 479863 | 1168.78 | 1677 | 1622 | 409.2 |
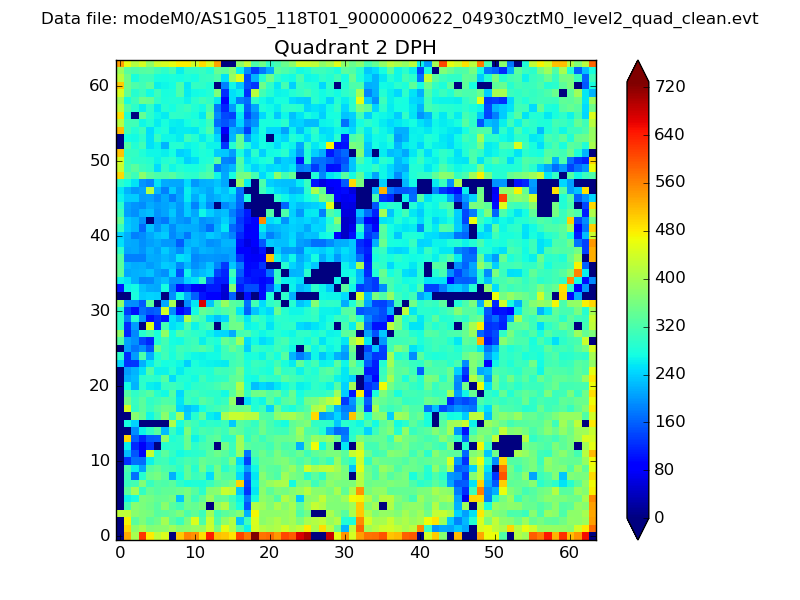
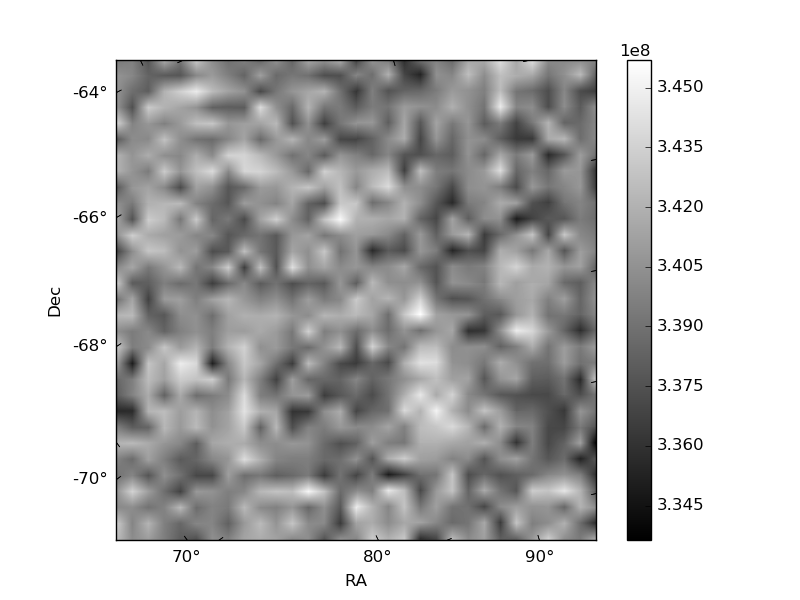
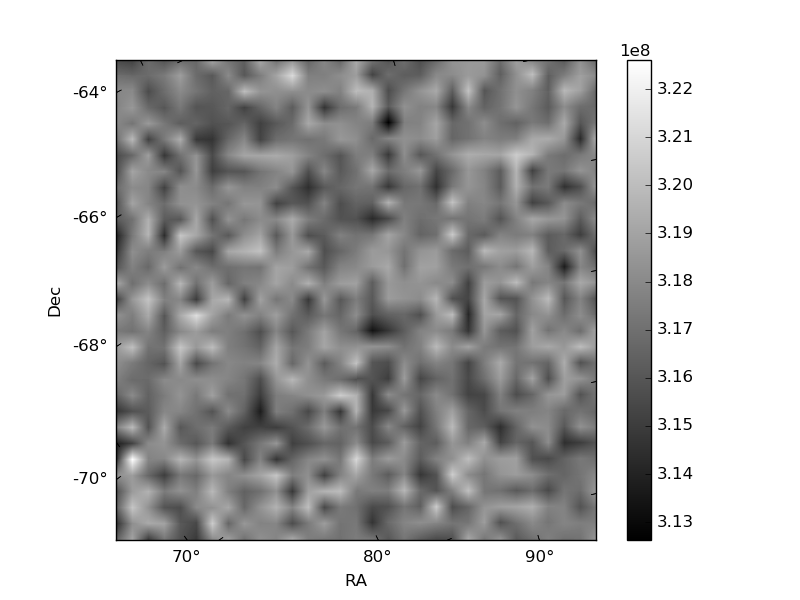
Histogram calculated using DETX and DETY for each event in the final _common_clean file
| Quadrant A | 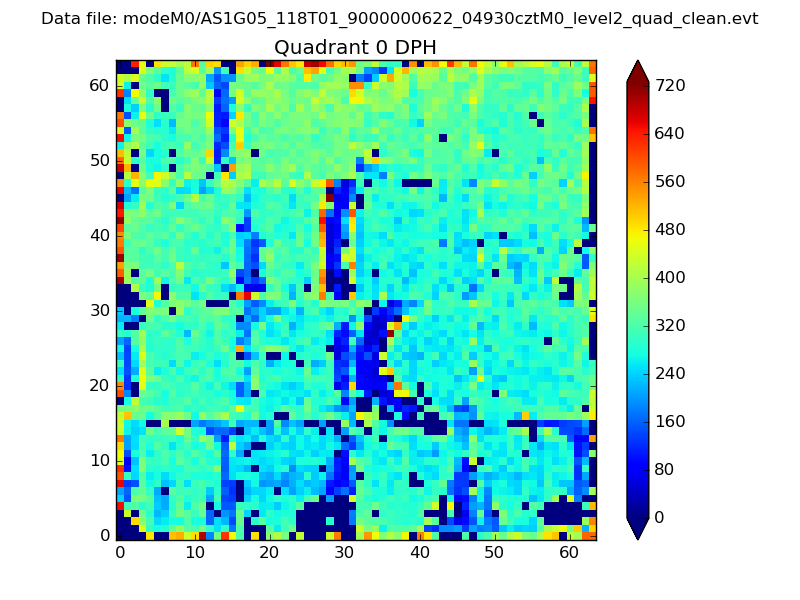 |
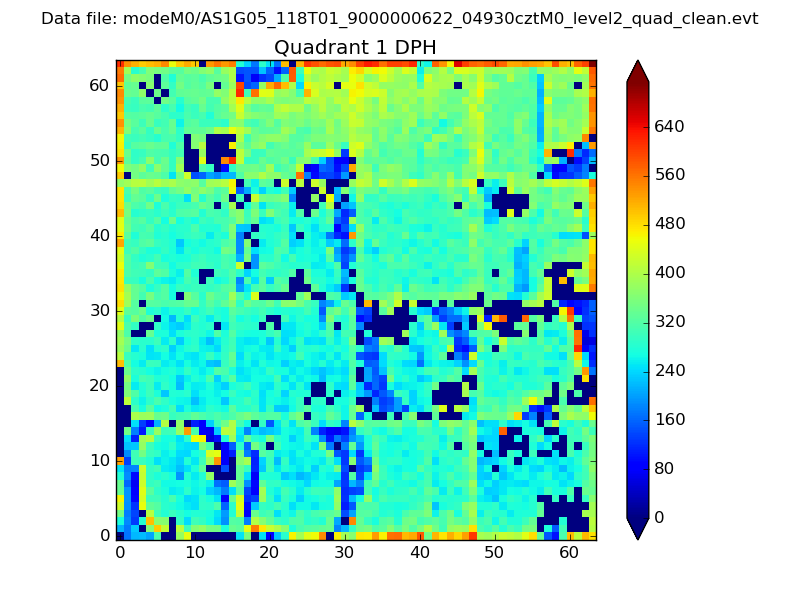 |
Quadrant B |
|---|---|---|---|
| Quadrant D | 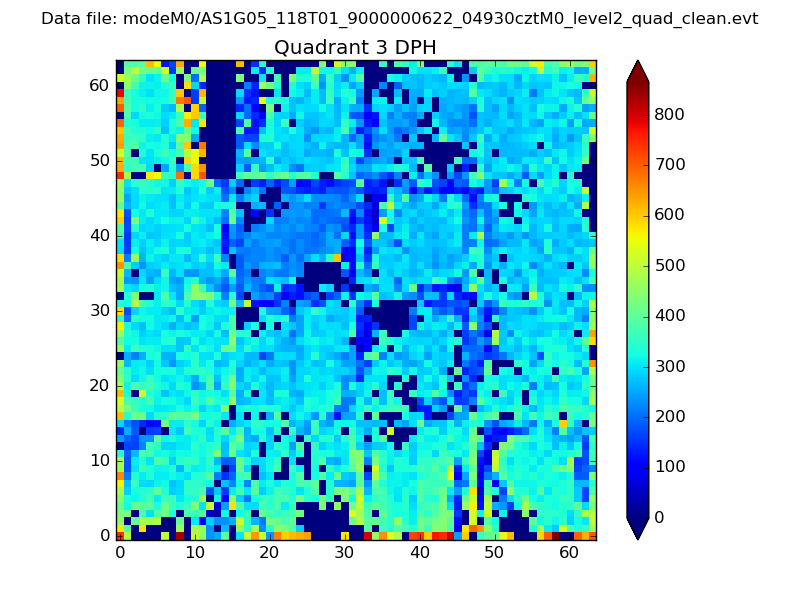 |
 |
Quadrant C |
| Plot type | Count rate plots | Images |
|---|---|---|
| Comparison with Poisson distribution Blue bars denote a histogram of data divided into 1 sec bins. Red curve is a Poisson curve with rate = median count rate of data. |
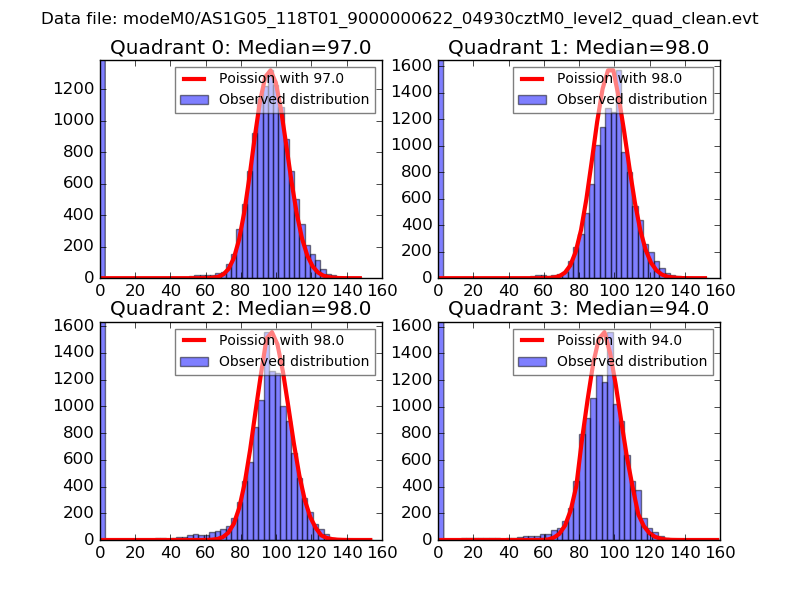 |
 |
| Quadrant-wise count rates Data is divided into 100 sec bins |
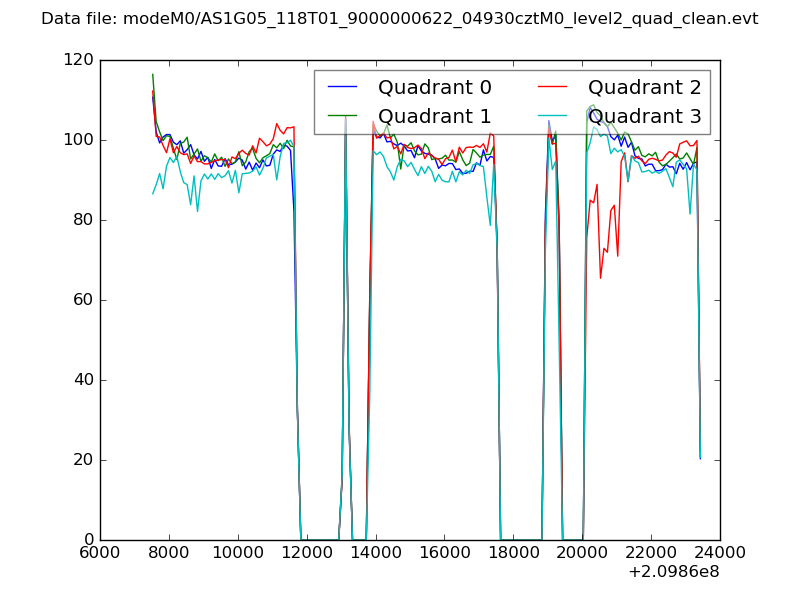 |
|
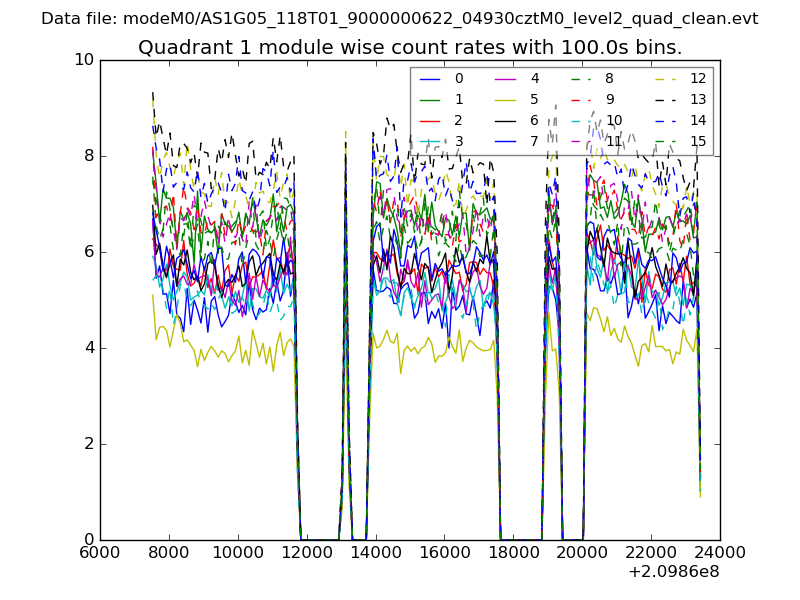
| Module-wise count rates for Quadrant A Data is divided into 100 sec bins |
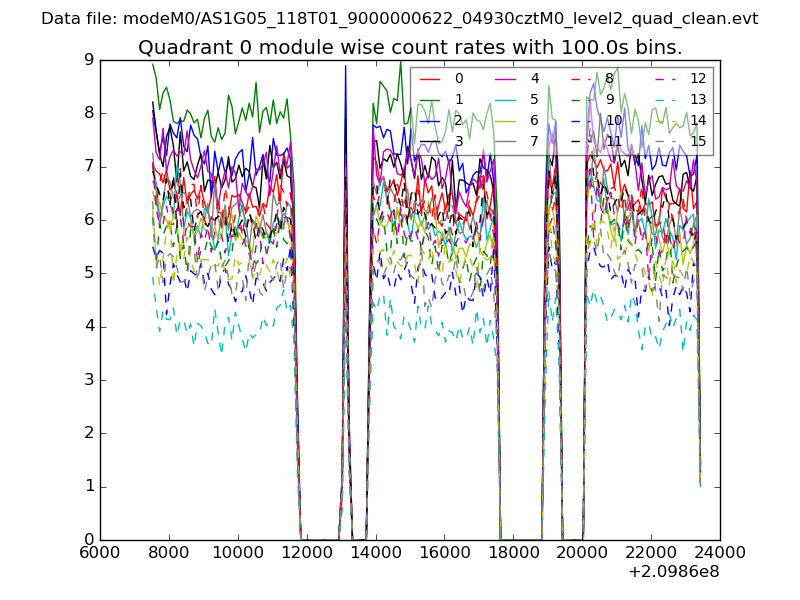 |
 |
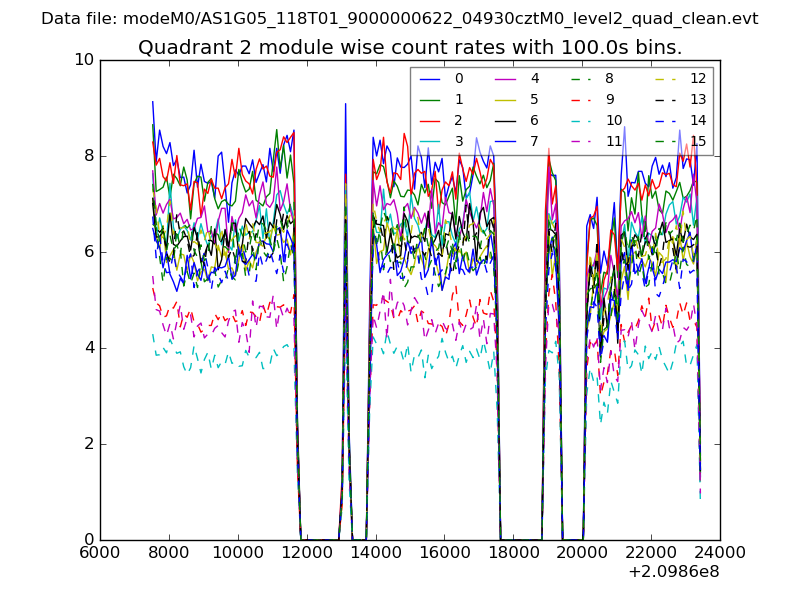
| Module-wise count rates for Quadrant B Data is divided into 100 sec bins |
 |
 |
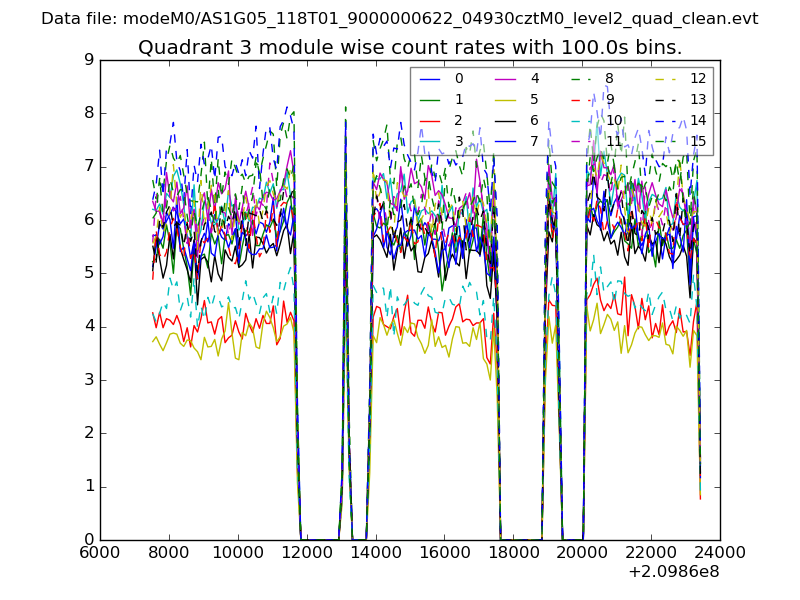
| Module-wise count rates for Quadrant C Data is divided into 100 sec bins |
 |
 |
| Module-wise count rates for Quadrant D Data is divided into 100 sec bins |
 |
 |
| Parameter | Plot |
|---|---|
| CZT HV Monitor | 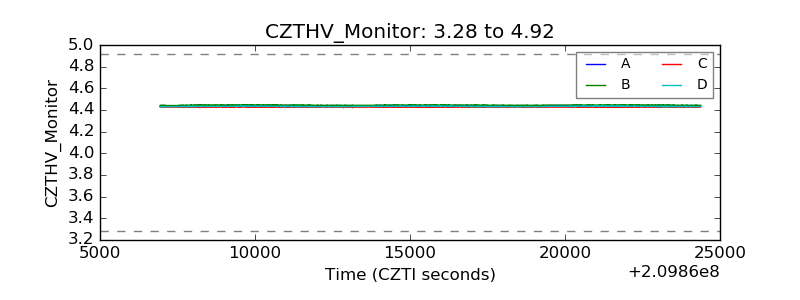 |
| D_VDD | 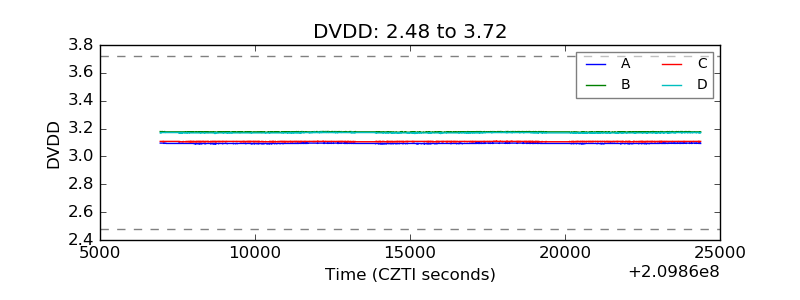 |
| Temperature 1 | 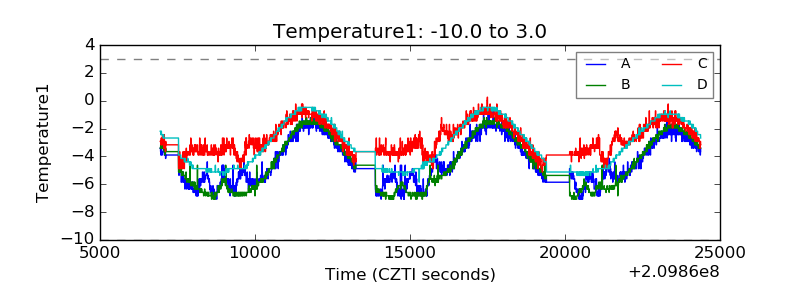 |
| Veto HV Monitor |  |
| Veto LLD | 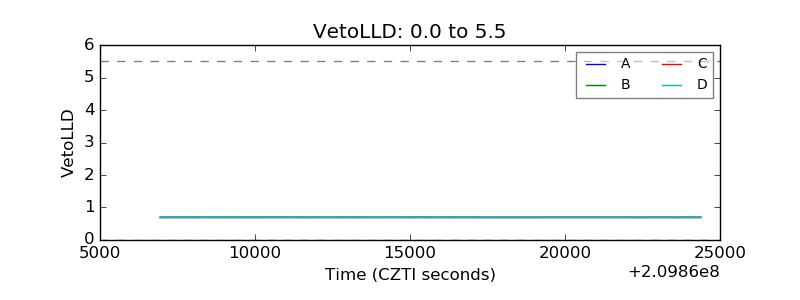 |
| Alpha Counter | 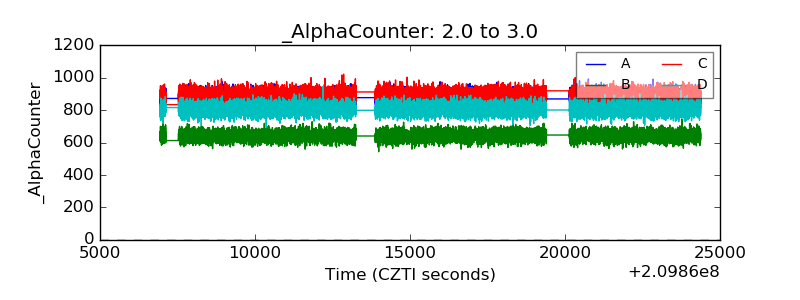 |
| _CPM_Rate | 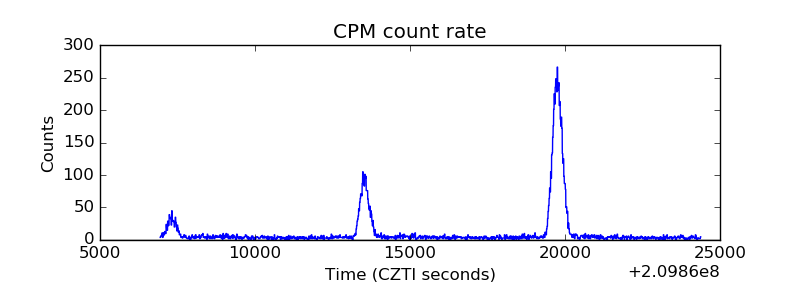 |
| CZT Counter | 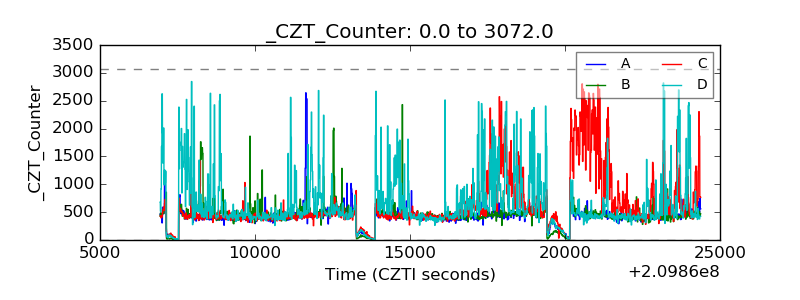 |
| +2.5 Volts monitor |  |
| +5 Volts monitor |  |
| _ROLL_ROT | 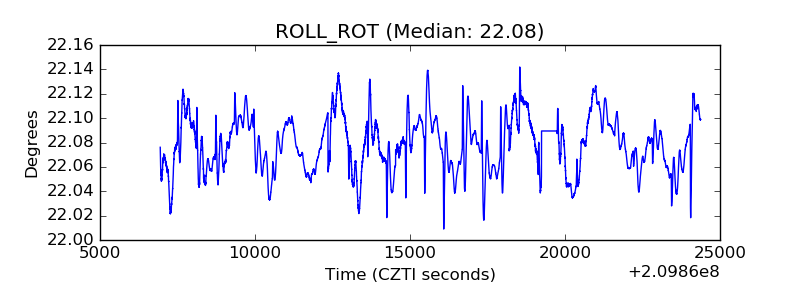 |
| _Roll_DEC | 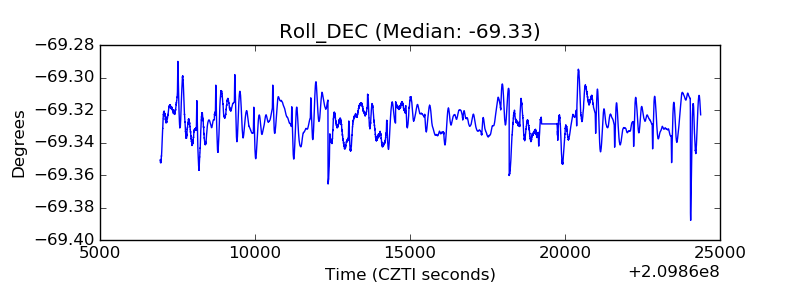 |
| _Roll_RA | 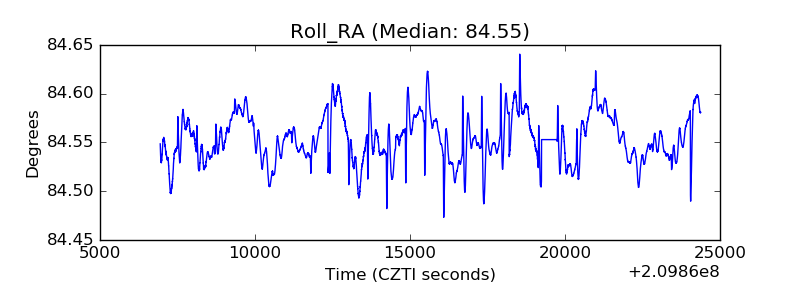 |
| Veto Counter | 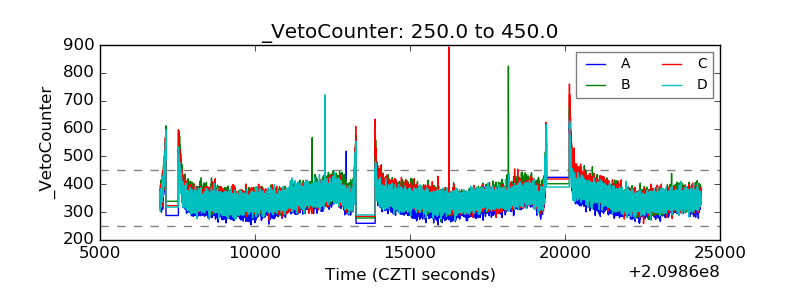 |