| Param | Original file | Final file |
|---|---|---|
| Filename | modeM0/AS1G05_021T01_9000000624cztM0_level2.fits | modeM0/AS1G05_021T01_9000000624cztM0_level2_quad_clean.evt |
| Size (bytes) | 451,022,400 | 596,859,840 |
| Size | 430.1 MB | 569.2 MB |
| Events in quadrant A | 2,417,822 | 3,319,454 |
| Events in quadrant B | 2,745,790 | 4,130,664 |
| Events in quadrant C | 2,554,598 | 3,471,536 |
| Events in quadrant D | 2,379,602 | 3,603,740 |
| Mode M9 | |||
|---|---|---|---|
| Quadrant | BADHDUFLAG | Total packets | Discarded packets |
| A | 0 | 92 | 0 |
| B | 0 | 92 | 0 |
| C | 0 | 92 | 0 |
| D | 0 | 92 | 0 |
| Mode M0 | |||
|---|---|---|---|
| Quadrant | BADHDUFLAG | Total packets | Discarded packets |
| A | 0 | 178060 | 0 |
| B | 0 | 109923 | 0 |
| C | 0 | 191998 | 0 |
| D | 0 | 134664 | 0 |
| Mode SS | |||
|---|---|---|---|
| Quadrant | BADHDUFLAG | Total packets | Discarded packets |
| A | 0 | 1142 | 0 |
| B | 0 | 1142 | 0 |
| C | 0 | 1142 | 0 |
| D | 0 | 1142 | 0 |
| Quadrant | Total seconds | Saturated seconds | Saturation percentage |
|---|---|---|---|
| A | 51457 | 10933 | 21.246866% |
| B | 51457 | 635 | 1.234040% |
| C | 51457 | 9218 | 17.913986% |
| D | 51457 | 2075 | 4.032493% |
Noise dominated data is calculated using 1-second bins in cleaned event files. If a bin has >2000 counts, and if more than 50% of those come from <1% of pixels, then it is considered to be noise-dominated and hence unusable.
| Quadrant | # 1 sec bins | Bins with >0 counts | Bins with >2000 counts | High rate bins dominated by noise | Noise dominated (total time) | Noise dominated (detector-on time) | Marked lightcurve |
|---|---|---|---|---|---|---|---|
| A | 70581 | 48935 | 0 | 0 | 0.00% | 0.00% |  |
| B | 70580 | 51449 | 0 | 0 | 0.00% | 0.00% |  |
| C | 70581 | 51447 | 0 | 0 | 0.00% | 0.00% |  |
| D | 70581 | 51335 | 0 | 0 | 0.00% | 0.00% |  |
Top three noisy pixels from each quadrant. If the there are fewer than three noisy pixels in the level2.evt file, extra rows are filled as -1
| Pixel properties | Quadrant properties | ||||||
|---|---|---|---|---|---|---|---|
| Quadrant | DetID | PixID | Counts | Sigma | Mean | Median | Sigma |
| A | 14 | 188 | 2446 | 11.39 | 627 | 587 | 163.3 |
| A | 0 | 29 | 2376 | 10.96 | 627 | 587 | 163.3 |
| A | 14 | 204 | 2080 | 9.14 | 627 | 587 | 163.3 |
| B | 2 | 9 | 2362 | 11.83 | 725 | 693 | 141.1 |
| B | 14 | 254 | 1972 | 9.06 | 725 | 693 | 141.1 |
| B | 12 | 226 | 1951 | 8.91 | 725 | 693 | 141.1 |
| C | 1 | 80 | 1878 | 7.02 | 674 | 628 | 178.2 |
| C | 1 | 81 | 1876 | 7.0 | 674 | 628 | 178.2 |
| C | 9 | 188 | 1782 | 6.48 | 674 | 628 | 178.2 |
| D | 11 | 82 | 1975 | 7.44 | 679 | 621 | 182.0 |
| D | 3 | 14 | 1833 | 6.66 | 679 | 621 | 182.0 |
| D | 6 | 231 | 1758 | 6.25 | 679 | 621 | 182.0 |
Histogram calculated using DETX and DETY for each event in the final _common_clean file
| Quadrant A |  |
 |
Quadrant B |
|---|---|---|---|
| Quadrant D |  |
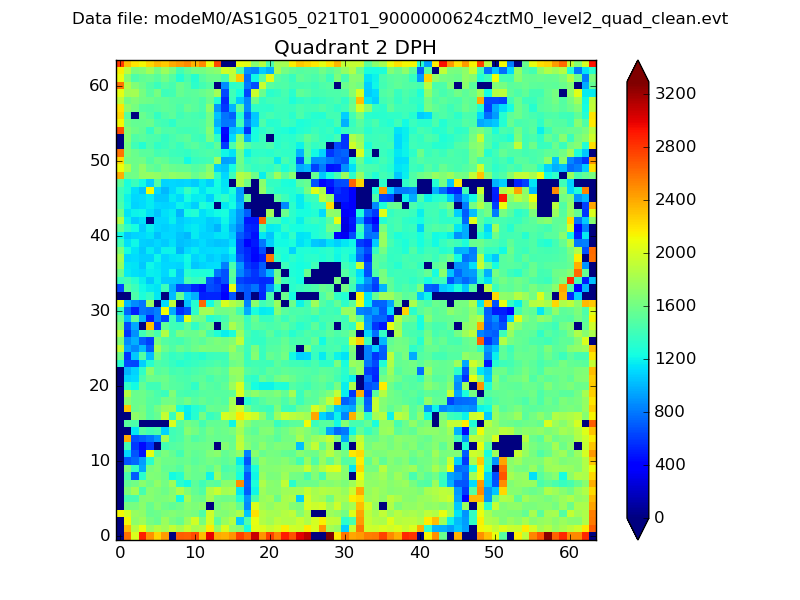 |
Quadrant C |
| Plot type | Count rate plots | Images |
|---|---|---|
| Comparison with Poisson distribution Blue bars denote a histogram of data divided into 1 sec bins. Red curve is a Poisson curve with rate = median count rate of data. |
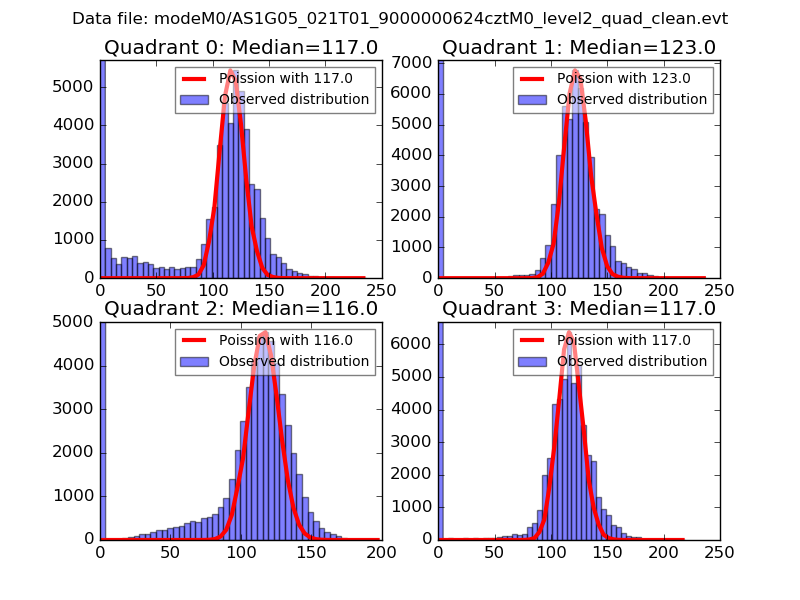 |
 |
| Quadrant-wise count rates Data is divided into 100 sec bins |
 |
|
| Module-wise count rates for Quadrant A Data is divided into 100 sec bins |
 |
 |
| Module-wise count rates for Quadrant B Data is divided into 100 sec bins |
 |
 |
| Module-wise count rates for Quadrant C Data is divided into 100 sec bins |
 |
 |
| Module-wise count rates for Quadrant D Data is divided into 100 sec bins |
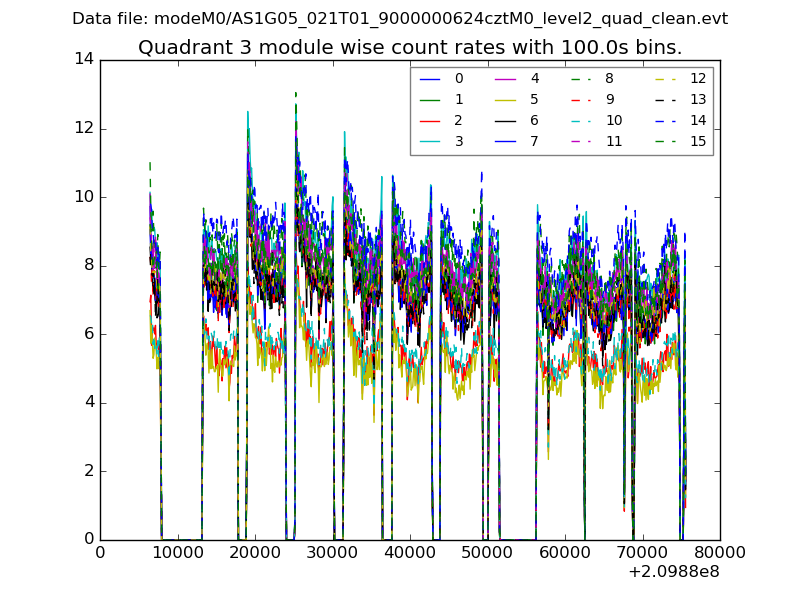 |
 |
| Parameter | Plot |
|---|---|
| CZT HV Monitor |  |
| D_VDD |  |
| Temperature 1 |  |
| Veto HV Monitor | 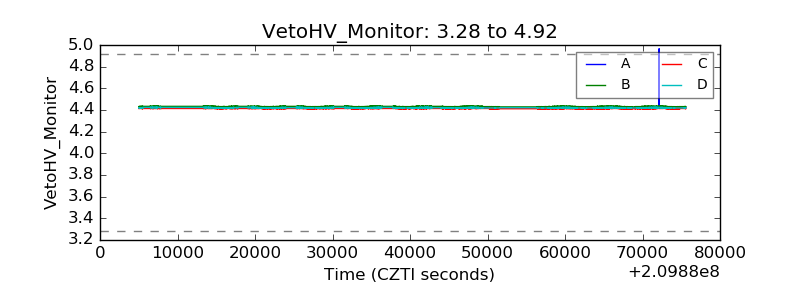 |
| Veto LLD | 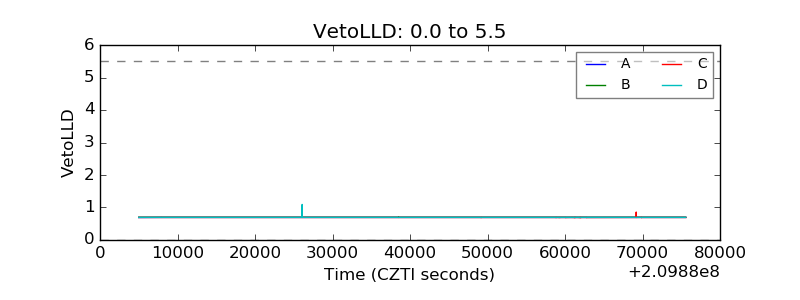 |
| Alpha Counter | 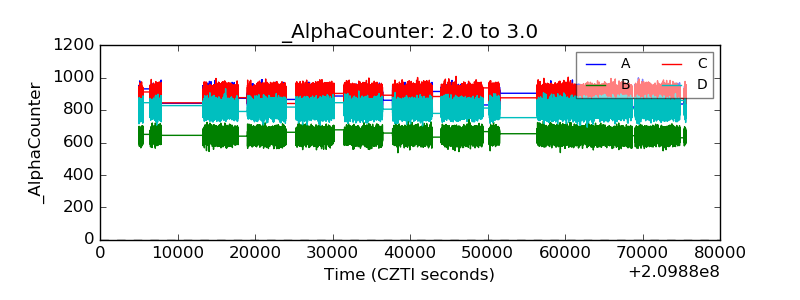 |
| _CPM_Rate |  |
| CZT Counter | 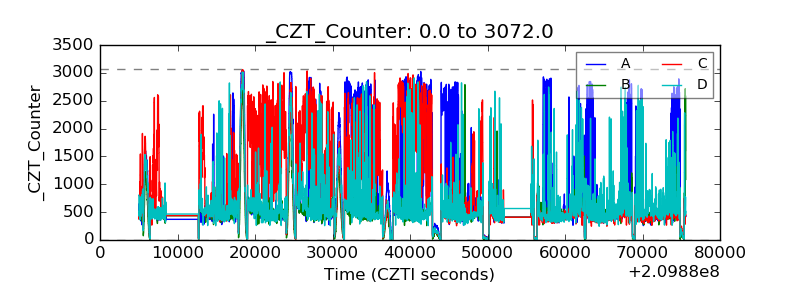 |
| +2.5 Volts monitor |  |
| +5 Volts monitor | 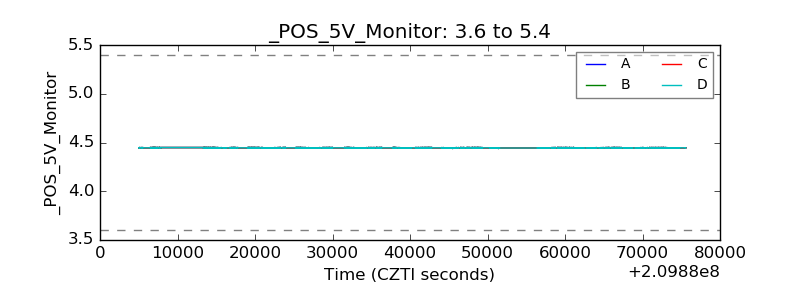 |
| _ROLL_ROT |  |
| _Roll_DEC |  |
| _Roll_RA | 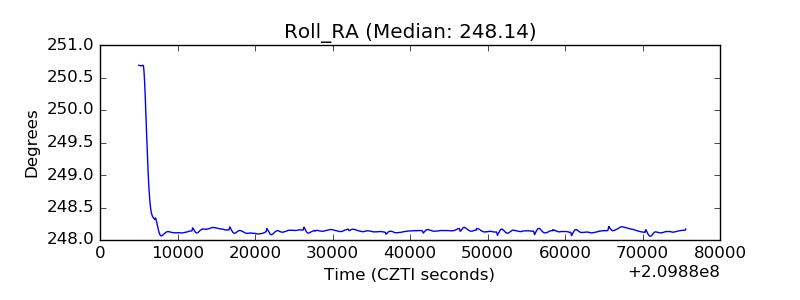 |
| Veto Counter |  |