| Param | Original file | Final file |
|---|---|---|
| Filename | modeM0/AS1G05_021T01_9000000624_04930cztM0_level2.evt | modeM0/AS1G05_021T01_9000000624_04930cztM0_level2_quad_clean.evt |
| Size (bytes) | 170,665,920 | 31,576,320 |
| Size | 162.8 MB | 30.1 MB |
| Events in quadrant A | 976,169 | 208,352 |
| Events in quadrant B | 1,003,217 | 208,911 |
| Events in quadrant C | 1,997,667 | 194,202 |
| Events in quadrant D | 1,052,715 | 198,122 |
| Mode M9 | |||
|---|---|---|---|
| Quadrant | BADHDUFLAG | Total packets | Discarded packets |
| A | 0 | 9 | 0 |
| B | 0 | 9 | 0 |
| C | 0 | 9 | 0 |
| D | 0 | 9 | 0 |
| Mode M0 | |||
|---|---|---|---|
| Quadrant | BADHDUFLAG | Total packets | Discarded packets |
| A | 0 | 4165 | 2 |
| B | 0 | 4204 | 1 |
| C | 0 | 7341 | 1 |
| D | 0 | 4455 | 1 |
| Mode SS | |||
|---|---|---|---|
| Quadrant | BADHDUFLAG | Total packets | Discarded packets |
| A | 0 | 42 | 0 |
| B | 0 | 42 | 0 |
| C | 0 | 42 | 0 |
| D | 0 | 42 | 0 |
| Quadrant | Total seconds | Saturated seconds | Saturation percentage |
|---|---|---|---|
| A | 2009 | 72 | 3.583873% |
| B | 2009 | 72 | 3.583873% |
| C | 2009 | 290 | 14.435042% |
| D | 2009 | 65 | 3.235441% |
Noise dominated data is calculated using 1-second bins in cleaned event files. If a bin has >2000 counts, and if more than 50% of those come from <1% of pixels, then it is considered to be noise-dominated and hence unusable.
| Quadrant | # 1 sec bins | Bins with >0 counts | Bins with >2000 counts | High rate bins dominated by noise | Noise dominated (total time) | Noise dominated (detector-on time) | Marked lightcurve |
|---|---|---|---|---|---|---|---|
| A | 2909 | 2009 | 0 | 0 | 0.00% | 0.00% | 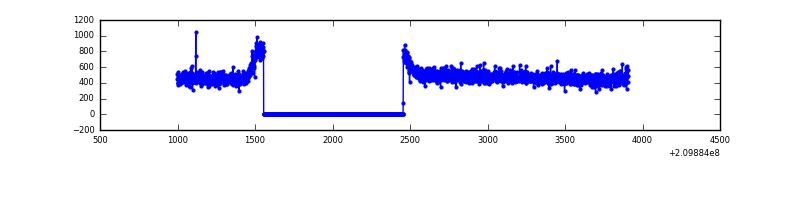 |
| B | 2909 | 2009 | 0 | 0 | 0.00% | 0.00% | 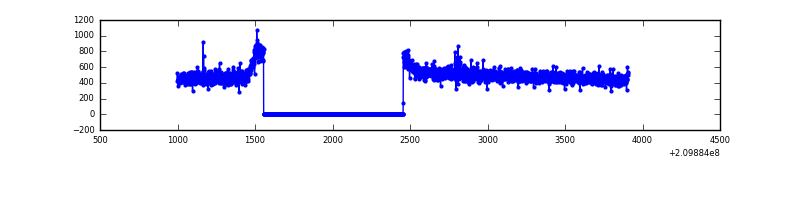 |
| C | 2909 | 2009 | 175 | 175 | 6.02% | 8.71% | 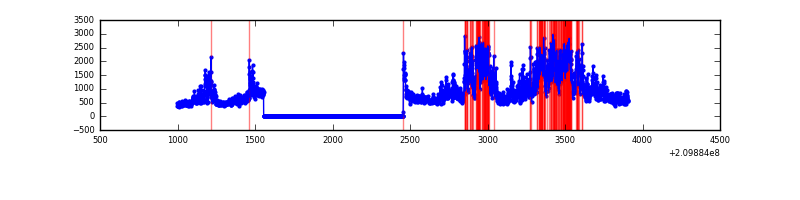 |
| D | 2909 | 2009 | 2 | 2 | 0.07% | 0.10% | 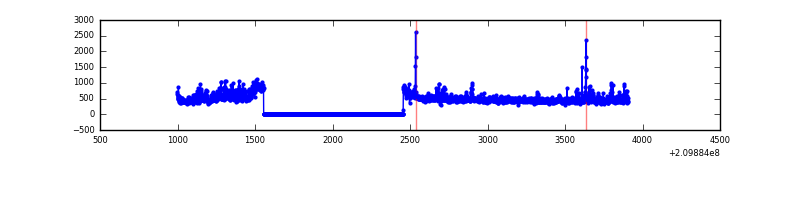 |
Top three noisy pixels from each quadrant. If the there are fewer than three noisy pixels in the level2.evt file, extra rows are filled as -1
| Pixel properties | Quadrant properties | ||||||
|---|---|---|---|---|---|---|---|
| Quadrant | DetID | PixID | Counts | Sigma | Mean | Median | Sigma |
| A | 13 | 251 | 5790 | 104.34 | 251 | 245 | 53.1 |
| A | 0 | 31 | 3268 | 56.88 | 251 | 245 | 53.1 |
| A | 12 | 194 | 2552 | 43.41 | 251 | 245 | 53.1 |
| B | 15 | 204 | 6970 | 131.27 | 254 | 247 | 51.2 |
| B | 4 | 80 | 6100 | 114.29 | 254 | 247 | 51.2 |
| B | 12 | 111 | 4492 | 82.89 | 254 | 247 | 51.2 |
| C | 9 | 247 | 1052732 | 18413.71 | 241 | 243 | 57.2 |
| C | 13 | 61 | 1951 | 29.88 | 241 | 243 | 57.2 |
| C | 8 | 222 | 1184 | 16.46 | 241 | 243 | 57.2 |
| D | 2 | 136 | 69359 | 1126.13 | 246 | 238 | 61.4 |
| D | 13 | 235 | 13006 | 208.02 | 246 | 238 | 61.4 |
| D | 12 | 22 | 12953 | 207.16 | 246 | 238 | 61.4 |
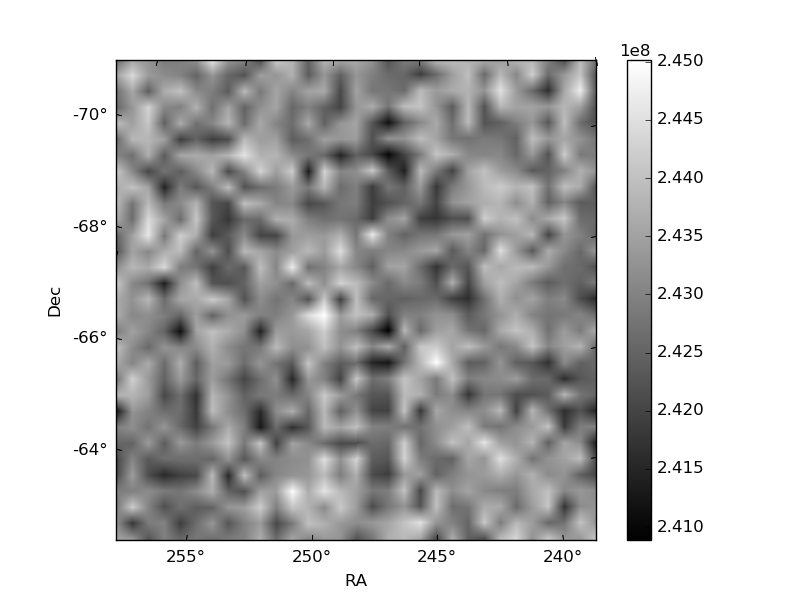
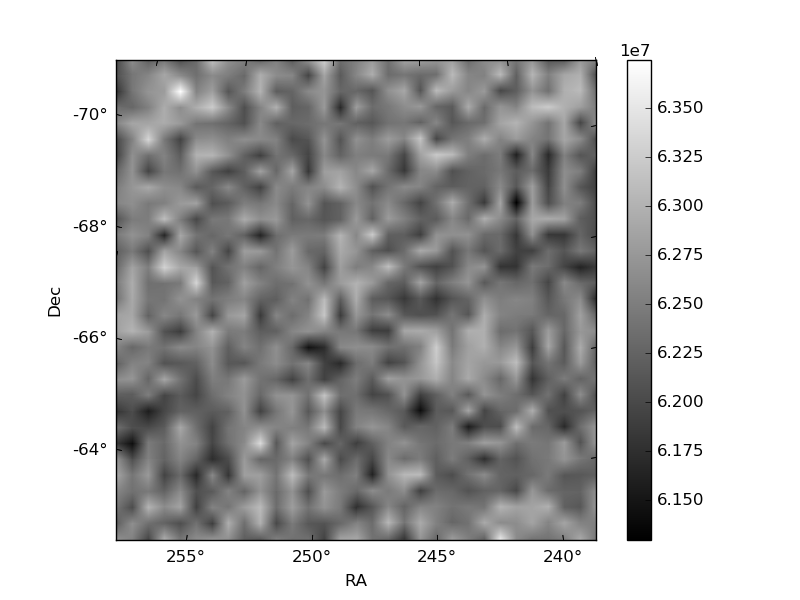
Histogram calculated using DETX and DETY for each event in the final _common_clean file
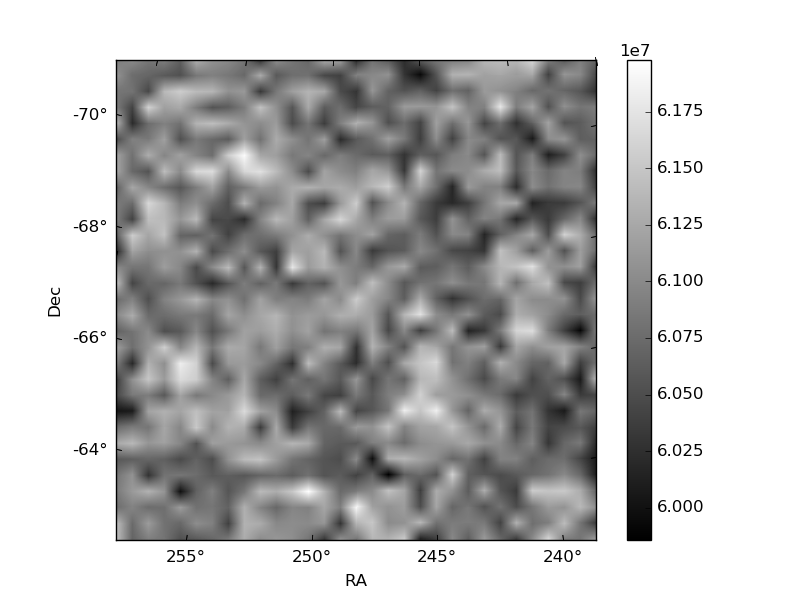
| Quadrant A | 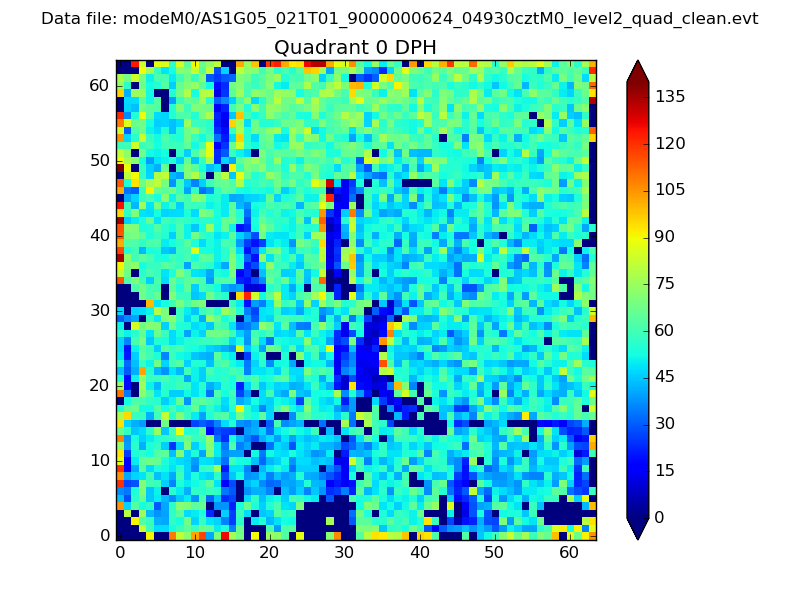 |
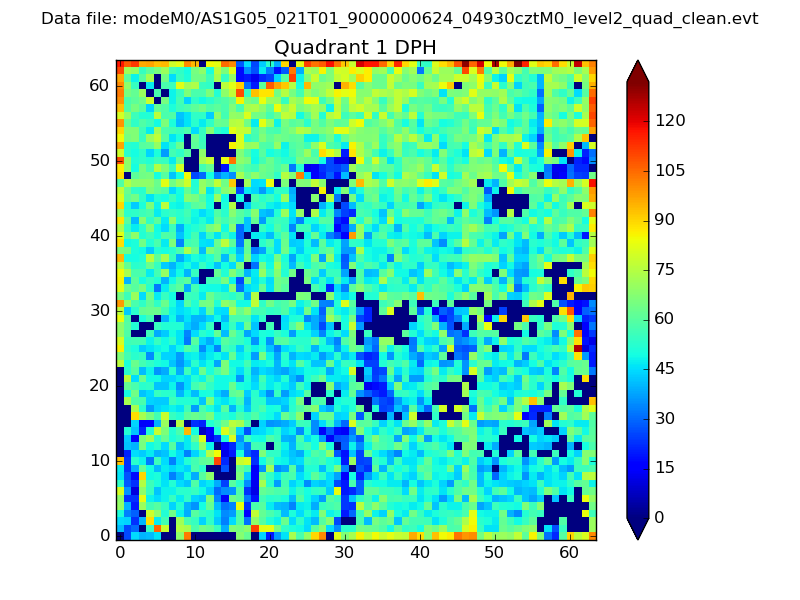 |
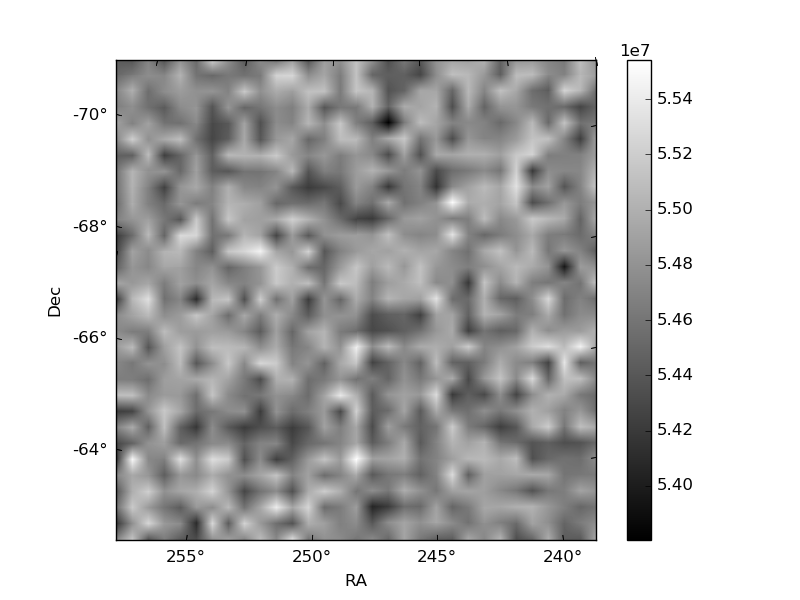
Quadrant B |
|---|---|---|---|
| Quadrant D |  |
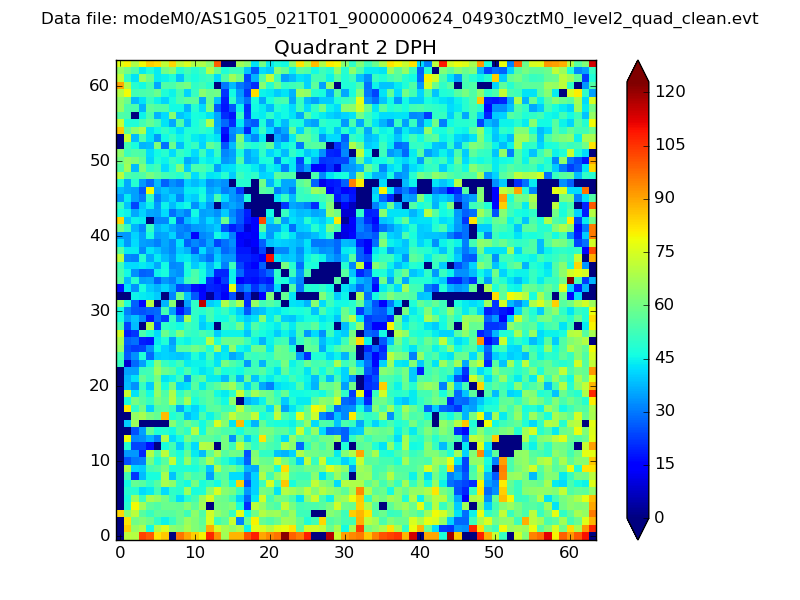 |
Quadrant C |
| Plot type | Count rate plots | Images |
|---|---|---|
| Comparison with Poisson distribution Blue bars denote a histogram of data divided into 1 sec bins. Red curve is a Poisson curve with rate = median count rate of data. |
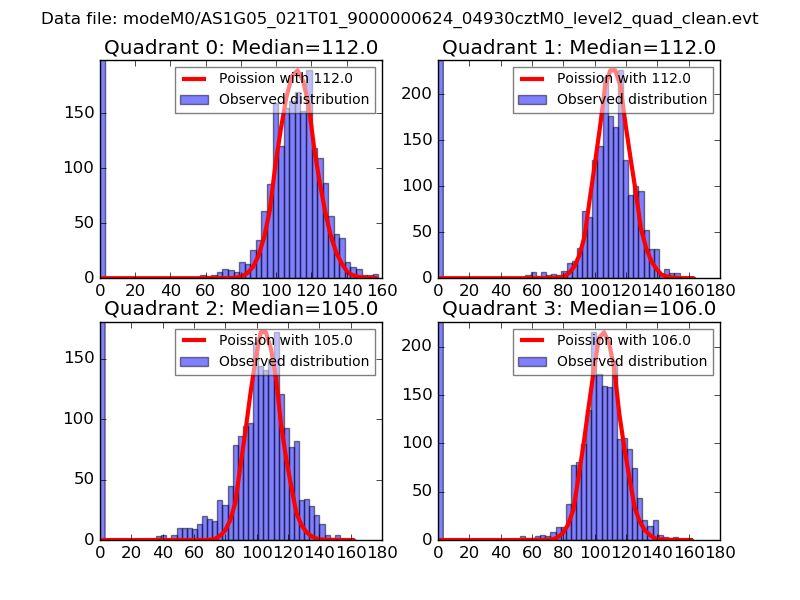 |
 |
| Quadrant-wise count rates Data is divided into 100 sec bins |
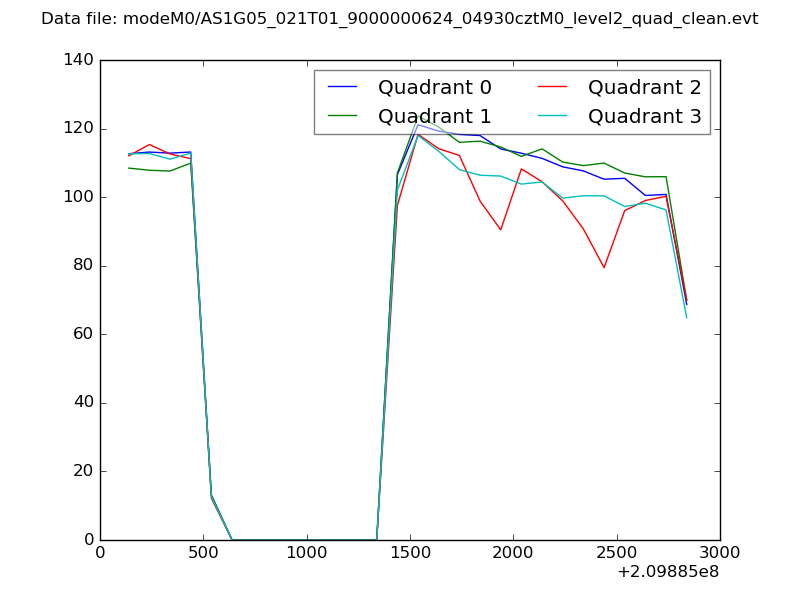 |
|
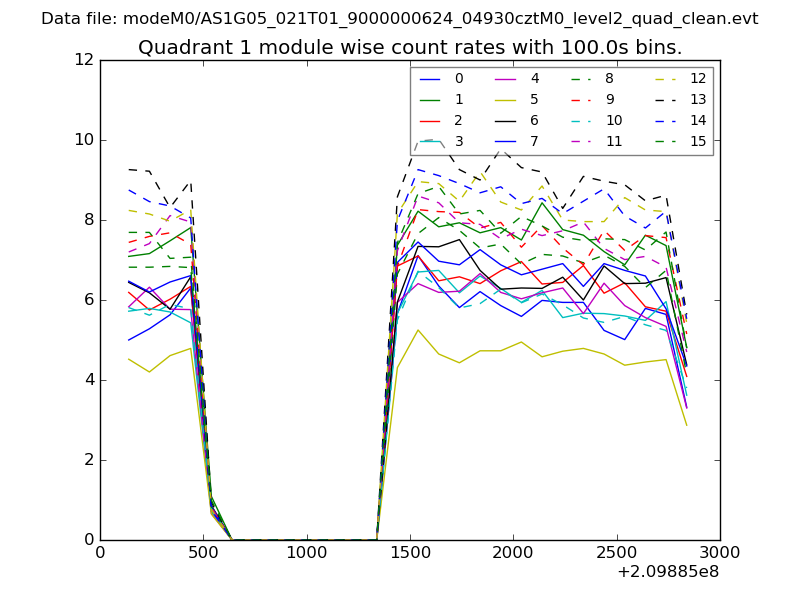
| Module-wise count rates for Quadrant A Data is divided into 100 sec bins |
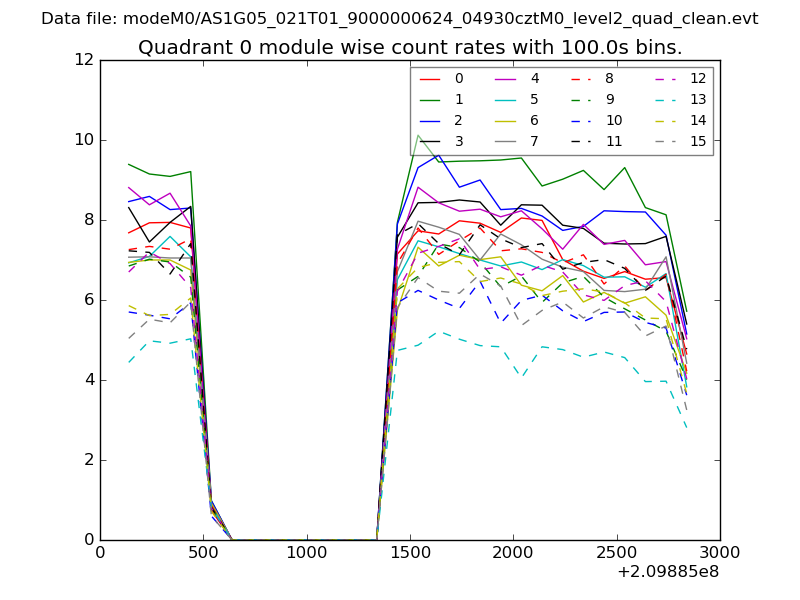 |
 |
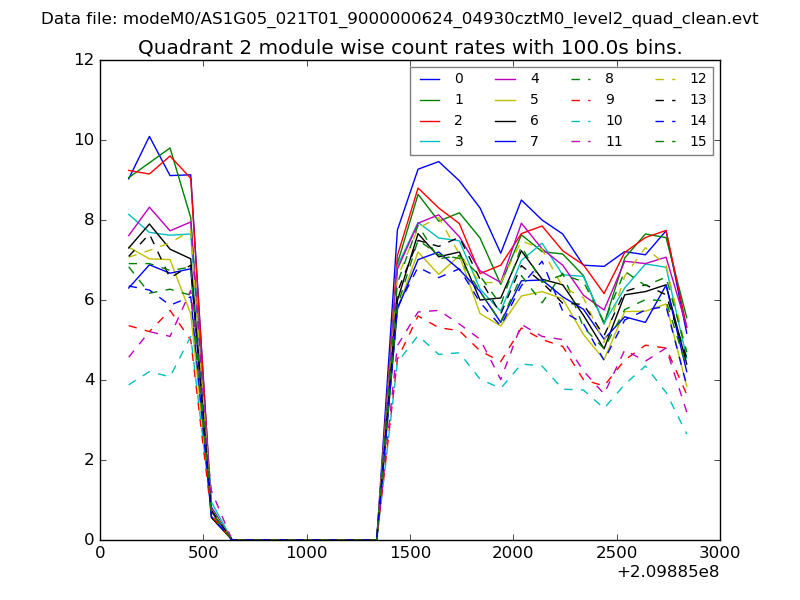
| Module-wise count rates for Quadrant B Data is divided into 100 sec bins |
 |
 |
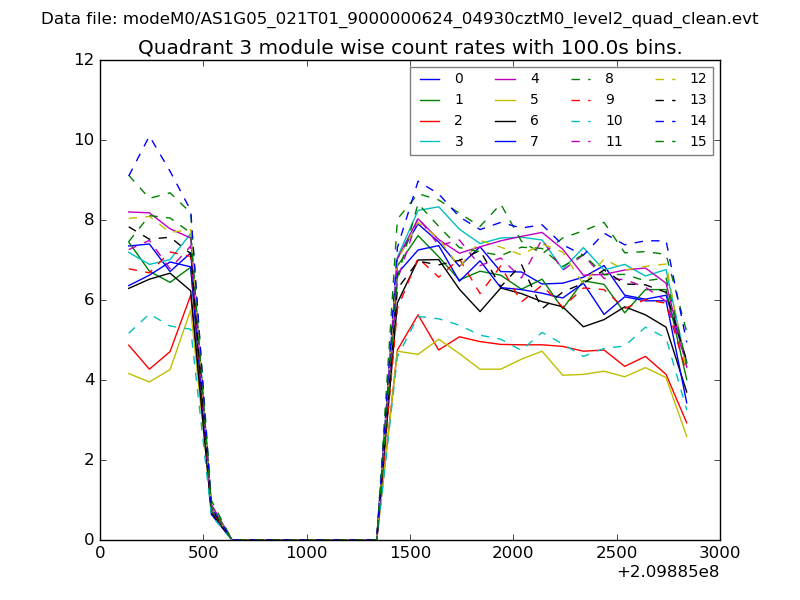
| Module-wise count rates for Quadrant C Data is divided into 100 sec bins |
 |
 |
| Module-wise count rates for Quadrant D Data is divided into 100 sec bins |
 |
 |
| Parameter | Plot |
|---|---|
| CZT HV Monitor | 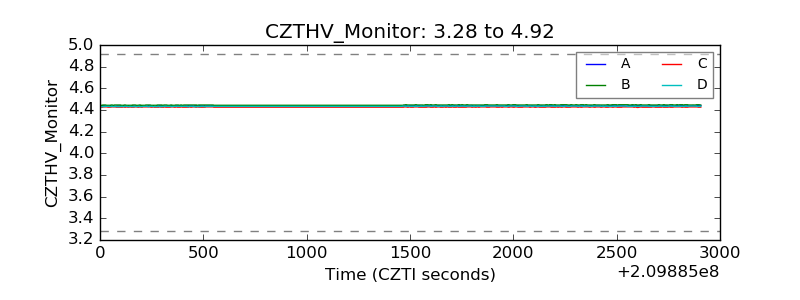 |
| D_VDD | 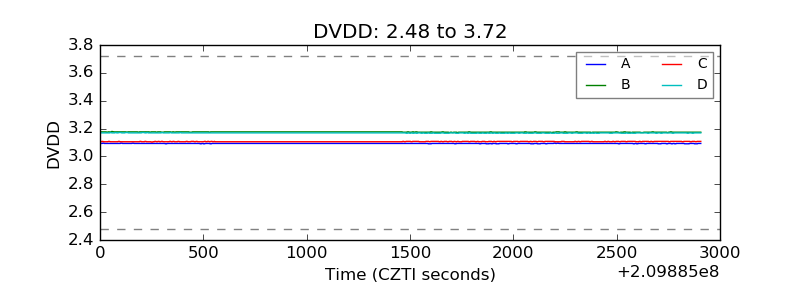 |
| Temperature 1 | 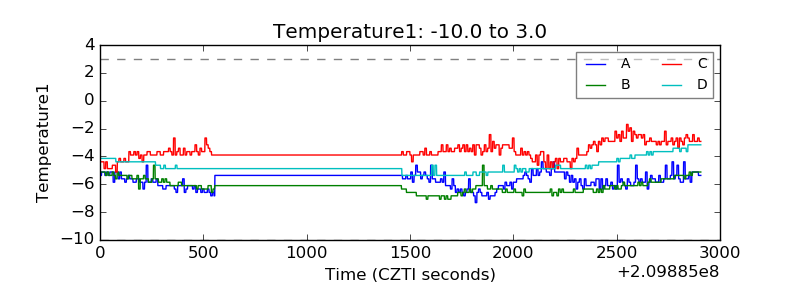 |
| Veto HV Monitor | 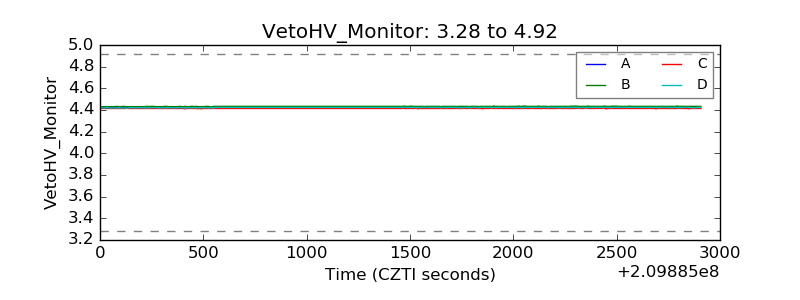 |
| Veto LLD | 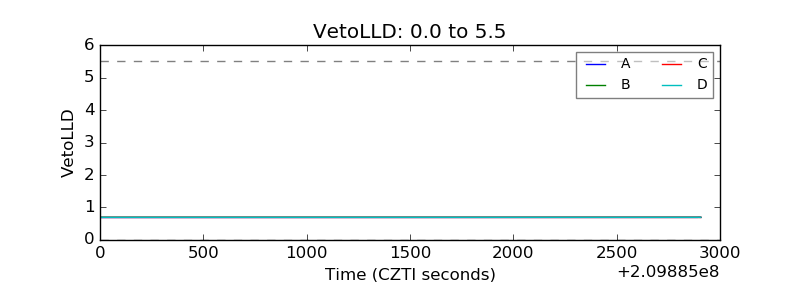 |
| Alpha Counter | 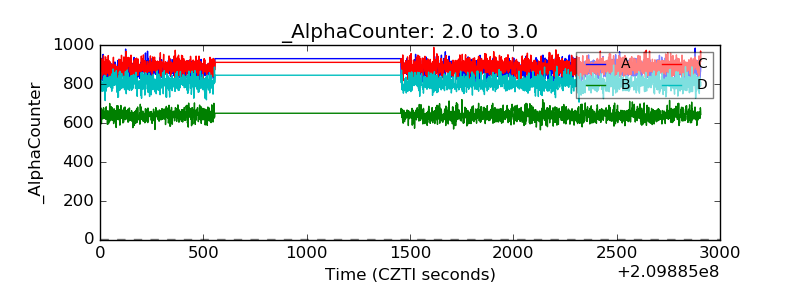 |
| _CPM_Rate | 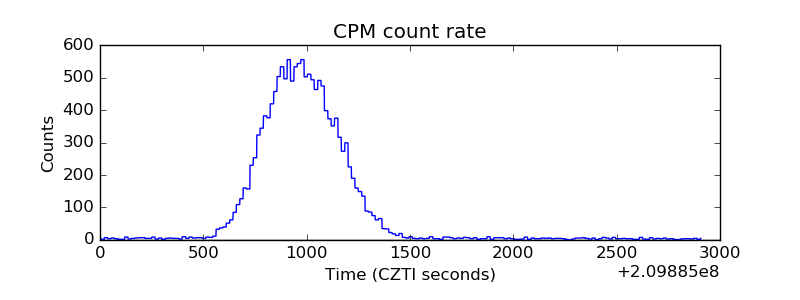 |
| CZT Counter | 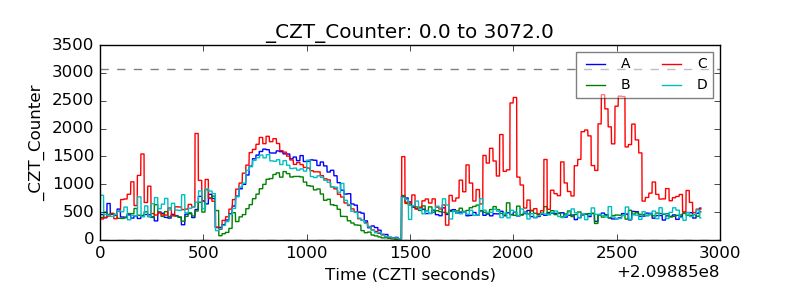 |
| +2.5 Volts monitor |  |
| +5 Volts monitor |  |
| _ROLL_ROT | 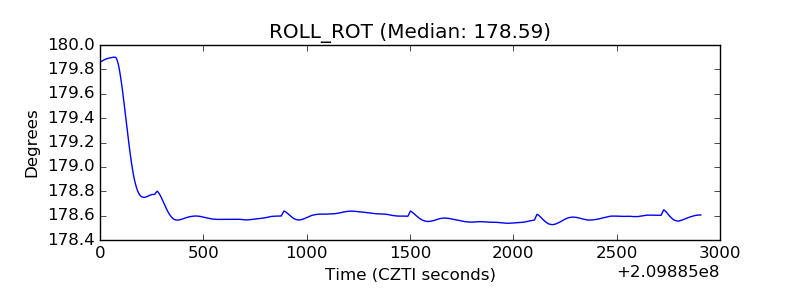 |
| _Roll_DEC | 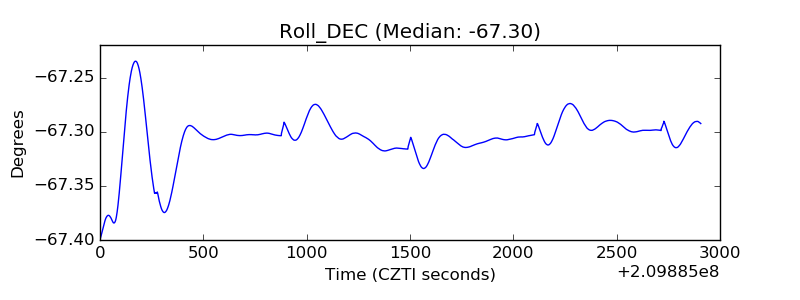 |
| _Roll_RA |  |
| Veto Counter | 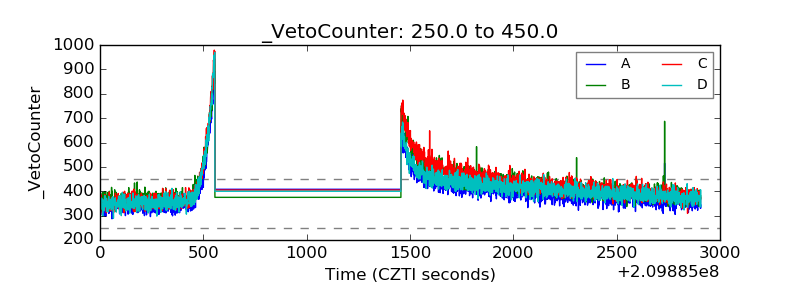 |